

Abstract
Background:
Bupropion (BUP) is widely used as an antidepressant and smoking cessation aid. There are three major pharmacologically active metabolites of BUP, Erythrohydrobupropion (EB), Hydroxybupropion (OHB) and Threohydrobupropion (TB). At present, the mechanisms underlying the overall disposition and systemic clearance of BUP and its metabolites have not been well understood, and the role of transporters has not been studied.
Objective:
The goal of this study was to investigate whether BUP and its active metabolites are substrates of the major hepatic uptake and efflux transporters.
Method:
CHO or HEK293 cell lines or plasma membrane vesicles that overexpress OATP1B1, OATP1B3, OATP2B1, OATP4A1, OCT1, BCRP, MRP2 or P-gp were used in cellular or vesicle uptake and inhibition assays. Liquid Chromatography-Tandem Mass Spectrometry (LC-MS/MS) was used to quantify transport activity.
Results:
BUP and its major active metabolites were actively transported into the CHO or HEK293 cells overexpressing OATP1B1, OATP1B3 or OATP2B1; however, such cellular active uptake could not be inhibited at all by prototypical inhibitors of any of the OATP transporters. These compounds were not transported by OCT1, BCRP, MRP2 or P-gp either. These results suggest that the major known hepatic transporters likely play a minor role in the overall disposition and systemic clearance of BUP and its active metabolites in humans. We also demonstrated that BUP and its metabolites were not transported by OATP4A1, an uptake transporter on the apical membrane of placental syncytiotrophoblasts, suggesting that OATP4A1 is not responsible for the transfer of BUP and its metabolites from the maternal blood to the fetal compartment across the placental barrier in pregnant women.
Conclusion:
BUP and metabolites are not substrates of the major hepatic transporters tested and thus these hepatic transporters likely do not play a role in the overall disposition of the drug. Our results also suggest that caution should be taken when using the model CHO and HEK293 cell lines to evaluate potential roles of transporters in drug disposition.
Keywords: Bupropion, hydroxybupropion, threohydrobupropion, erythrohydrobupropion, OATP, OCT1, BCRP, MRP2, P-gp
1. INTRODUCTION
Bupropion (BUP) is a dopamine-norepinephrine reuptake inhibitor and nicotinic receptor antagonist widely used as antidepressant and smoking cessation [1–3]. Recently, it has also been indicated for weight loss combination therapy and is reportedly used off-label for the attention-deficit hyperactive and bipolar disorders [4–8].
Despite its wide applications, the factors that contribute to interindividual variability in BUP disposition and pharmacokinetics remain not well understood. Several studies have reported that only 1% of the BUP dose is excreted unchanged in urine, indicating extensive metabolism of the drug [9–11]. BUP is primarily metabolized in the liver by cytochrome P450 enzymes, 11β-hydroxysteroid Dehydrogenase-1 (11β-HSD1), and aldoketoreductases [5, 12, 13]. The three resulting metabolites, Hydroxybupropion (OHB), Erythrohydrobupropion (EB) and Threohydrobupropion (TB), are also pharmacologically active, with OHB being 50–100% and TB and EB being 20% active as BUP [14, 15]. OHB and TB, but not EB, circulate at 3 – 30-fold higher concentrations than the parent drug [10, 13, 16, 17]. A detailed schematic of the current understanding of bupropion metabolic pathways was recently published [18].
Since the liver is the primary site of metabolism and elimination, drugs must enter the liver in order for biotransformation and excretion to occur. Drugs may enter the liver by passive diffusion or transporter-mediated active uptake [19]. Organic Anion-Transporting Polypeptide (OATP) uptake transporters are highly expressed in many organs such as the human liver, intestine, and placenta, and thus critically important for drug disposition [19–22]. OATP1B1, OATP1B3 and OATP2B1 are located in the sinusoidal membrane of hepatocytes, facilitating drug uptake into the hepatocytes prior to metabolism [19, 23]. OATP2B1 is also expressed in the basal membrane of placental syncytiotrophoblasts, possibly transporting drugs and metabolites from the fetal compartment to the placenta, whereas OATP4A1 is highly expressed in the apical membrane of syncytiotrophoblasts and may mediate uptake of drugs from the maternal circulation into the placenta [24]. Hence, the systemic and local tissue exposure of OATP substrate drugs could be affected by Drug-Drug Interactions (DDIs) through inhibition or induction of OATPs. Previous studies have shown that several drugs such as clopidogrel and ticlopidine significantly increase the systemic exposure (AUC) of BUP by 30–60% but disproportionately decreased metabolite OHB AUC by 60–89% [25]. This discrepancy may be due to inhibition of both hepatic CYP enzymes as well as uptake transporters. Clopidogrel is a known effective inhibitor of OATP1B1 and has been suggested to be involved in OATP1B1-mediated DDIs [26]. This led us to hypothesize that the entry of BUP into the hepatocytes is mediated by OATPs.
Furthermore, BUP has been linked to the high risk of drug-induced liver injury [27]. Intracellular accumulation of some drugs has been associated with hepatic toxicity [28]. The concentration of drugs in the liver could be determined by uptake transporters in the sinusoidal membrane and accumulation of drugs in the liver could be determined by the efflux transporters in the canalicular membrane of liver hepatocytes. Multidrug Resistance-Associated Protein 2 (MRP2), P-glycoprotein (P-gp), Breast Cancer Resistance Protein (BCRP) are the three major ATP-binding cassette efflux transporters that are highly expressed in the canalicular membrane of liver hepatocytes [29], facilitating the elimination of endogenous substances and xenobiotics into the bile by actively transporting them against a concentration gradient [30]. MRP2, P-gp and BCRP are also the major efflux transporters at the blood-brain barrier and the placental barrier that limit drug exposure to the brain and fetus [31–37]. Whether these efflux transporters are important for biliary elimination and local tissue exposure of BUP and its metabolites are not known.
Therefore, in the present study, we investigated whether the major hepatic transporters important for drug disposition, including OATP1B1, OATP1B3, OATP2B1, MRP2, P-gp and BCRP, are capable of transporting BUP and its active metabolites. Transport of these compounds by OATP4A1, an uptake transporter in the apical membrane of placental syncytiotrophoblasts, was also evaluated. The data obtained will be important for understanding the role of transporters in the overall disposition, local tissue (e.g., the liver and placenta) exposure, systemic clearance, and DDIs of BUP and its metabolites.
2. MATERIALS AND METHODS
2.1. Materials
BUP, OHB, TB, EB, BUP-d9, OHB-d6, TB-d9, EB-d9 were purchased from Toronto Research Chemicals (Ontario, Canada). Estrone-3-sulfate (E1–3-S), estradiol-17β-glucuronide (E2-17β-G), Rifampin (RIF), probenecid, Decynium-22 (D-22), Cyclosporin A (CsA), quinidine, and Nmethyl-quinidine (NMQ) were purchased from Sigma (St. Louis, MO). [3H]-MPP+ was purchased from Perkin Elmer (Waltham, MA). Hygromycin B and G418 were purchased from Fisher Scientific (Waltham, MA). All other chemicals and buffers used were of the highest commercial quality available. Dulbecco’s Modified Eagle’s Medium (DMEM), antibiotic-antimitotic solution, and Hank’s balanced salt solution (HBSS) containing 1g/L D-glucose were purchased from Invitrogen (Carlsbad, CA). Fetal bovine serum (FBS) was purchased from Seradigm (Radnor, PA). Flp-In Human Embryonic Kidney (HEK)/OATP2B1, HEK/OCT1 and Flp-In HEK/pcDNA5 cells were developed in the laboratory of Dr. Joanne Wang by stable transfection. HEK/empty vector and HEK/OATP4A1 cells were kindly provided by Dr. Joerg Koenig in the Institute of Experimental and Clinical Pharmacology and Toxicology, University of Erlangen, Germany. Chinese Hamster Ovary (CHO) wild-type (WT), CHO/OATP1B1 and CHO/OATP1B3 cells were from Dr. Bruno Stieger in the Department of Clinical Pharmacology and Toxicology, University Hospital Zurich, Switzerland, through Dr. Bruno Hagenbuch in the Department of Pharmacology, Toxicology and Therapeutics at University of Kansas Medical Center. Multiscreen™ HTS Vacuum Manifold and 96-well filter plates with glass fiber filters were from Merck Millipore (Billerica, MA). HEK293 vesicular transport membranes overexpressing MRP2, P-gp or BCRP or mock control membrane vesicles were purchased from Solvo Biotechnology (Szeged, Hungary). All transporters investigated in this study are human transporters.
2.2. Cell Culture
All cells were maintained in a humidified incubator at 37°C with 5% CO2. OATP-overexpressing CHO cells were cultured in phenol-red free, low glucose DMEM with 10% FBS, 100 U/mL penicillin, 100 μg/mL streptomycin, 0.2 μg/mL amphotericin B, 50 μg/mL L-proline, and in the presence or absence of 500 μg/mL G418 (for OATP transfected or WT CHO cells, respectively). Flp-In HEK/pcDNA5, Flp-In HEK/OATP2B1 and Flp-In HEK/OCT1 cells were cultured in DMEM with 10% FBS, 100 U/mL penicillin, 100 μg/mL streptomycin, 0.2 μg/mL amphotericin B, and 500 μg/mL hygromycin B. HEK/empty vector and HEK/OATP4A1 were cultured under the same condition as HEK/pcDNA5, but in the presence of 500 μg/mL G418 instead of hygromycin B. Cells used in the experiments were between passages 8 and 25 to ensure good transporter expression and activity [38].
2.3. Cellular Uptake Transport Assay
HEK cells were seeded onto Poly-D-Lysine-coated 96-well plates at a density of approximately 25,000 cells/well and cultured for 48 h prior to uptake experiments. CHO cells were seeded onto Collagen I-coated 96-well plates at a density of approximately 10,000 cells/well and cultured for 48 h and then induced by adding sodium butyrate to 5 mM in culture media for 24 h prior to uptake experiments. On the day of uptake experiments, each well was washed with 100 μL of HBSS (pH 7.4) and allowed to equilibrate in HBSS in 37°C water bath for 5 min. BUP or metabolite was then added to each well (0 – 300 μM) and incubation continued for 3 min (within linear range, Fig. S1). After the incubation, cells were promptly washed three times with ice-cold HBSS to terminate uptake reactions. Cells were then lysed with ice-cold acetonitrile containing an internal standard, and drug compounds in cell lysates were quantified using LC-MS assay as described below. Protein concentrations of cell lysates were determined using a Pierce BCA protein assay kit (Pierce Chemical, Rockford, IL) with bovine serum albumin as standard. Net transporter-mediated cellular uptake was calculated by subtracting intracellular accumulation in the parent or empty vector control cells from that in OATP/OCT-overexpressing cells and expressed as pmol of BUP, OHB, TB or EB/mg protein/min. The concentration of vehicle (DMSO) used to dissolve test compounds was kept below 0.2% (v/v) in all assays. To assess potential nonspecific binding, we also performed three independent experiments comparing uptake of BUP using the methods described above but washing the cells with either ice-cold HBSS or ice-cold HBSS containing 3% bovine serum albumin (BSA).
2.4. Cellular Uptake Inhibition Assay
HEK and CHO cells were cultured and incubated the same as described above. During the inhibition experiments, buffers containing the known OATP, OAT or OCT inhibitors (20 μM RIF and 20 μM CsA for OATP, 50 μM probenecid for OAT, 100 μM D-22 for OCT) were added to each well and incubation continued for 5 min at 37°C. The inhibitor concentrations used were well above the reported IC50 values for respective transporters. After the 5 min of pre-incubation, the buffers were aspirated and fresh buffers containing both the inhibitor and a test compound were added to each well. Then, the uptake reactions and sample extraction procedures were the same as described above.
2.5. Plasma Membrane Vesicle Transport Assay
The rapid filtration method for vesicular uptake transport assays was used as previously described [39]. Details of the method can be found in supplemental materials.
2.6. LC-MS/MS Quantification
The extraction of BUP and metabolites from cell lysates or membrane vesicle eluents was conducted in 96-well plates with acetonitrile protein precipitation. Briefly, 100 μL of ice-cold acetonitrile containing 200 nM of an internal standard was added to each well, and then 100 μL of water was added for a final v/v ratio of 1:1 after 30 min. Samples were centrifuged at 4°C with 4,000 rpm for 5 min, and the supernatant was injected onto liquid chromatography-tandem mass spectrometry (LC-MS/MS). Quantification of BUP and metabolites by LC-MS/MS was adapted and modified from previously published methods [18, 40] on Agilent 1290 ultra-high-performance liquid chromatography interfaced with an Agilent 6410 B triple-quadrupole mass spectrometer (Agilent Technologies, Palo Alto, CA). Details of the LC-MS/MS conditions can be found in supplemental materials.
2.7. OCT1 Uptake and [3H]-MPP+ Quantification
HEK293 cells stably expressing OCT1 (HEK293/OCT1) or empty vector (HEK293/pcDNA5) were plated in 24 well plates at the density of 400,000 cells/well. Three days after plating, cells were washed with pre-warmed HBSS (140 mM NaCl, 5 mM KCl, 1 mM CaCl2, 0.4 mM MgSO4, 0.5 mM MgCl2, 0.3 mM KH2PO4, 6 mM glucose and 4 mM Na-HCO3) twice to remove residual medium. HBSS solution containing 1 μM MPP+ (0.6 μCi/mL [3H]-MPP+) in the presence or absence of 100 μM quinone was then incubated with cells for 10 min at 37°C. Incubation was stopped by removing the solution and immediately washing with ice-cold HBSS 3 times. Cells were lysed with 500 μL of 1M NaOH for 1 h at 37°C, and neutralized with 500 μL of 1 M HCl. The lysates (500 μL each sample) were transferred and the radioactivity was counted with TRI-CARB Scintillation Counter. Twenty-five μL of lysate was used to measure protein concentration by BCA. The radioactivity uptake of each well was then normalized with protein concentration.
2.8. Data Analysis
All transport studies were performed with three independent experiments in triplicate for each experiment. Data shown were means ± SD of three independent experiments. The differences in cellular uptake between the transporter-overexpressing and the parent or empty control cells were analyzed using the unpaired Student t-test. Apparent Km and Vmax values were calculated based on the Michaelis-Menten kinetics using the net cellular uptake data. The effects of the OATP inhibitor rifampin and CsA, the OAT inhibitor probenecid or the OCT/PMAT/MATE inhibitor D-22 on cellular uptake were analyzed by two-way ANOVA analysis followed by the Bonferroni correction for multiple comparison. Differences with p values of < 0.05 were considered statistically significant. All the analysis was performed using the GraphPad Prism software (GraphPad Prism 5.01, La Jolla, CA).
3. RESULTS
3.1. Uptake of BUP and Metabolites into OATP-overexpressing Cells
We first verified if OATPs overexpressed in CHO or HEK cells can mediate cellular uptake of known substrates, E1-3-S and E2-17β-G. E1-3-S is a model substrate of OATP2B1 and OATP4A1, while E2-17β-G is a known substrate of OATP1B1 and OATP1B3. Uptake of E1-3-S at 5 μM into HEK/OATP2B1 and HEK/OATP4A1 cells were 42 and 20 times greater, respectively, than that into respective HEK vector control cells (Fig. S2). Likewise, uptake of E2-17β-G at 5 μM into CHO/OATP1B1 and CHO/OATP1B3 cells was approximately 6 and 2 times greater, respectively, than that into the CHO wild-type parent cells (Fig. S2). These results confirmed that OATPs overexpressed in CHO or HEK cells were functional.
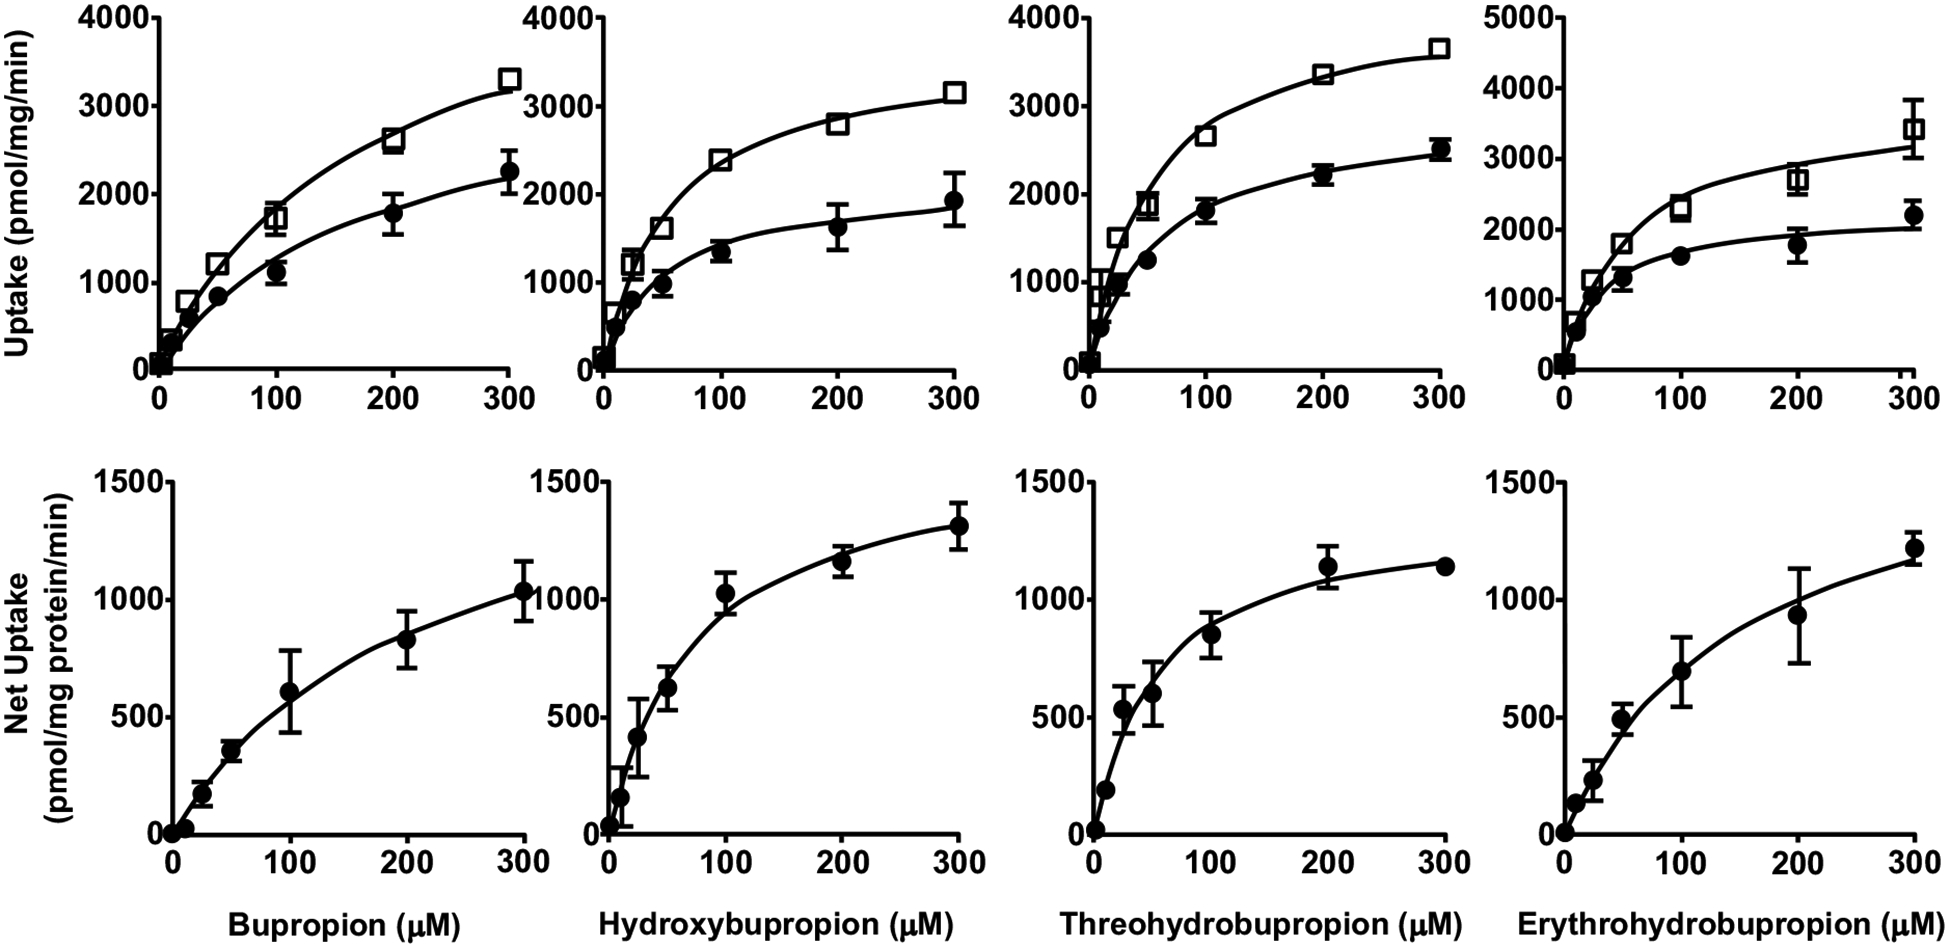
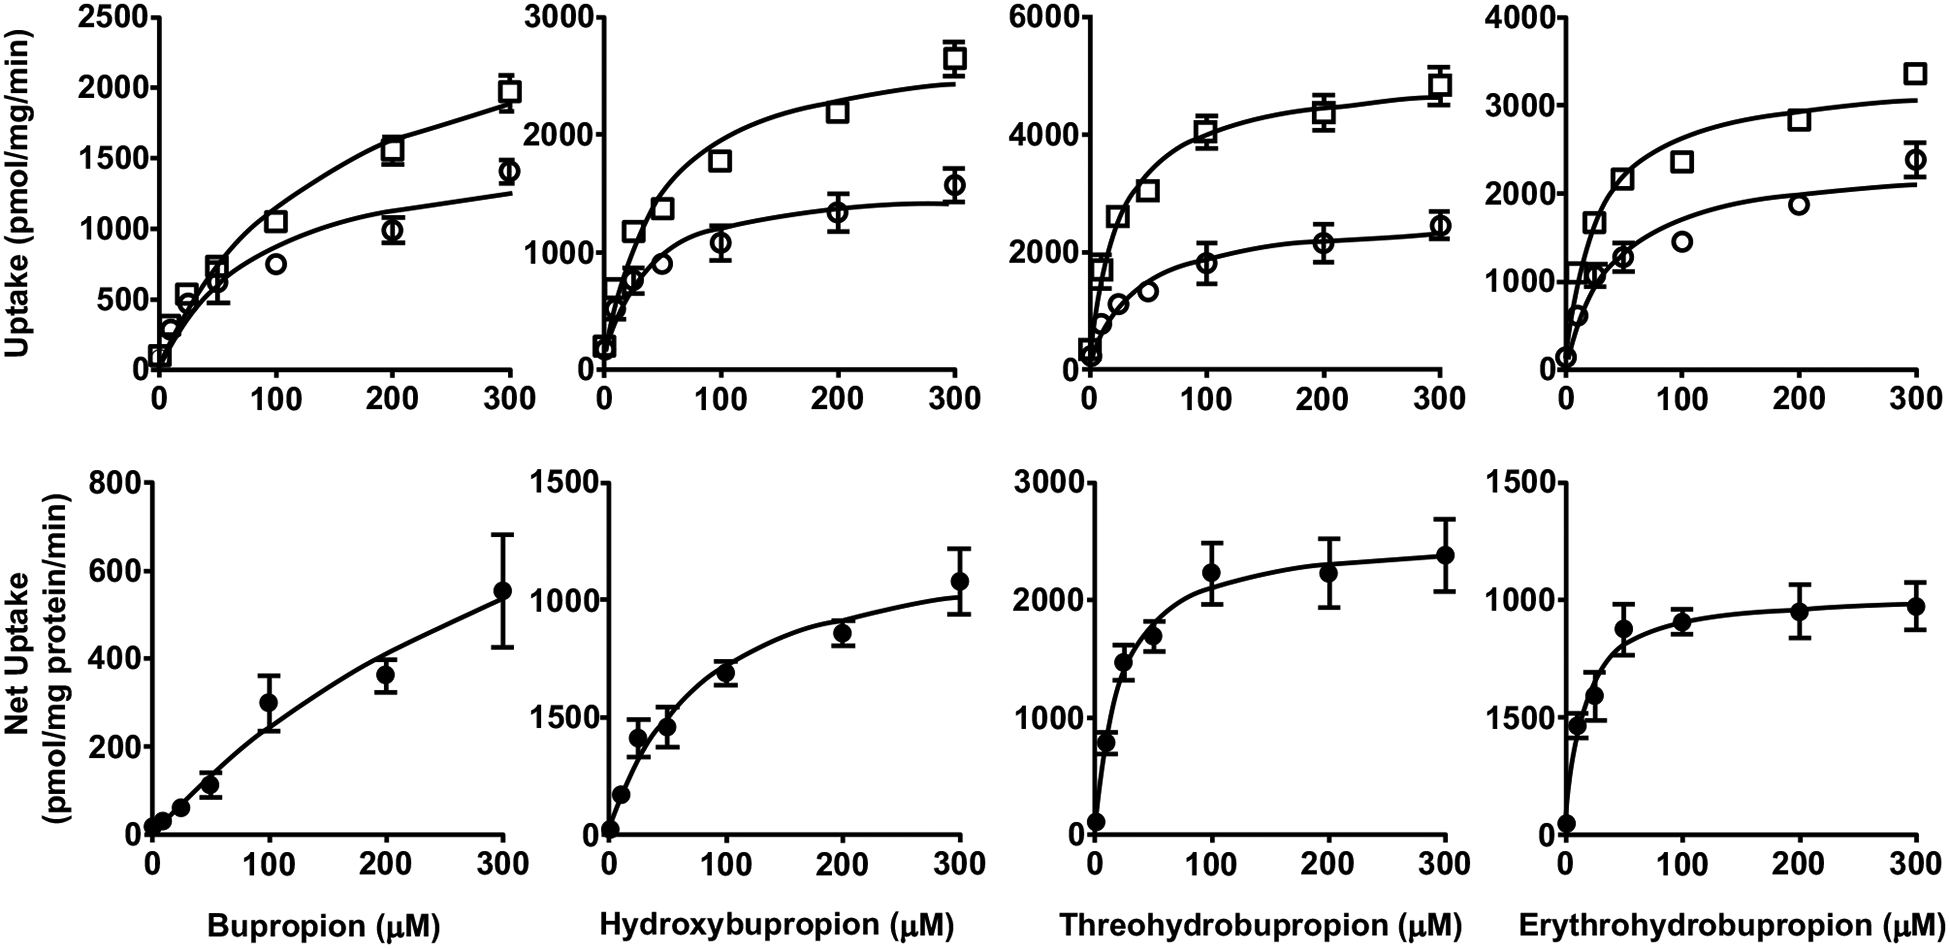
Next, we examined the uptake of BUP and metabolites into OATP-overexpressing and respective parent or empty vector control cells. We found that the uptake of all these compounds into the control cells was significantly lower than that into respective cells overexpressing OATP1B1, OATP1B3, or OATP2B1, over a concentration range of 0 – 300 μM (Figs. 1–3), but no significant differences between OATP4A1-overexpressing and control cells were observed (Fig. 4). These results suggest that OATP1B1, OATP1B3, and OATP2B1 could possibly mediate the cellular uptake of BUP and its metabolites, while OATP4A1 did not. We calculated the net cellular uptake by subtracting intracellular uptake associated with the parent or empty vector control cells from that associated with the OATP-overexpressing cells. The net cellular uptake appears to be saturable (Figs. 1–3). Hence, we estimated their “apparent Km” values using the Michaelis-Menten kinetics (Table 1).
Fig. (1).
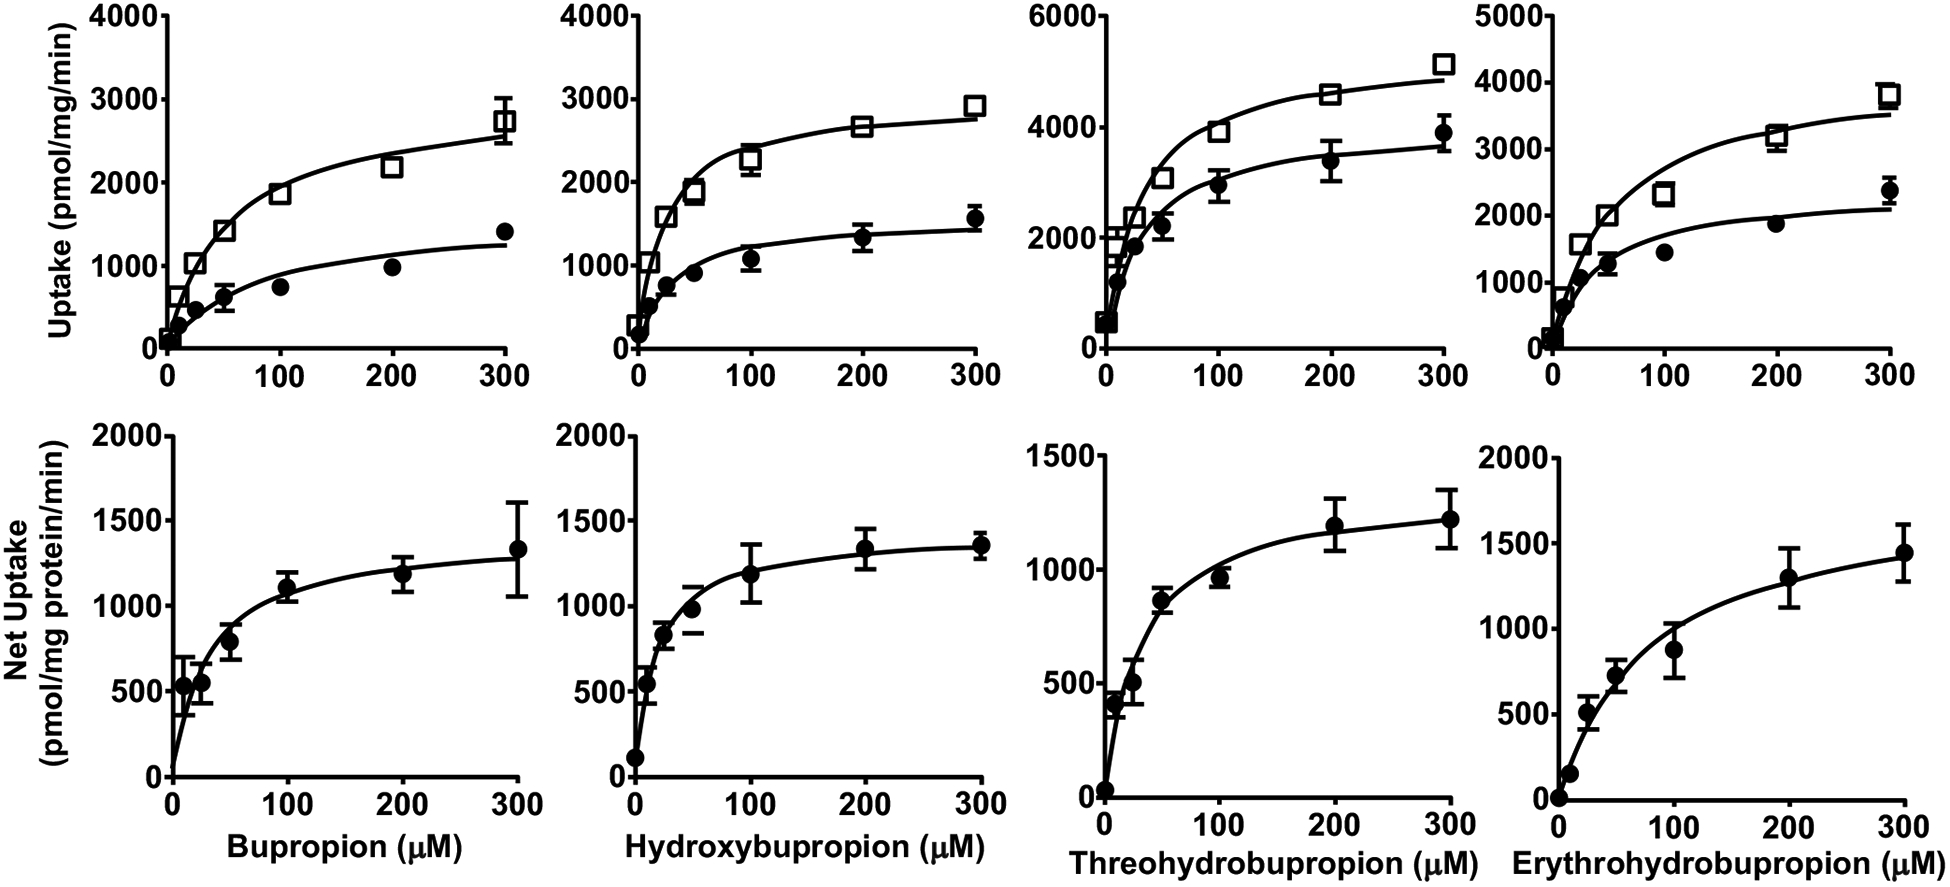
Uptake (upper panels) and net uptake (lower panels) of BUP and metabolites by CHO cells overexpressing OATP1B1. Cells were incubated in culture media with 1 – 300 μM BUP, OHB, TB or EB for 3 min. Uptake was terminated by adding ice-cold buffer and intracellular concentrations were determined using LC-MS/MS. Data shown are means ± SD of three independent experiments. Circles indicate uptake by the parent wild-type CHO cells, and squares indicate uptake by the OATP1B1-overexpressing CHO cells.
Fig. (3).
Uptake (upper panels) and net uptake (lower panels) of BUP and metabolites by HEK293 cells overexpressing OATP2B1. Cells were incubated in culture media with 1 – 300 μM BUP, OHB, TB or EB for 3 min. Uptake was terminated by adding ice-cold buffer and intracellular concentrations were determined using LC-MS/MS. Data shown are means ± SD of three independent experiments. Circles indicate uptake by the empty vector control HEK cells, and squares indicate uptake by the OATP2B1-overexpressing HEK cells.
Fig. (4).
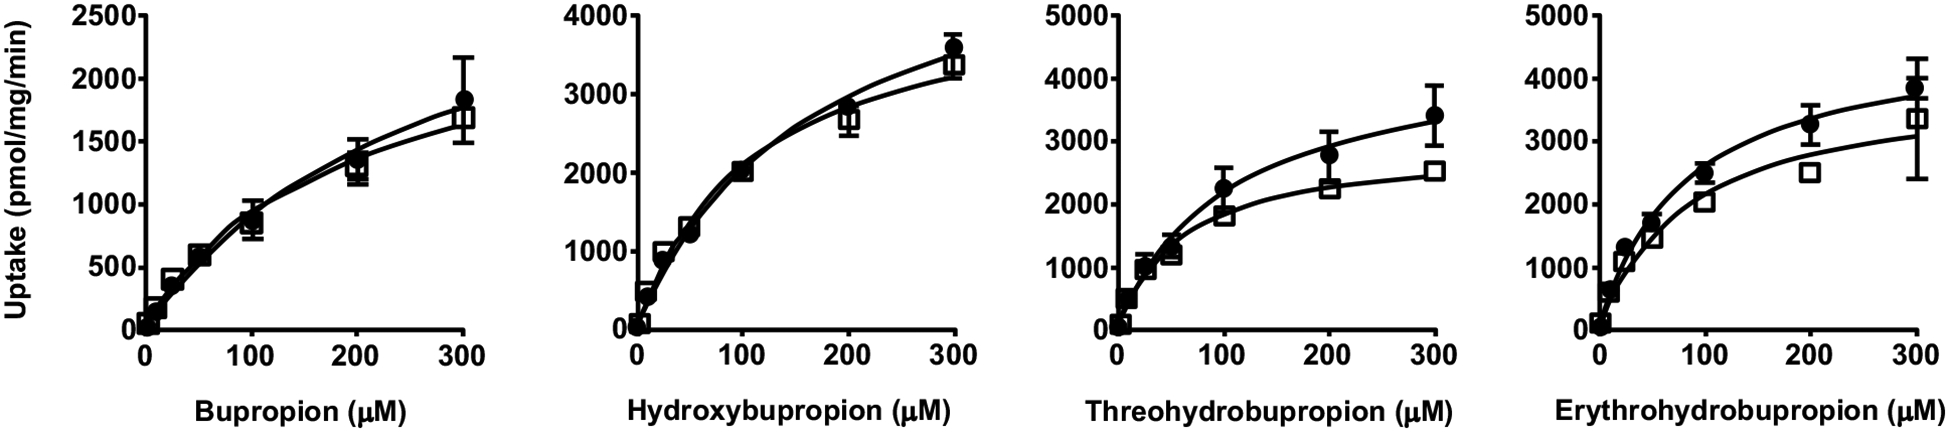
Uptake of BUP and metabolites by HEK293 cells overexpressing OATP4A1. Cells were incubated in culture media with 1 – 300 μM BUP, OHB, TB or EB for 3 min. Uptake was terminated by adding ice-cold buffer and intracellular concentrations were determined using LC-MS/MS. Data shown are means ± SD of three independent experiments. Circles indicate uptake by the empty vector control HEK cells, and squares indicate uptake by the OATP4A1-overexpressing HEK cells.
Table 1.
Apparent uptake transport kinetic parameters (Km and Vmax) for BUP and its metabolites into OATP1B1-, OATP1B3- or OATP2B1-overexpressing cells. Data shown are means ± SD estimated with the net cellular uptake data from three independent experiments. Units for Km and Vmax are μM and pmol/mg protein/min, respectively.
| - | BUP | OHB | TB | EB | |
|---|---|---|---|---|---|
| CHO/OATP1B1-overexpressing cells | Km | 31 ± 7 | 18 ± 3 | 33 ± 5 | 82 ± 16 |
| Vmax | 1407±91 | 1423 ± 49 | 1351±55 | 1806±133 | |
| CHO/OATP1B3-overexpressing cells | Km | 242 ± 64 | 76 ± 14 | 21 ± 3 | 14 ± 2 |
| Vmax | 1312±227 | 1258±86 | 2536±97 | 1026±37 | |
| HEK/OATP2B1-overexpressing cells | Km | 176 ± 20 | 74 ± 12 | 53 ± 9 | 192 ± 35 |
| Vmax | 1697±231 | 1641±98 | 1368±72 | 1752±192 | |
To further confirm whether OATPs can indeed mediate cellular uptake of BUP, we performed the cellular uptake experiments in the presence of rifampin (RIF) or cyclosporine A (CsA), a known potent, general inhibitor of OATPs at a concentration well above its IC50 value for respective OATP. We first verified the inhibitory effects of RIF and CsA using a model substrate E1–3-S in the cell lines, with 5 min and 60 min pre-incubations with and without an inhibitor (Fig. S3). Since no significant difference was observed with extended preincubation, we proceeded to perform inhibition studies with 5 min preincubation only. The reported IC50 values of RIF for OATP1B1, OATP1B3 and OATP2B1 were 1.5–3.25 μM, 1.5–2.6 μM, and 2.1 μM, respectively, so we chose 20 μM RIF to fully inhibit the transporters of interest [22, 41–43]. The concentration of BUP (5 μM) used in the inhibition experiments was well below the estimated apparent Km values for respective OATPs. Surprisingly, under these conditions, we showed that the cellular uptake of BUP into the OATP-overexpressing cells was not inhibited at all by RIF (Fig. 5). We further confirmed this finding using another potent OATP inhibitor, CsA, which did not inhibit the cellular uptake of BUP into the OATP-overexpressing cells either (Fig. 5). These results suggest that the observed cellular uptake of BUP into OATP-overexpressing cells is mediated by other transporters, but not OATPs.
Fig. (5).
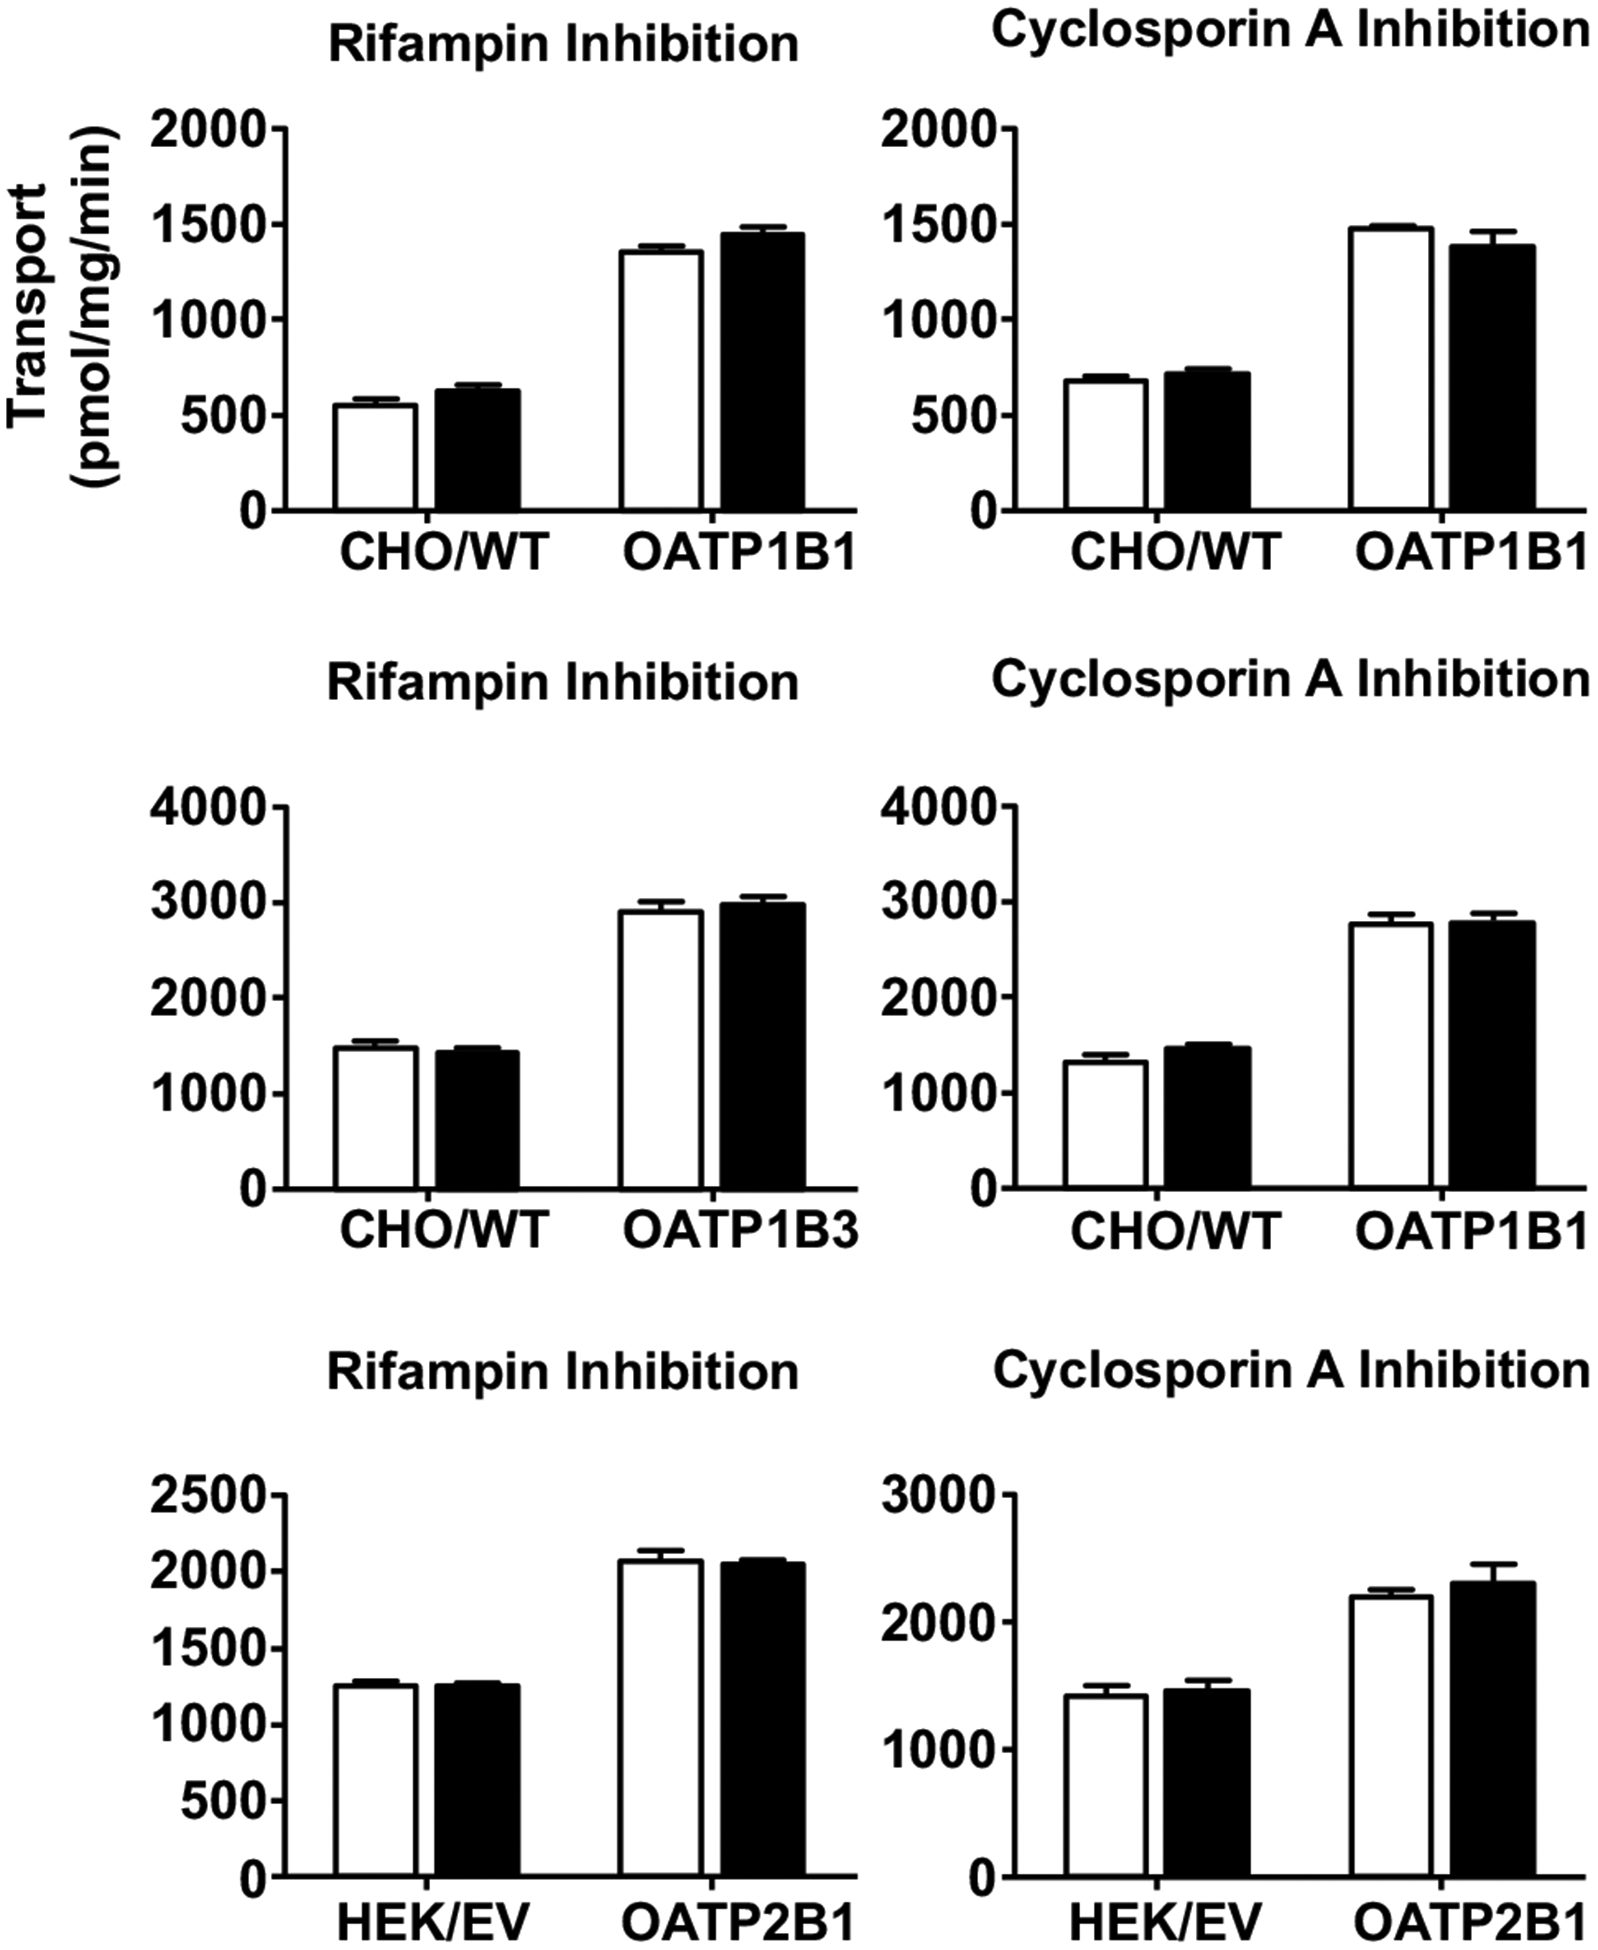
No inhibition of cellular uptake of BUP by rifampin (left panels) and cyclosporin A (right panels). Cells were pre-incubated with or without an inhibitor (20 μM rifampin or 20 μM cyclosporine A) for 10 min, and then BUP was added to a final concentration of 5 μM and incubation was continued for 3 min. Afterward, transport was terminated and intracellular concentrations were determined using LC-MS/MS. Open bars and filled bars indicate uptake of BUP in the absence and presence of an inhibitor, respectively. Data shown are means ± SD of three independent experiments. Cells overexpressing OATP1B1, OATP1B3 and OATP2B1 as well as their corresponding parent (CHO/WT) or empty vector (HEK/EV) control cells were used.
We also performed inhibition studies of the cellular uptake of metabolites by 20 μM RIF, with concentrations of each metabolite well below their estimated apparent Km values for each OATP-overexpressing cell line. For OATP1B1, 10 μM of OHB, 20 μM of TB and 30 μM of EB were used; for OATP1B3, 30 μM of OHB, 10 μM of TB and 5 μM of EB were used; for OATP2B1, 30 μM of OHB, 20 μM of TB and 100 μM of EB were used. Likewise, no statistically significant differences in the cellular uptake of the metabolites between the presence and absence of RIF into both the OATP-overexpressing and the parent or empty vector control cells were observed (Fig. 6), suggesting that the cellular uptake of the metabolites is not mediated by OATPs either.
Fig. (6).
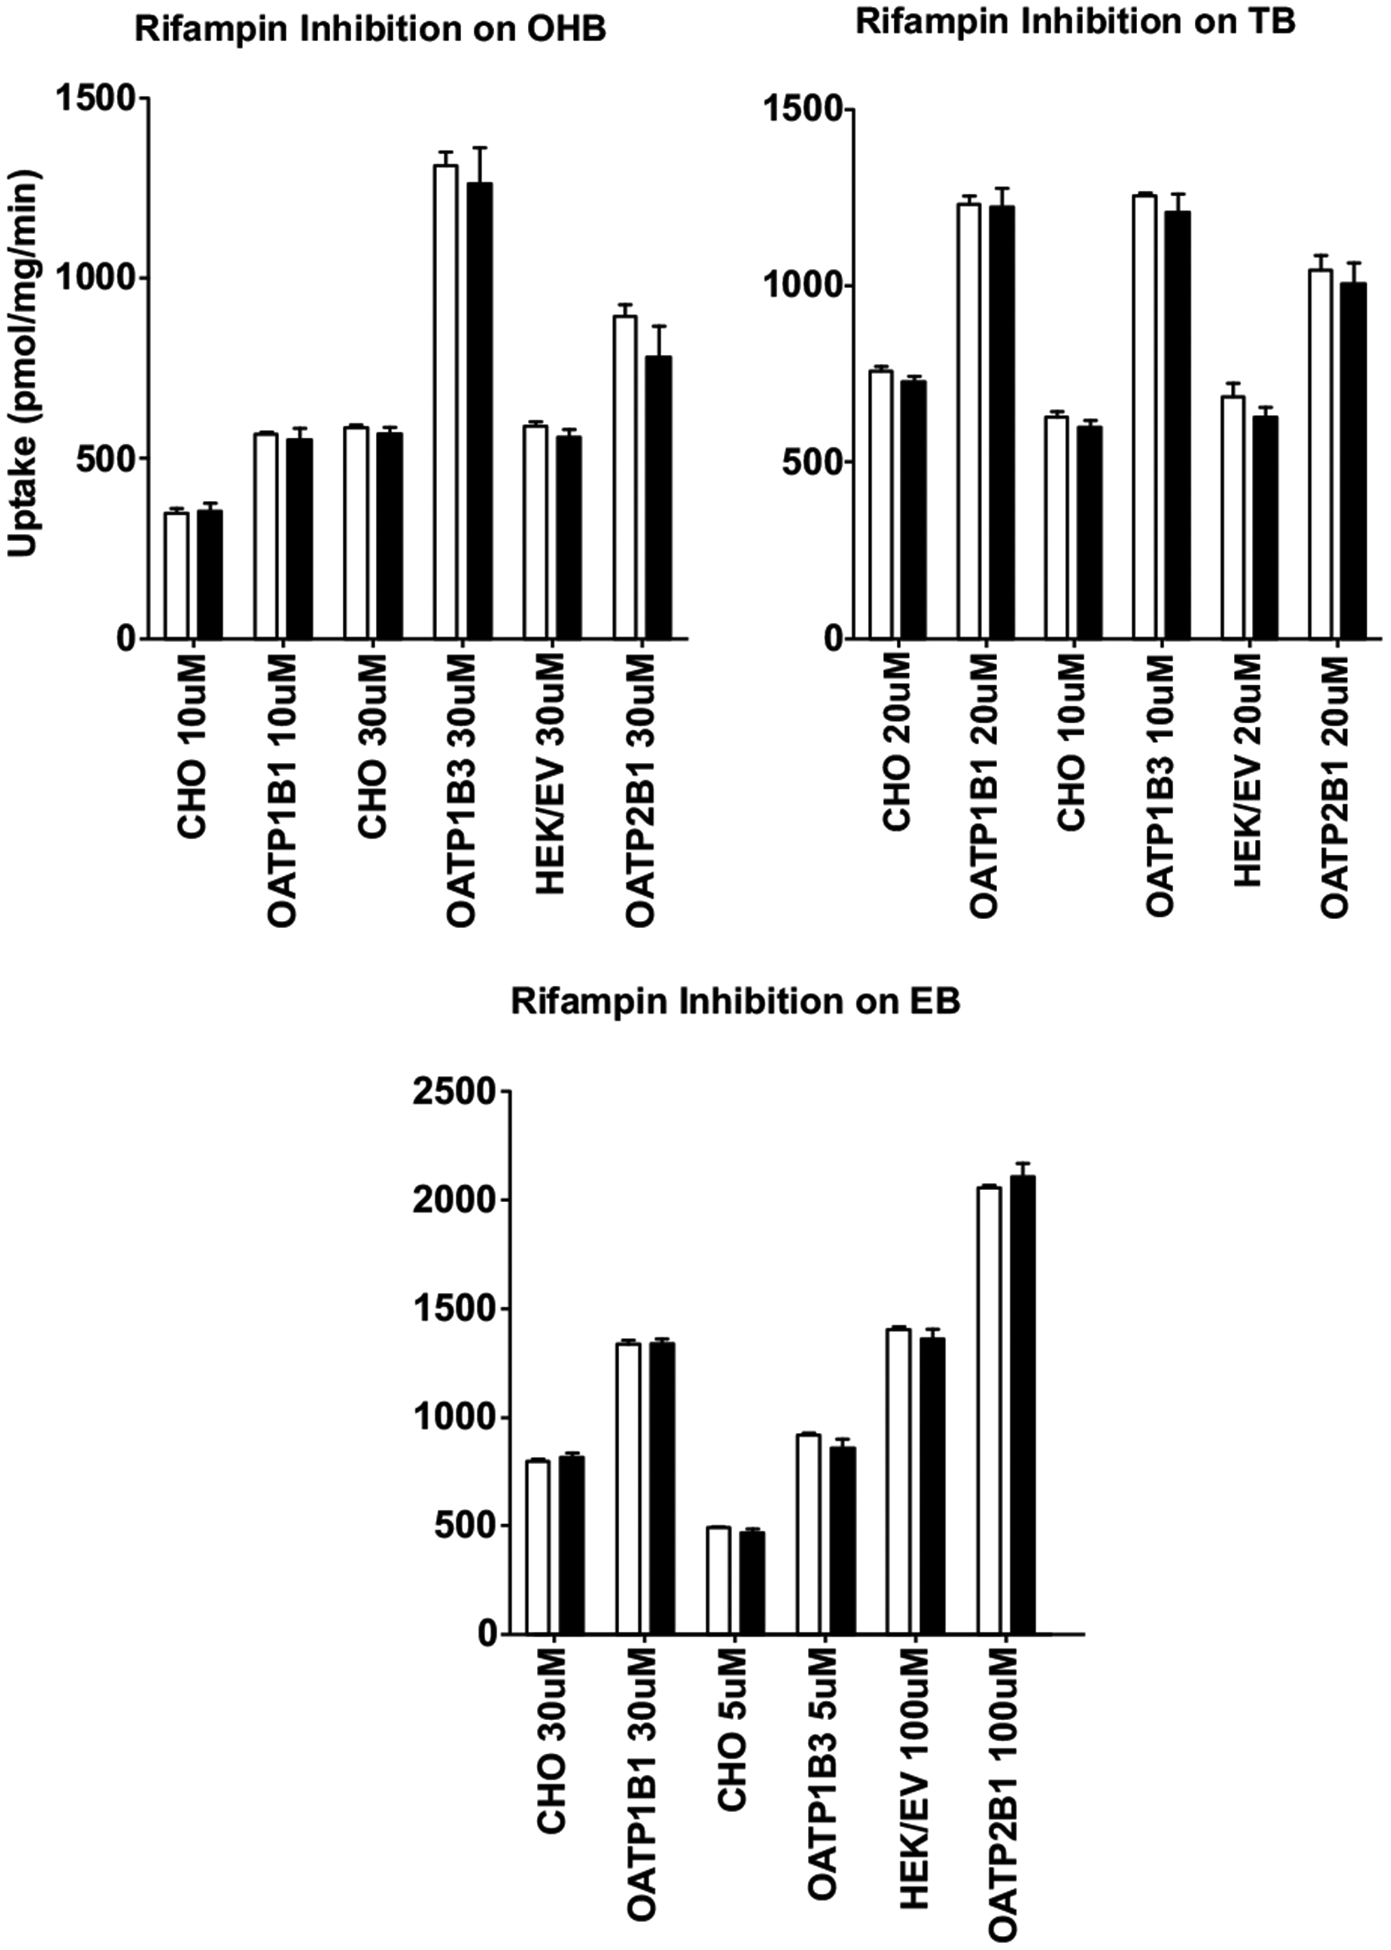
No inhibition of cellular uptake of OHB, TB, and EB by rifampin. Cells were pre-incubated with or without 20 μM rifampin for 10 min, then OHB, TB or EB was added to a final concentration (shown in the figure) lower than their respective apparent Km. Incubation was continued for 3 min and then immediately terminated. Intracellular concentrations were determined using LC-MS/MS. Open bars and filled bars indicate uptake of OHB, TB or EB in the absence and presence of rifampin, respectively. Data shown are means ± SD of three independent experiments. Cells overexpressing OATP1B1, OATP1B3 and OATP2B1 as well as their corresponding parent (CHO) or empty vector (HEK/EV) control cells were used.
Lastly, we assessed the impact of non-specific binding of BUP to cell membranes on cellular uptake by comparing intracellular accumulation of BUP in each cell line after washing the cells with ice-cold HBSS in the presence or absence of 3% BSA. Although some non-specific binding was observed as washing the cells with BSA decreased cellular uptake of BUP, the uptake of BUP into transporter-transfected cells were still significantly higher than that in parent or vector control cells (Fig. S4). Therefore, the higher cellular uptake of BUP into transporter-transfected cells is unlikely due to differential non-specific binding.
3.2. Cellular Uptake of BUP by Endogenous Transporters
The saturable uptake transport kinetics of BUP and metabolites into the parent or empty vector control cells or the OATP-overexpressing cells suggests that this cellular uptake is mediated by active transporters, rather than passive diffusion. Further, the inhibition studies showed that the uptake of BUP was not mediated by OATPs. This raised suspicions that endogenous transporters in these cell lines were responsible for the uptake. To test this possibility, we performed additional inhibition experiments using probenecid, a known OAT inhibitor, and D-22, a known inhibitor of OCT/PMAT/MATE transporters. The concentrations of the inhibitors used were kept at least 5-fold above their known IC50 values for respective transporters to ensure full inhibition. The reported IC50 values of probenecid and D-22 were 3.1–7.4 μM and 13.8–21.9 μM, respectively [44–47]. Therefore, probenecid and D-22 were used at 50 μM and 100 μM, respectively. Likewise, we used BUP at concentrations that were well below the apparent Km values where no saturation would occur. No inhibition of BUP uptake into both the OATP-overexpressing cells and their respective control cells by probenecid was observed (Fig. 7), suggesting that the BUP uptake is not mediated by OATs. However, a significant decrease in the cellular uptake of BUP was seen in both the OATP-overexpressing and control cells when D-22, a known OCT/PMAT/MATE inhibitor, was used (Fig. 7).
Fig. (7).
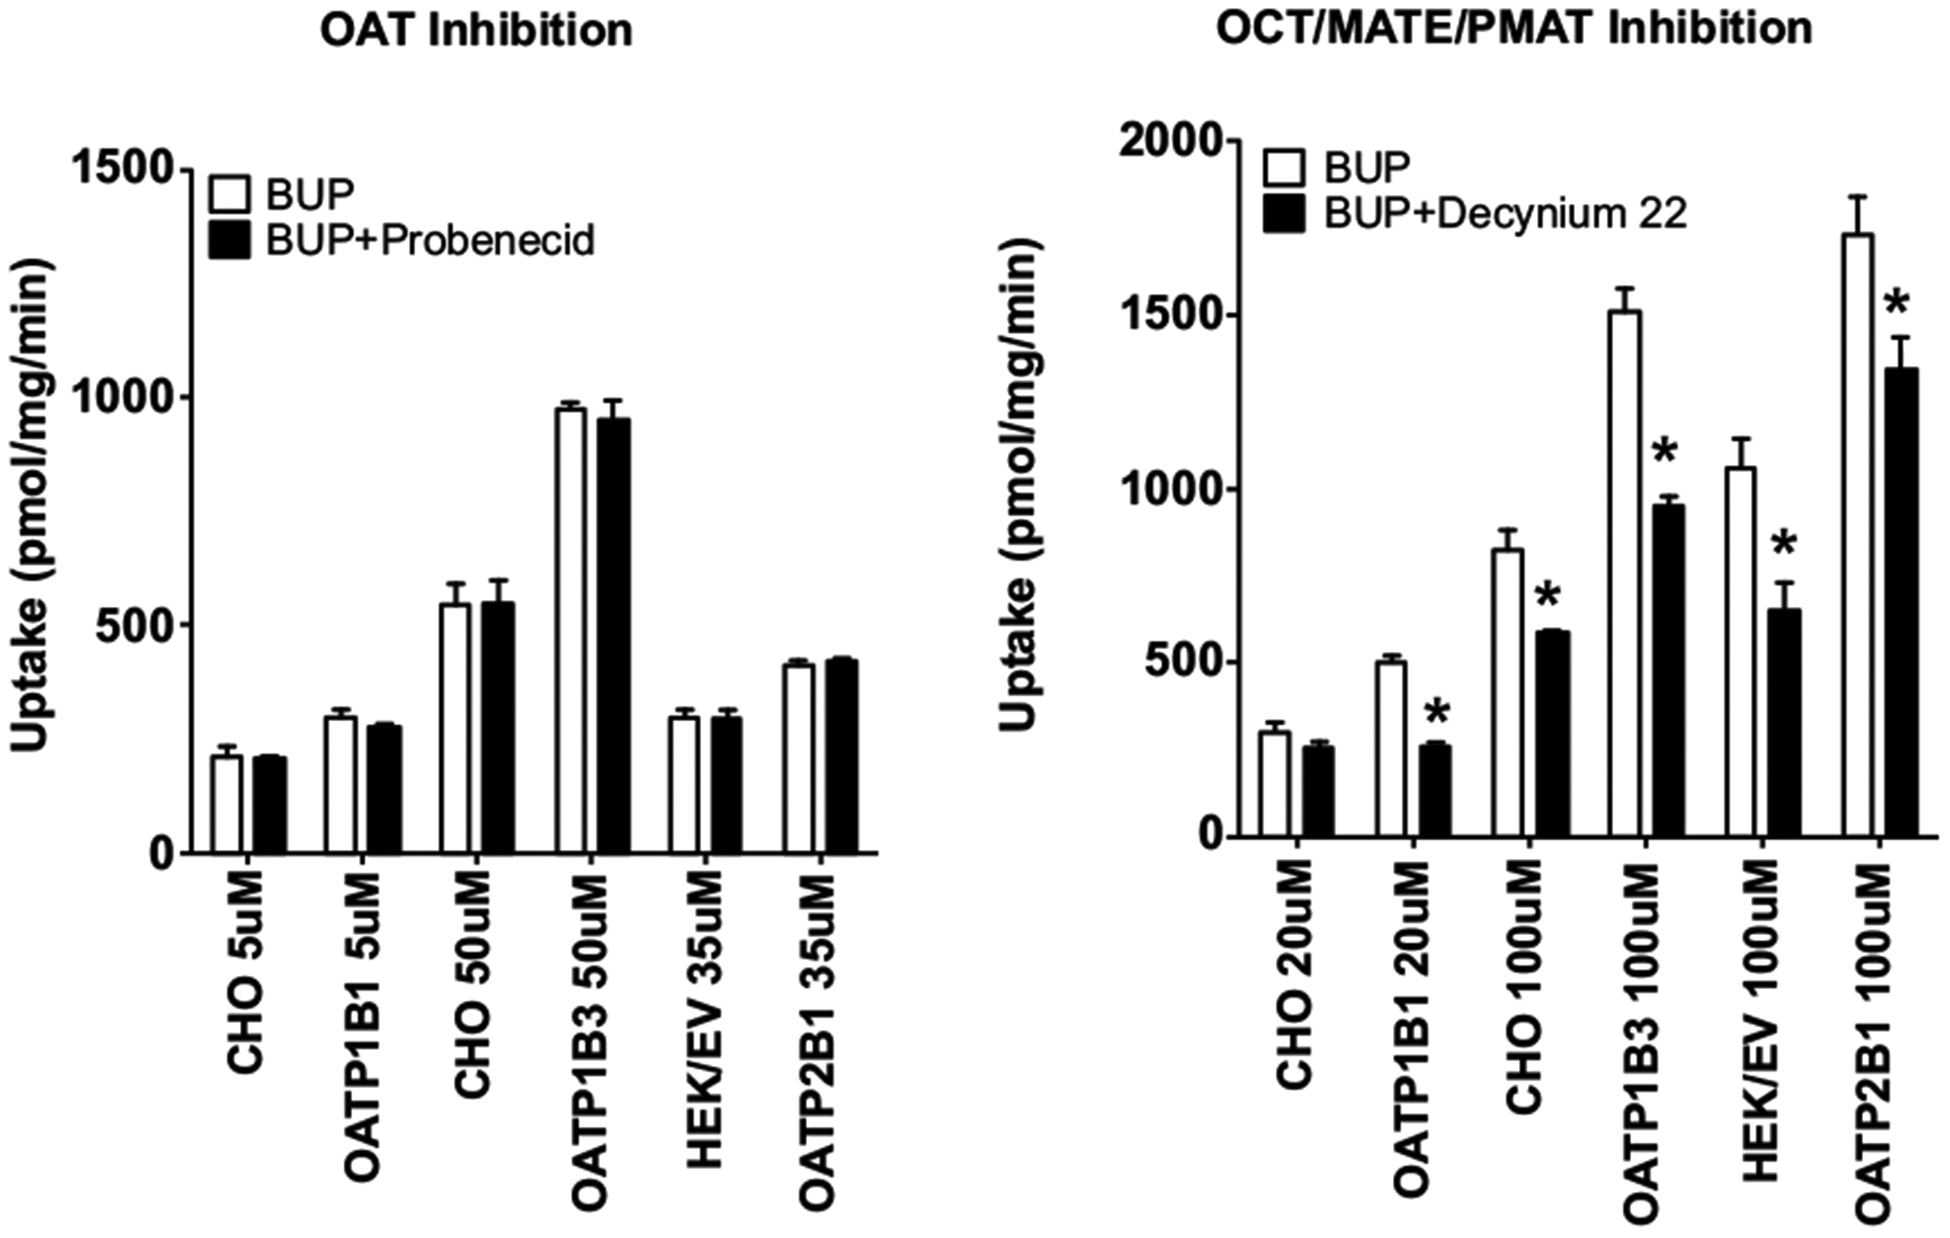
No inhibition of cellular uptake of BUP by probenecid and inhibition by decynium-22. Cells were pre-incubated with or without an inhibitor (50 μM probenecid or 100 μM decynium-22) for 10 min, and then BUP was added to a final concentration (shown in the figure) lower than their respective apparent Km. Incubation was continued for 3 min. Afterward, transport was terminated and intracellular concentrations of BUP were determined using LC-MS/MS. Open bars and filled bars indicate uptake of BUP in the absence and presence of an inhibitor, respectively. Data shown are means ± SD of three independent experiments. Differences in uptake of BUP between with and without D-22 were statistically significant with *p < 0.05 by one-way ANOVA analysis. Cells overexpressing OATP1B1, OATP1B3 and OATP2B1 as well as their corresponding parent (CHO) or empty vector (HEK/EV) control cells were used.
3.3. Cellular Uptake of BUP by OCT1
To further test if the observed BUP uptake into the CHO and HEK cells is mediated by OCT1, an important hepatic transporter, we performed cellular uptake studies for BUP using the OCT1-overexpressing HEK cells and the empty vector control cells. We first verified that cellular uptake of the OCT1 model substrate [3H]-MPP+ into the OCT1-overexpressing cells was 15 times higher than that into the vector control cells (Fig. S2), confirming that OCT1 overexpressed in the cells was fully functional. No significant differences in the cellular uptake of BUP at 0.1, 1 and 10 μM between the OCT1-overexpressing cells and the vector control cells were observed (Fig. 8), suggesting that BUP is not a substrate of OCT1 at pharmacologically relevant concentrations.
Fig. (8).
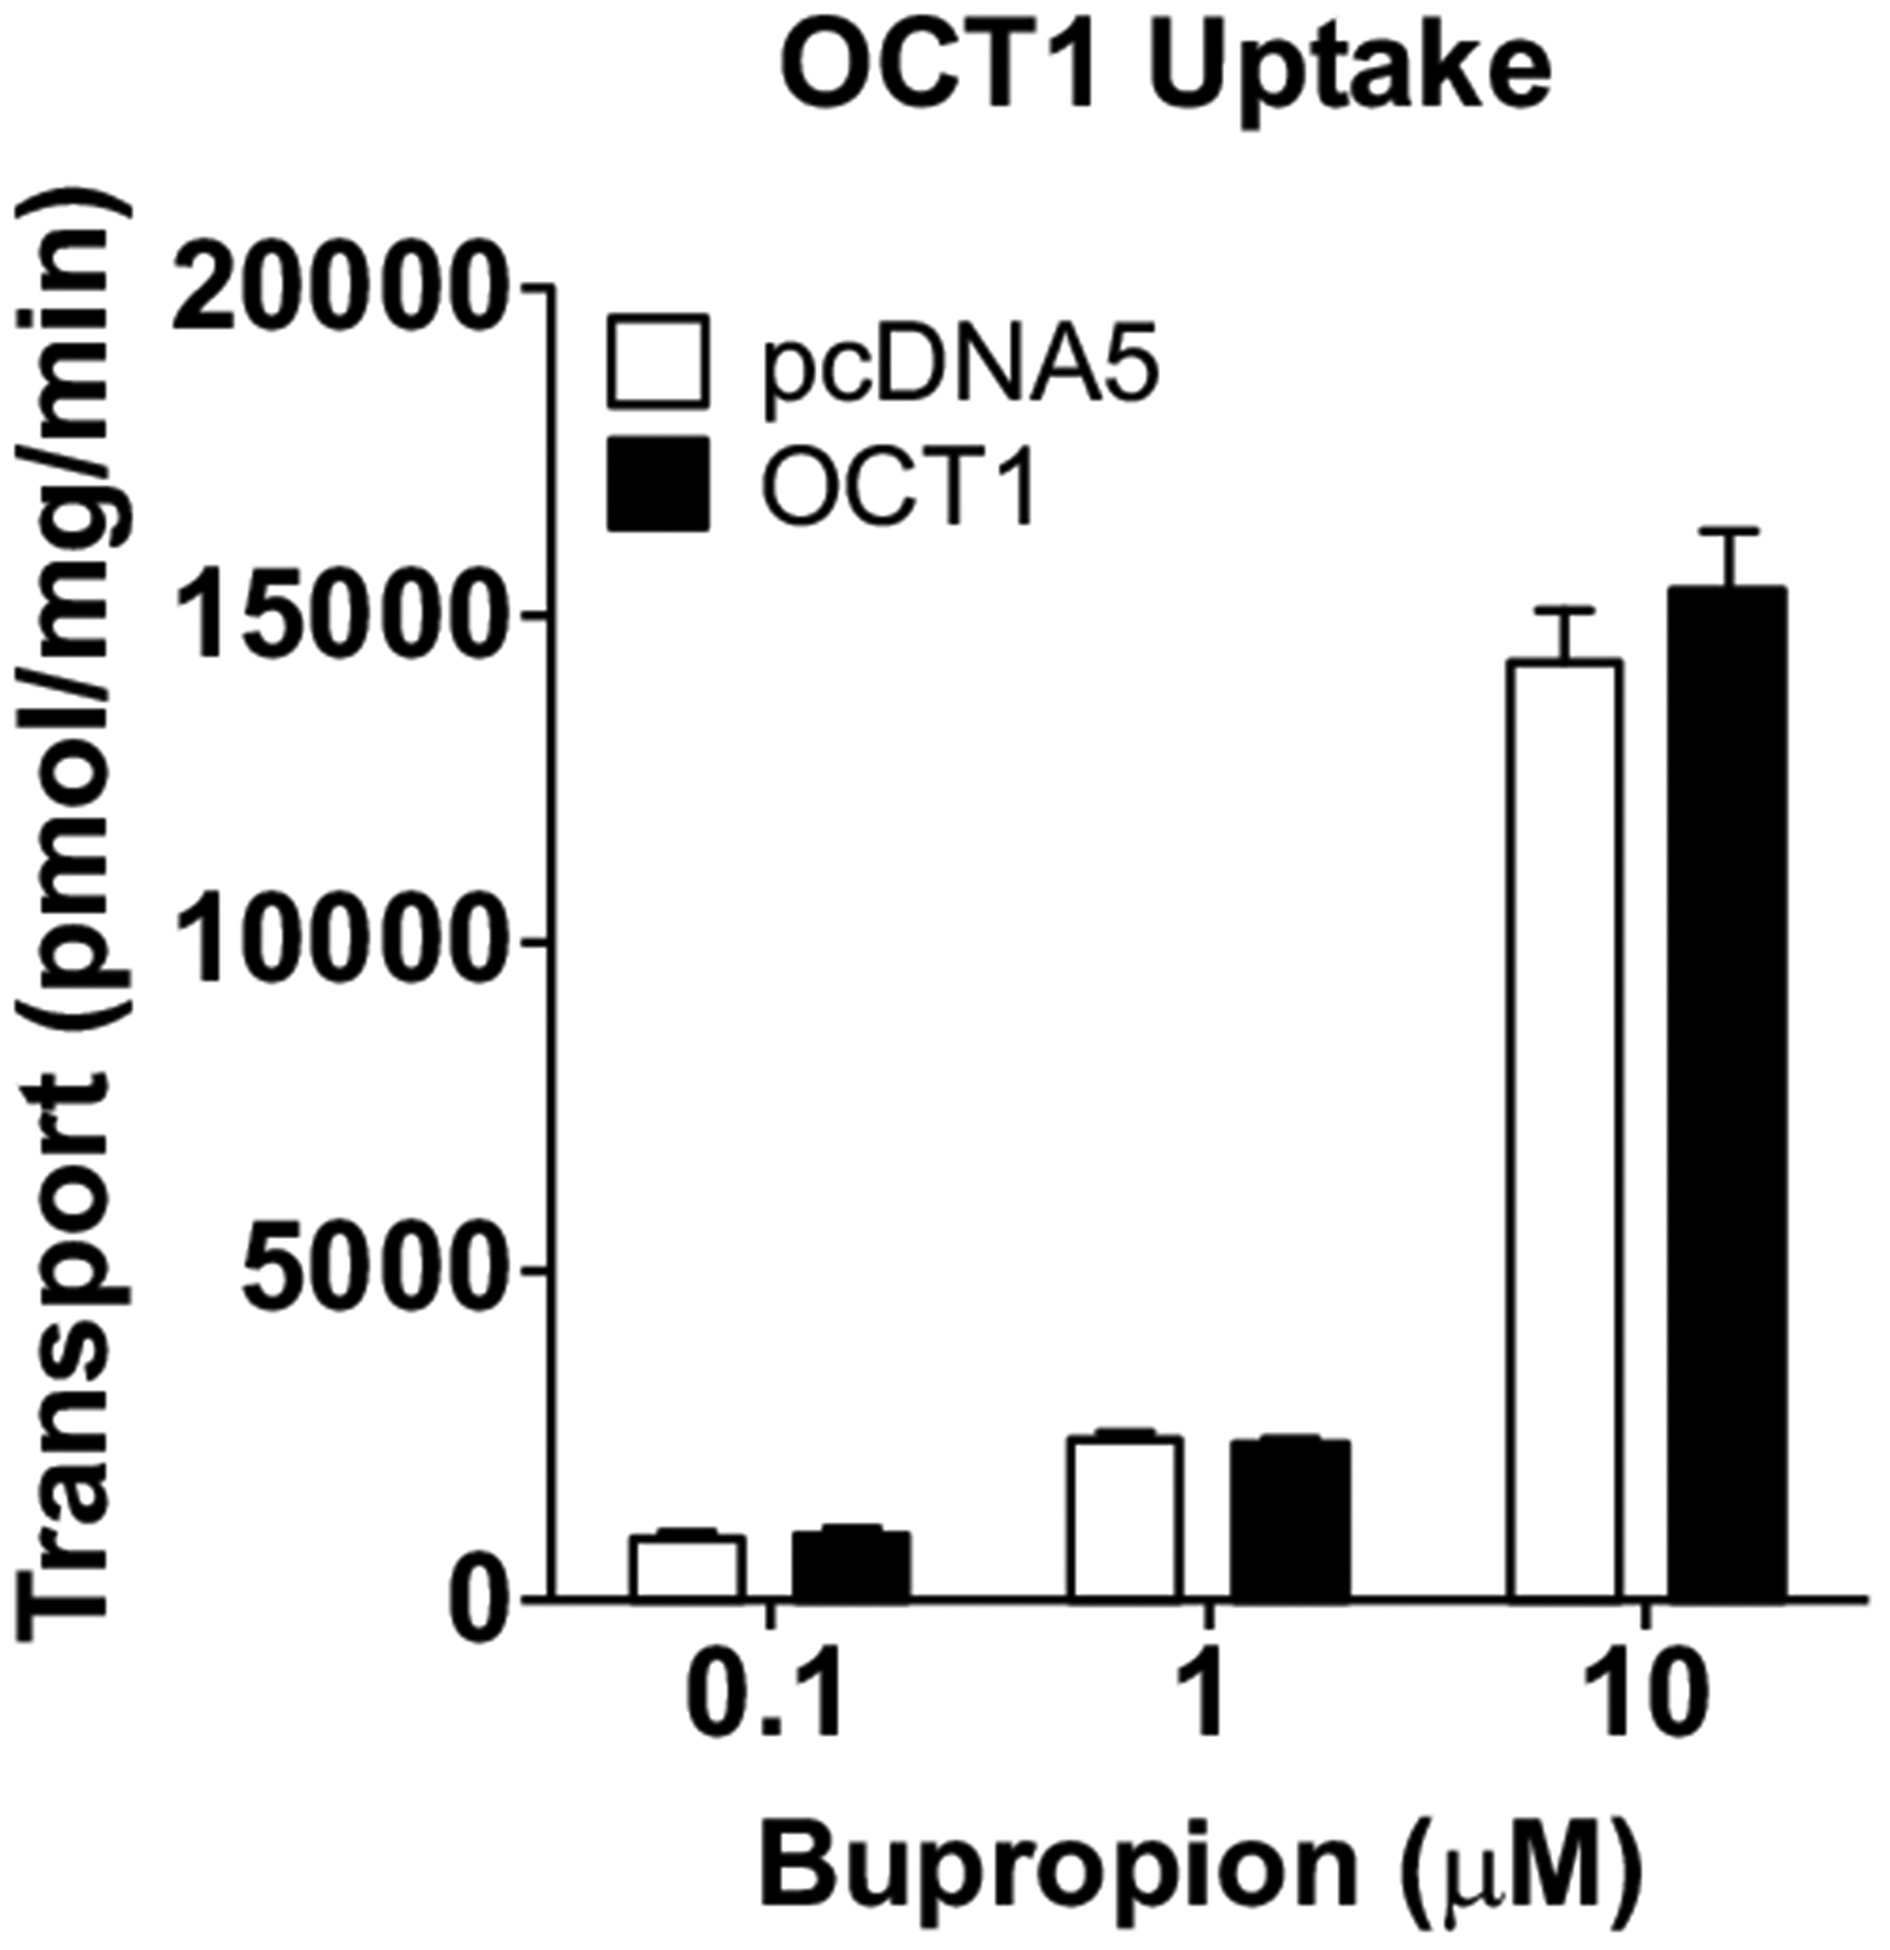
Cellular uptake of bupropion and metabolites by OCT1. Cells were incubated in culture media with 0.1, 1 and 10 μM BUP for 3 min. Uptake was terminated by adding ice-cold buffer and intracellular concentrations were determined using LC-MS/MS. Data shown are means ± SD of three independent experiments. Open bars indicate uptake by the empty vector control HEK cells, and filled bars indicate uptake by the OCT1-overexpressing HEK cells. No statically significant differences in uptake of BUP between the OCT1-overexpressing cells and the empty vector control cells were observed.
3.4. Efflux Transport of BUP and Metabolites by BCRP, MRP2, and P-gp
Finally, we tested if BUP and metabolites are substrates of the major hepatic efflux transporters BCRP, MRP2 and P-gp using membrane vesicle transport assays. We first verified the function of these transporters in the vesicular transport membranes using model substrates. E2-17β-G at 5 μM was used as a model substrate for BCRP and MRP2. NMQ at 1 μM was used as a model substrate for P-gp. Uptake of the model substrates into the BCRP, MRP2 or P-gp vesicles in the presence of ATP was 10–100 times greater than that in the presence of AMP (Fig. S5), confirming that these transporters in the membrane vesicles were fully functional. We then examined ATP-dependent uptake of BUP and its metabolites at 10 μM by the three transporters, but did not observe significant differences in the vesicle uptake of any of these compounds between the presence of ATP and AMP (Fig. 9). Therefore, BUP and its metabolites are unlikely substrates of BCRP, MRP2 and P-gp.
Fig. (9).
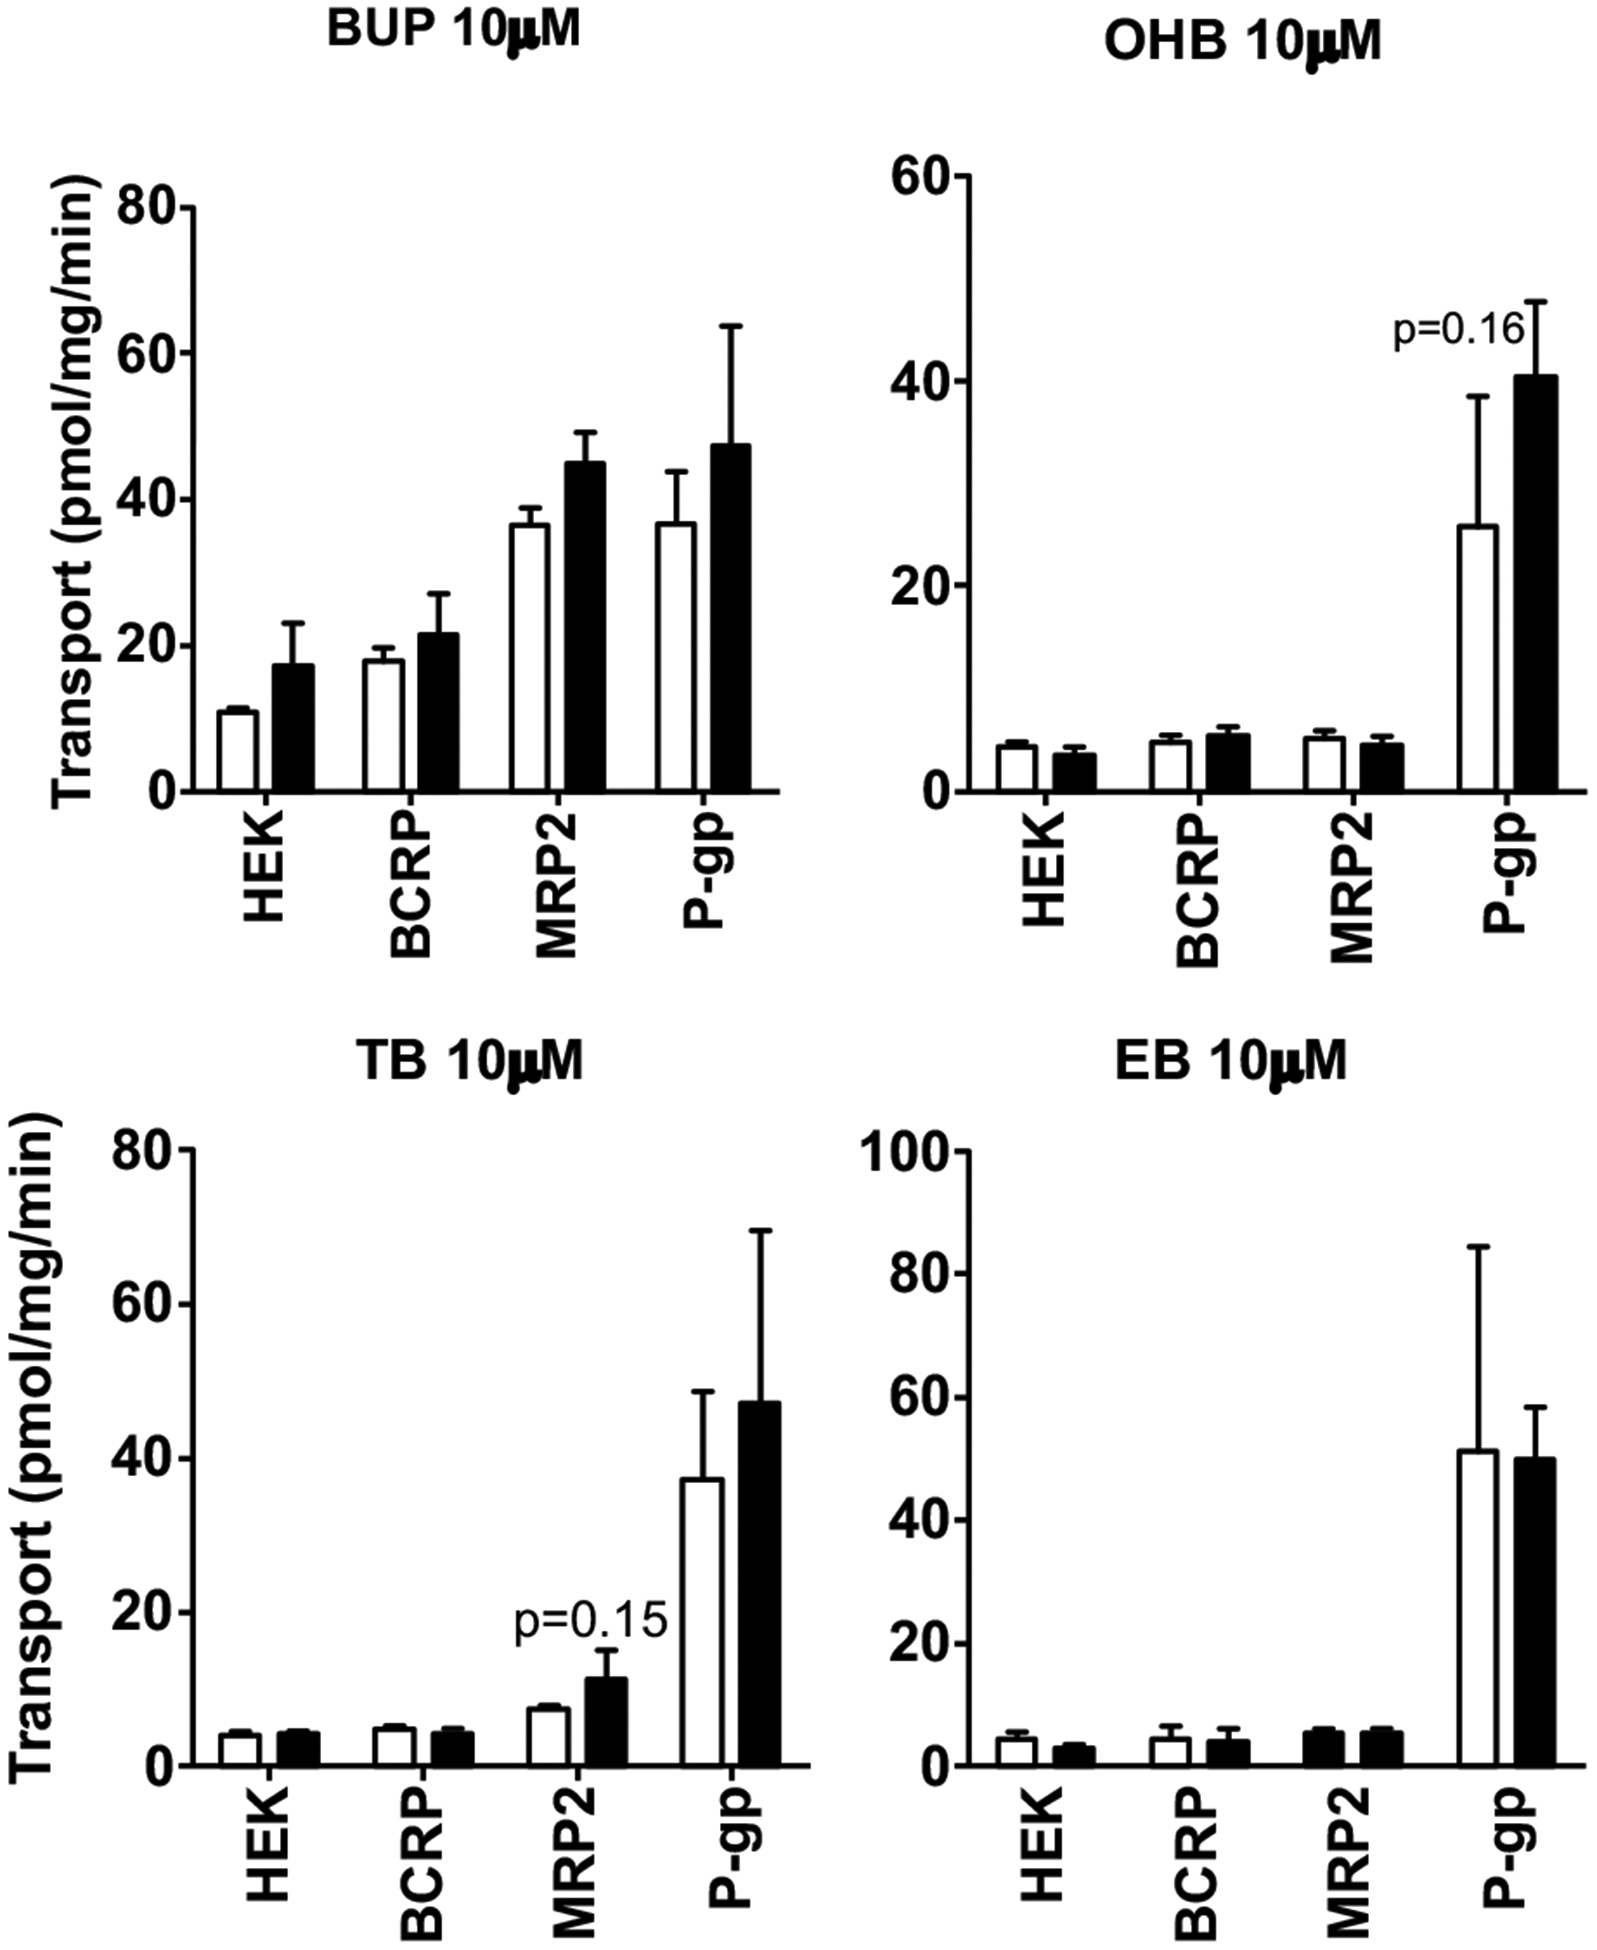
ATP-dependent uptake of BUP and its metabolites into plasma membrane vesicles overexpressing BCRP, MRP2 or P-gp. Membrane vesicles were pre-incubated for 15 min in the presence of ATP or AMP prior to the addition of BUP, OHB, TB or EB to 10 μM, and incubation was continued for 1 min. Transport reactions were then terminated and the assay mixtures were transferred to glass fiber filter plates and rapidly washed over vacuum manifold. BUP, OHB, TB or EB trapped in the membrane vesicles was eluted and quantified using LC-MS/MS. Data shown are means ± SD of three independent experiments. Open bars indicate the vesicle uptake of BUP, OHB, TB or EB in the presence of AMP, and filled bars indicate the vesicle uptake in the presence of ATP. No significant differences in vesicle uptake between ATP and AMP were observed.
4. DISCUSSION
As aforementioned, the mechanisms underlying the overall disposition and systemic clearance of BUP and its active metabolites have not been well understood [10, 13, 16, 17]. BUP is known to be extensively metabolized in the liver; however, little is known about whether transporters also play a role in the disposition of BUP and its metabolites.
Therefore, in this study, we investigated whether BUP, OHB, TB and EB are substrates of the major hepatic uptake and efflux transporters. BUP is mainly administered orally; metabolism in the liver is considered a major elimination pathway, and renal clearance seems to play a minor role [5, 12, 13, 15, 48]. The overall disposition of BUP in the body could be highly dependent on the efficiency of hepatic uptake of BUP from the portal blood and systemic circulation before being metabolized in the liver. Our in vitro transport studies showed that, although the OATP-overexpressing cells did exhibit a significantly greater and saturable cellular uptake of BUP and metabolites compared to the parent or empty vector control cells (Figs. 1–3), this uptake could not be inhibited by two potent OATP inhibitors rifampin and CsA (Figs. 5 and 6), suggesting that BUP and metabolites are not substrates of the major hepatic uptake transporters in the sinusoidal membrane, OATP1B1, OATP1B3 and OATP2B1. This raised an important question as to which transporters are responsible for cellular uptake of BUP into the OATP-overexpressing CHO and HEK cells. OAT2 and OCT1 are known to be expressed in the sinusoidal membrane of the liver hepatocyte, mediating uptake of xenobiotics and endogenous compounds into the liver [19]. Our further studies found that the cellular uptake of BUP was not affected by the OAT inhibitor probenecid, but significantly inhibited by the OCT inhibitor D-22 in both the OATP-overexpressing and the control CHO or HEK cells (Fig. 7), indicating that BUP is unlikely a substrate of OAT2. Direct uptake transport studies using OCT1-overexpressing cells demonstrated that BUP is not a substrate of OCT1 either (Fig. 8). Taken together, based upon the results of the current study, we conclude that BUP is not a substrate of the major hepatic uptake transporters (OATP1B1, OATP1B1, OATP2B1, OCT1 and OAT2) in the sinusoidal membrane and thus these uptake transporters are not expected to play a role in the hepatic disposition of BUP. It is worth noting that D-22 is a general potent inhibitor of OCT/PMAT/MATE transporters. Endogenous expression of OCT/PMAT/MATE transporters in HEK cells would be expected considering HEK cells are originated from the human embryonic kidney. Indeed, previous studies have shown low mRNA and protein levels of endogenous OCT expression in wild-type HEK293 cell line [49–51]. However, endogenous OCT expression or activity in CHO cells was a surprise. Since PMAT, MATEs and other OCTs are not known to be highly expressed in the liver hepatocytes, we elected to not pursue PMAT, MATEs and other OCTs further. Identification of transporters that can transport BUP and its metabolites would be an interesting topic of future studies. We do not have explanations to the findings that the cellular uptake of BUP and metabolites into OATP-transfected cells is generally higher than that into the parent or empty control cells (Figs. 1–3). It appears that cells transfected with target genes (OATPs) gain some additional transport properties as compared to the parent or mock transfected cells. This is possible as it has been shown that transfection of even empty vectors can promote intensive genome-level alternations beyond the function of target genes [52].
Alternatively, the lack of inhibition observed in our study might possibly be due to the fact that OATPs are known to have multiple-binding sites [53–56]. Other researchers have also observed low inhibitory effects of rifampicin on OATP2B1 uptake of hematoporphyrin monomethyl ether, even though significant uptake activity was observed in HEK293 cell lines and hepatocytes [57]. It is possible, though less likely, that BUP and metabolites occupy different binding sites from the two potent inhibitors we used as these two inhibitors seem to be commonly used general inhibitors of OATPs [58]. In all our transport experiments, we saw very low background noise in LC-MS/MS assays and peaks were well defined and clear, without any unidentified peaks, suggesting that no other analytes were present. Therefore, the data we present in this study cannot be explained by bupropion metabolism in these cells (CHO and HEK293) either.
Our results support the notion that the major hepatic uptake transporters are possibly not essential for mediating the entry of BUP into the liver. One clinical study had shown that clopidogrel and ticlopidine significantly increased the systemic exposure (AUC) of BUP by 36–61%, but disproportionally decreased the AUC of primary metabolite OHB by 60–89% [25]. Since clopidogrel is a known effective inhibitor of OATP1B1 and has been suggested to be involved in OATP1B1-mediated DDIs [26], we hypothesized that the interaction between clopidogrel and BUP could possibly be due to inhibition of OATP1B1-mediated hepatic uptake of BUP by clopidogrel. However, the results of the current study do not support this hypothesis. The increase in the systemic exposure of BUP by co-administration of clopidogrel could be most likely caused by inhibition of drug-metabolizing enzyme-mediated BUP metabolism by clopidogrel. At the time of the clinical study, it was not known that BUP could also be metabolized by 11β-HSD1, a cytosolic enzyme extensively expressed in the liver, but not intestine or kidney [59]. Thus, in the presence of perpetrator drugs clopidogrel and ticlopidine, although the formation of OHB was heavily suppressed, BUP AUC did not increase proportionally because it was metabolized by 11β-HSD1. In order for this metabolism to occur, BUP must readily enter the hepatocytes by passive diffusion and/or other unknown uptake transporters to access the enzyme responsible. Furthermore, no significant difference was observed in the halflife of BUP. Taken together, the clinical study further suggested that the major hepatic OATP uptake transporters did not seem to play a significant role in this DDI.
We also explored the potential of interactions of the major hepatic efflux transporters with BUP and its metabolites, and did not observe any active transport activity of BCRP, MRP2 or P-gp for these compounds (Fig. 9). Therefore, BCRP, MRP2 and P-gp are not expected to play a role in biliary elimination of BUP and its metabolites. Consistent with our observation, He et al. also reported that BUP had no inhibitory effect on the transport of digoxin, a P-gp substrate, in LLC-PK1 cells overexpressing human P-gp [60]. However, our finding conflicts with another study showing that BUP is a substrate of BCRP and P-gp with Km of 3 μM and 0.5 μM, respectively [61]. One possible explanation is that the previous study used membrane vesicles isolated from human placenta which did not overexpress the transporters of interest, thus the vesicle uptake of BUP could be mediated by other endogenous transporters in the placental membrane vesicles.
BUP can be used by pregnant women. Previous studies have reported significant fetal exposure to BUP and its metabolites in pregnant women [17, 62, 63], suggesting that BUP and its metabolites are able to cross the placental barrier and this is a safety concern for the developing fetus. In this study, we showed that BUP and its metabolites were not transported by OATP4A1 (Fig. 4), an uptake transporter expressed in the apical membrane of placental syncytiotrophoblasts. Furthermore, P-gp and BCRP are known to be highly expressed in the apical membrane of placental syncytiotrophoblasts, limiting fetal exposure to drugs and xenobiotics. Results of this study suggest that P-gp, BCRP and OATP4A1 do not play a role in determining fetal exposure to BUP and its metabolites. Further studies are needed to investigate whether fetal exposure to these compounds is mediated by other placental transporters or passive diffusion.
Taken together, the significant active cellular uptake of BUP and its metabolites into CHO and HEK293 cells overexpressing major hepatic OATP transporters and lack of inhibition by prototypical inhibitors of any of these OATP transporters suggest that there are endogenous uptake transporters in these model cell lines that have not been identified. Therefore, caution should be taken when using these model cell lines to evaluate uptake transport activity of drugs and xenobiotics. While our study does not support major hepatic transporters to be important in the overall disposition of BUP and its metabolites, the active uptake in our study suggests that they are substrates of unknown transporters. More studies are needed to identify these transporters and potential drug-drug interactions.
Lastly, we recognize that BUP and its metabolites are racemic mixtures and previous metabolic studies have shown a stereoselectivity in in vivo disposition and in vitro metabolism [64]. Future studies are needed to verify if there is a stereoselectivity in the transport of BUP and its metabolites [65].
CONCLUSION
In summary, this study showed that BUP and its active metabolites (OHB, TB and EB) are not substrates of the major hepatic transporters (OATP1B1, OATP1B3, OATP2B1, OCT1, MRP2, P-gp and BCRP) and the placental transporter OATP4A1. A flow chart of the experiment process that led to our conclusions is illustrated in Fig. (S6). These findings suggest that the major hepatic drug transporters play a minor role in the overall disposition, systemic clearance, and local tissue exposure of BUP and its metabolites. Several significant DDIs involving BUP have been reported with mechanisms not fully understood. The results of this study will help clarify the mechanisms that mediate the DDIs involving BUP. Thus, such DDIs are likely mediated by drug-metabolizing enzymes, not the major hepatic drug transporters.
Supplementary Material
Figure S1: Time linearity for OATP uptake. Figure S2: Cellular accumulation of model substrates of CHO/OATP1B1, CHO/OATP1B3, CHO/OATP4A1, HEK/OATP2B1, and HEK/OCT1 cell lines. Figure S3: Inhibition of model substrates of CHO/OATP1B1, CHO/OATP1B3, and HEK/OATP2B1 with prototypical inhibitors. Figure S4: Assessment of non-specific binding of bupropion in CHO/WT, CHO/OATP1B1, CHO/OATP1B3, HEK/EV, and HEK/OATP2B1 cell lines. Figure S5: Validation of ATP-dependent uptake of model substrates into the control, MRP2-, BCRP-, and P-gp-overexpressing plasma membrane vesicles. Fig. S6: Flow of experiments and conclusions.
Fig. (2).
Uptake (upper panels) and net uptake (lower panels) of BUP and metabolites by CHO cells overexpressing OATP1B3. Cells were incubated in culture media with 1 – 300 μM BUP, OHB, TB or EB for 3 min. Uptake was terminated by adding ice-cold buffer and intracellular concentrations were determined using LC-MS/MS. Data shown are means ± SD of three independent experiments. Circles indicate uptake by the wild-type CHO cells, and squares indicate uptake by the OATP1B3-overexpressing CHO cells.
ACKNOWLEDGEMENTS
We would like to thank Drs. Bruno Stiegers, Bruno Hagenbuch, and Joerg Koenig for their generous gifts of cell lines. We are also deeply grateful for Dr. Danny D. Shen and Brian R. Phillips in the Department of Pharmaceutics, University of Washington, for sharing LC-MS instruments and assistance in the LC-MS/MS assay development. This research was funded in part by the National Institute on Drug Abuse [Grant DA032507], the University of Washington Drug Metabolism, Transport and Pharmacogenomics Research Program (DMTPR), and the National Center for Advancing Translational Sciences of the National Institutes of Health [Grant TL1TR000422].
Footnotes
ETHICS APPROVAL AND CONSENT TO PARTICIPATE
Not applicable.
HUMAN AND ANIMAL RIGHTS
Not applicable.
CONSENT FOR PUBLICATION
Not applicable.
CONFLICT OF INTEREST
The authors declare no conflict of interest, financial or otherwise.
SUPPLEMENTARY MATERIAL
Supplemental methods for: Plasma membrane vesicle transport assay, and LC-MS/MS quantification conditions.
REFERENCES
- [1].Slemmer JE; Martin BR; Damaj MI bupropion is a nicotinic antagonist. J. Pharmacol. Exp. Ther, 2000, 295(1), 321–327. [PubMed] [Google Scholar]
- [2].Cooper BR; Hester TJ; Maxwell RA Behavioral and biochemical effects of the antidepressant bupropion (Wellbutrin): evidence for selective blockade of dopamine uptake in vivo. J. Pharmacol. Exp. Ther, 1980, 215(1), 127–134. [PubMed] [Google Scholar]
- [3].Ferris RM; Cooper BR; Maxwell RA Studies of bupropion’s mechanism of antidepressant activity. J. Clin. Psychiatry, 1983, 44(5 Pt 2), 74–78. [PubMed] [Google Scholar]
- [4].Gadde KM; Parker CB; Maner LG; Wagner HR; Logue EJ; Drezner MK; Krishnan KRR Bupropion for weight loss: An investigation of efficacy and tolerability in overweight and obese women. Obes. Res, 2001, 9(9), 544–551. [DOI] [PubMed] [Google Scholar]
- [5].Skarydova L; Tomanova R; Havlikova L; Stambergova H; Solich P; Wsol V Deeper insight into the reducing biotransformation of bupropion in the human liver. Drug Metab. Pharmacokinet, 2014, 29(2), 177–184. [DOI] [PubMed] [Google Scholar]
- [6].Li D-J; Tseng P-T; Chen Y-W; Wu C-K; Lin P-Y Significant treatment effect of bupropion in patients with bipolar disorder but similar phase-shifting rate as other antidepressants. Medicine, 2016, 95(13), e3165. [DOI] [PMC free article] [PubMed] [Google Scholar]
- [7].Ng QX A systematic review of the use of bupropion for attentiondeficit/hyperactivity disorder in children and adolescents. J. Child Adolesc. Psychopharmacol, 2016, 27(2), 112–116. [DOI] [PubMed] [Google Scholar]
- [8].Verbeeck W; Bekkering GE; Van den Noortgate W; Kramers C Bupropion for Attention Deficit Hyperactivity Disorder (ADHD) in adults. Cochrane Database Syst. Rev, 2017, 10, CD009504. [DOI] [PMC free article] [PubMed] [Google Scholar]
- [9].Findlay JWA; Van Wyck Fleet J; Smith PG; Butz RF; Hinton ML; Blum MR; Schroeder DH Pharmacokinetics of bupropion, a novel antidepressant agent, following oral administration to healthy subjects. Eur. J. Clin. Pharmacol, 1981, 21(2), 127–135. [DOI] [PubMed] [Google Scholar]
- [10].Benowitz NL; Zhu AZX; Tyndale RF; Dempsey D; Jacob P; III. Influence of CYP2B6 genetic variants on plasma and urine concentrations of bupropion and metabolites at steady state. Pharmacogenet. Genomics, 2013, 23(3), 135–141. [DOI] [PMC free article] [PubMed] [Google Scholar]
- [11].Schroeder DH Metabolism and kinetics of bupropion. J. Clin. Psychiatry, 1983, 44(5 Pt 2), 79–81. [PubMed] [Google Scholar]
- [12].Wang X; Abdelrahman DR; Zharikova OL; Patrikeeva SL; Hankins GDV; Ahmed MS; Nanovskaya TN Bupropion metabolism by human placenta. Biochem. Pharmacol, 2010, 79(11), 1684–1690. [DOI] [PMC free article] [PubMed] [Google Scholar]
- [13].Meyer A; Vuorinen A; Zielinska AE; Strajhar P; Lavery GG; Schuster D; Odermatt A Formation of threohydrobupropion from bupropion is dependent on 11β-Hydroxysteroid dehydrogenase 1. Drug Metab. Dispos, 2013, 41(9), 1671–1678. [DOI] [PMC free article] [PubMed] [Google Scholar]
- [14].Bondarev ML; Bondareva TS; Young R; Glennon RA Behavioral and biochemical investigations of bupropion metabolites. Eur. J. Pharmacol, 2003, 474(1), 85–93. [DOI] [PubMed] [Google Scholar]
- [15].Jefferson JW; Pradko JF; Muir KT Bupropion for major depressive disorder: Pharmacokinetic and formulation considerations. Clin. Ther, 2005, 27(11), 1685–1695. [DOI] [PubMed] [Google Scholar]
- [16].Masters AR; Gufford BT; Lu JBL; Metzger IF; Jones DR; Desta Z Chiral plasma pharmacokinetics and urinary excretion of bupropion and metabolites in healthy volunteers. J. Pharmacol. Exp. Ther, 2016, 358(2), 230–238. [DOI] [PMC free article] [PubMed] [Google Scholar]
- [17].Fokina VM; West H; Oncken C; Clark SM; Ahmed MS; Hankins GD; Nanovskaya TN Bupropion therapy during pregnancy: the drug and its major metabolites in umbilical cord plasma and amniotic fluid. Am. J. Obstet. Gynecol, 2016, 215(4), 497e1–7. [DOI] [PMC free article] [PubMed] [Google Scholar]
- [18].Sager JE; Price LSL; Isoherranen N Stereoselective metabolism of bupropion to OH-Bupropion, threohydrobupropion, erythrohydrobupropion and 4’-OH-Bupropion in vitro. Drug Metab. Dispos, 2016, 44(10), 1709–1719. [DOI] [PMC free article] [PubMed] [Google Scholar]
- [19].Roth M; Obaidat A; Hagenbuch B OATPs, OATs and OCTs: The organic anion and cation transporters of the SLCO and SLC22A gene superfamilies. Br. J. Pharmacol, 2012, 165(5), 1260–1287. [DOI] [PMC free article] [PubMed] [Google Scholar]
- [20].Wang H; Yan Z; Dong M; Zhu X; Wang H; Wang Z Alteration in placental expression of bile acids transporters OATP1A2, OATP1B1, OATP1B3 in intrahepatic cholestasis of pregnancy. Arch. Gynecol. Obstet, 2012, 285(6), 1535–1540. [DOI] [PubMed] [Google Scholar]
- [21].Kullak-Ublick GA; Ismair MG; Stieger B; Landmann L; Huber R; Pizzagalli F; Fattinger K; Meier PJ; Hagenbuch B Organic anion-transporting polypeptide B (OATP-B) and its functional comparison with three other OATPs of human liver. Gastroenterology, 2001, 120(2), 525–533. [DOI] [PubMed] [Google Scholar]
- [22].Hagenbuch B; Gui C Xenobiotic transporters of the human organic anion transporting polypeptides (OATP) family. Xenobiotica, 2008, 38(7–8), 778–801. [DOI] [PubMed] [Google Scholar]
- [23].Ronaldson P; Bauer B; El-Kattan A; Shen H; Salphati L; Louie S Highlights from the american association of pharmaceutical scientists/ international transporter consortium joint workshop on drug transporters in absorption, distribution, metabolism, and excretion: From the bench to the bedside - Clinical pharmacology C., Clin. Pharmacol. Ther, 2016, 100(5), 419–422. [DOI] [PMC free article] [PubMed] [Google Scholar]
- [24].Mao Q; Ganapathy V; Unadkat JD Drug Transport in the Placenta In Drug Transporters; John Wiley & Sons, Inc.: Hoboken NJ, 2014; pp. 341–353. [Google Scholar]
- [25].Turpeinen M; Tolonen A; Uusitalo J; Jalonen J; Pelkonen O; Laine K Effect of clopidogrel and ticlopidine on cytochrome P450 2B6 activity as measured by bupropion hydroxylation. Clin. Pharmacol. Ther, 2005, 77(6), 553–559. [DOI] [PubMed] [Google Scholar]
- [26].Tamraz B; Fukushima H; Wolfe AR; Kaspera R; Totah RA; Floyd JS; Ma B; Chu C; Marciante KD; Heckbert SR OATP1B1-Related drug-drug and drug-gene interactions as potential risk factors for cerivastatin-induced rhabdomyolysis. Pharmacogenet. Genomics, 2013, 23(7), 355–364. [DOI] [PMC free article] [PubMed] [Google Scholar]
- [27].Telles-Correia D; Barbosa A; Cortez-Pinto H; Campos C; Rocha NBF; Machado S Psychotropic drugs and liver disease: a critical review of pharmacokinetics and liver toxicity. World J. Gastrointest. Pharmacol. Ther, 2017, 8(1), 26–38. [DOI] [PMC free article] [PubMed] [Google Scholar]
- [28].Luethi D; Liechti ME; Krähenbühl S Mechanisms of hepatocellular toxicity associated with new psychoactive synthetic cathinones. Toxicology, 2017, 387, 57–66. [DOI] [PubMed] [Google Scholar]
- [29].Köck K; Brouwer KLR A perspective on efflux transport proteins in the liver. Clin. Pharmacol. Ther, 2012, 92(5), 599–612. [DOI] [PMC free article] [PubMed] [Google Scholar]
- [30].Choi YH; Yu A-M ABC transporters in multidrug resistance and pharmacokinetics, and strategies for drug development. Curr. Pharm. Des, 2014, 20(5), 793–807. [DOI] [PMC free article] [PubMed] [Google Scholar]
- [31].Joshi AA; Vaidya SS; St-Pierre MV; Mikheev AM; Desino KE; Nyandege AN; Audus KL; Unadkat JD; Gerk PM Placental ABC transporters: Biological impact and pharmaceutical significance. Pharm. Res, 2016, 33(12), 2847–2878. [DOI] [PMC free article] [PubMed] [Google Scholar]
- [32].Mason CW; Buhimschi IA; Buhimschi CS; Dong Y; Weiner CP; Swaan PW ATP-binding cassette transporter expression in human placenta as a function of pregnancy condition. Drug Metab. Dispos, 2011, 39(6), 1000–1007. [DOI] [PMC free article] [PubMed] [Google Scholar]
- [33].Ni Z; Mao Q ATP-binding cassette efflux transporters in human placenta. Curr. Pharm. Biotechnol, 2011, 12(4), 674–685. [DOI] [PMC free article] [PubMed] [Google Scholar]
- [34].Mao Q BCRP/ABCG2 in the placenta: Expression, function and regulation. Pharm. Res, 2008, 25(6), 1244–1255. [DOI] [PMC free article] [PubMed] [Google Scholar]
- [35].Begley DJ ABC transporters and the blood-brain barrier. Curr. Pharm. Des, 2004, 10(12), 1295–1312. [DOI] [PubMed] [Google Scholar]
- [36].Miller D Regulation of ABC transporters at the blood-brain barrier. Clin. Pharmacol. Ther 2015, 97(4), 395–403. [DOI] [PMC free article] [PubMed] [Google Scholar]
- [37].Mahringer A; Fricker G ABC transporters at the blood-brain barrier. Expert Opin. Drug Metab. Toxicol, 2016, 12(5), 499–508. [DOI] [PubMed] [Google Scholar]
- [38].Beckmann TF; Krämer O; Klausing S; Heinrich C; Thüte T; Büntemeyer H; Hoffrogge R; Noll T Effects of high passage cultivation on CHO cells: A global analysis. Appl. Microbiol. Biotechnol, 2012, 94(3), 659–671. [DOI] [PubMed] [Google Scholar]
- [39].Gao C; Liao MZ; Han LW; Thummel KE; Mao Q Hepatic transport of 25-Hydroxyvitamin D3 conjugates: A mechanism of 25-Hydroxyvitamin D3 delivery to the intestinal tract. Drug Metab. Dispos, 2018, 46(5), 581–591. [DOI] [PMC free article] [PubMed] [Google Scholar]
- [40].Wang X; Abdelrahman DR; Fokina VM; Hankins GDV; Ahmed MS; Nanovskaya TN Metabolism of bupropion by baboon hepatic and placental microsomes. Biochem. Pharmacol, 2011, 82(3), 295–303. [DOI] [PMC free article] [PubMed] [Google Scholar]
- [41].Lau YY; Huang Y; Frassetto L; Benet LZ Effect of OATP1B transporter inhibition on the pharmacokinetics of atorvastatin in healthy volunteers. Clin. Pharmacol. Ther 2007, 81(2), 194–204. [DOI] [PubMed] [Google Scholar]
- [42].Treiber A; Schneiter R; Hausler S; Stieger B Bosentan is a substrate of human OATP1B1 and OATP1B3: inhibition of hepatic uptake as the common mechanism of its interactions with cyclosporin A, rifampicin, and sildenafil. Drug Metab. Dispos, 2007, 35(8), 1400–1407. [DOI] [PubMed] [Google Scholar]
- [43].Annaert P; Ye ZW; Stieger B; Augustijns P Interaction of HIV protease inhibitors with OATP1B1, 1B3, and 2B1. Xenobiotica, 2010, 40(3), 163–176. [DOI] [PubMed] [Google Scholar]
- [44].Okuda M; Urakami Y; Saito H; Inui K Molecular mechanisms of organic cation transport in OCT2-expressing xenopus oocytes. Biochim. Biophys. Acta, 1999, 1417(2), 224–231. [DOI] [PubMed] [Google Scholar]
- [45].Ho ES; Lin DC; Mendel DB; Cihlar T Cytotoxicity of antiviral nucleotides adefovir and cidofovir is induced by the expression of human renal organic anion transporter 1. J. Am. Soc. Nephrol, 2000, 11(3), 383–393. [DOI] [PubMed] [Google Scholar]
- [46].Chu XY; Bleasby K; Yabut J; Cai X; Chan GH; Hafey MJ; Xu S; Bergman AJ; Braun MP; Dean DC Transport of the dipeptidyl peptidase-4 inhibitor sitagliptin by human organic anion transporter 3, organic anion transporting polypeptide 4C1, and multidrug resistance p-glycoprotein. J. Pharmacol. Exp. Ther, 2007, 321(2), 673–683. [DOI] [PubMed] [Google Scholar]
- [47].Mulato AS; Ho ES; Cihlar T Nonsteroidal anti-inflammatory drugs efficiently reduce the transport and cytotoxicity of adefovir mediated by the human renal organic anion transporter 1. J. Pharmacol. Exp. Ther, 2000, 295(1), 10–15. [PubMed] [Google Scholar]
- [48].Turpeinen M; Koivuviita N; Tolonen A; Reponen P; Lundgren S; Miettunen J; Metsärinne K; Rane A; Pelkonen O; Laine K Effect of renal impairment on the pharmacokinetics of bupropion and its metabolites. Br. J. Clin. Pharmacol, 2007, 64(2), 165–173. [DOI] [PMC free article] [PubMed] [Google Scholar]
- [49].Hayer-Zillgen M; Brüss M; Bönisch H Expression and pharmacological profile of the human organic cation transporters HOCT1, HOCT2 and HOCT3. Br. J. Pharmacol, 2002, 136(6), 829–836. [DOI] [PMC free article] [PubMed] [Google Scholar]
- [50].Ahlin G; Karlsson J; Pedersen JM; Gustavsson L; Larsson R; Matsson P; Norinder U; Bergstroöm CAS; Artursson P Structural requirements for drug inhibition of the liver specific human organic cation transport protein 1. J. Med. Chem, 2008, 51(19), 5932–5942. [DOI] [PubMed] [Google Scholar]
- [51].Ahlin G; Hilgendorf C; Karlsson J; Szigyarto CAK; Uhlén M; Artursson P Endogenous gene and protein expression of drugtransporting proteins in cell lines routinely used in drug discovery programs. Drug Metab. Dispos, 2009, 37(12), 2275–2283. [DOI] [PubMed] [Google Scholar]
- [52].Stepanenko AA; Heng HH Transient and stable vector transfection: pitfalls, off-target effects, artifacts. Mutat. Res. Mutat. Res, 2017, 773, 91–103. [DOI] [PubMed] [Google Scholar]
- [53].Karlgren M; Vildhede A; Norinder U; Wisniewski JR; Kimoto E; Lai Y; Haglund U; Artursson P Classification of inhibitors of hepatic organic anion transporting polypeptides (OATPs): Influence of protein expression on drug-drug interactions. J. Med. Chem, 2012, 55(10), 4740–4763. [DOI] [PMC free article] [PubMed] [Google Scholar]
- [54].Tamai I; Nozawa T; Koshida M; Nezu J; Sai Y; Tsuji A Functional characterization of human organic anion transporting polypeptide B (OATP-B) in comparison with liver-specific OATPC. Pharm. Res 2001, 18(9), 1262–1269. [DOI] [PubMed] [Google Scholar]
- [55].Noe J; Portmann R; Brun ME; Funk C Substrate-dependent drug-drug interactions between gemfibrozil, fluvastatin and other organic anion-transporting peptide (OATP) substrates on OATP1B1, OATP2B1, and OATP1B3. Drug Metab. Dispos, 2007, 35(8), 1308–1314. [DOI] [PubMed] [Google Scholar]
- [56].Sai Y; Kaneko Y; Ito S; Mitsuoka K; Kato Y; Tamai I; Artursson P; Tsuji A Predominant contribution of organic anion transporting polypeptide OATP-B (OATP2B1) to apical uptake of estrone-3-sulfate by human intestinal caco-2 cells. Drug Metab. Dispos, 2006, 34(8), 1423–1431. [DOI] [PubMed] [Google Scholar]
- [57].Li X; Guo Z; Wang Y; Chen X; Liu J; Zhong D Potential role of organic anion transporting polypeptide 1B1 (OATP1B1) in the selective hepatic uptake of hematoporphyrin monomethyl ether isomers. Acta Pharmacol. Sin, 2015, 36(2), 268–280. [DOI] [PMC free article] [PubMed] [Google Scholar]
- [58].Kalliokoski A; Niemi M Impact of OATP transporters on pharmacokinetics. Br. J. Pharmacol, 2009, 158(3), 693–705. [DOI] [PMC free article] [PubMed] [Google Scholar]
- [59].Yang X; Hua W; Ryu S; Yates P; Chang C; Zhang H; Di L 11 β-hydroxysteroid dehydrogenase 1 human tissue distribution, selective inhibitor, and role in doxorubicin metabolism. Drug Metab. Dispos, 2018, 46(7), 1023–1029. [DOI] [PubMed] [Google Scholar]
- [60].He J; Yu Y; Prasad B; Chen X; Unadkat JD Mechanism of an unusual, but clinically significant, digoxin-bupropion drug interaction. Biopharm. Drug Dispos, 2014, 35(5), 253–263. [DOI] [PubMed] [Google Scholar]
- [61].Hemauer SJ; Patrikeeva SL; Wang X; Abdelrahman DR; Hankins GD V; Ahmed, M.S.; Nanovskaya, T.N. Role of transporter-mediated efflux in the placental biodisposition of bupropion and its metabolite, oh-bupropion. Biochem. Pharmacol, 2010, 80(7), 1080–1086. [DOI] [PMC free article] [PubMed] [Google Scholar]
- [62].Earhart AD; Patrikeeva S; Wang X; Abdelrahman DR; Hankins GDV; Ahmed MS; Nanovskaya T Transplacental transfer and metabolism of bupropion. J. Matern. Fetal. Neonatal Med, 2010, 23(5), 409–416. [DOI] [PMC free article] [PubMed] [Google Scholar]
- [63].Nishikawa M; Iwano H; Yanagisawa R; Koike N; Inoue H; Yokota H Placental transfer of conjugated bisphenol a and subsequent reactivation in the rat fetus. Environ. Health Perspect, 2010, 118(9), 1196–1203. [DOI] [PMC free article] [PubMed] [Google Scholar]
- [64].Sager JE; Price LSL; Isoherranen N stereoselective metabolism of bupropion to OH-bupropion, threohydrobupropion, erythrohydrobupropion, and 4’-OH-bupropion in vitro. Drug Metab. Dispos, 2016, 44(10), 1709–1719. [DOI] [PMC free article] [PubMed] [Google Scholar]
- [65].Zhou Q; Yu LS; Zeng S Stereoselectivity of chiral drug transport: a focus on enantiomer-transporter interaction. Drug Metab. Rev, 2014, 46(3), 283–290. [DOI] [PubMed] [Google Scholar]
Associated Data
This section collects any data citations, data availability statements, or supplementary materials included in this article.
Supplementary Materials
Figure S1: Time linearity for OATP uptake. Figure S2: Cellular accumulation of model substrates of CHO/OATP1B1, CHO/OATP1B3, CHO/OATP4A1, HEK/OATP2B1, and HEK/OCT1 cell lines. Figure S3: Inhibition of model substrates of CHO/OATP1B1, CHO/OATP1B3, and HEK/OATP2B1 with prototypical inhibitors. Figure S4: Assessment of non-specific binding of bupropion in CHO/WT, CHO/OATP1B1, CHO/OATP1B3, HEK/EV, and HEK/OATP2B1 cell lines. Figure S5: Validation of ATP-dependent uptake of model substrates into the control, MRP2-, BCRP-, and P-gp-overexpressing plasma membrane vesicles. Fig. S6: Flow of experiments and conclusions.