
Figure 6:
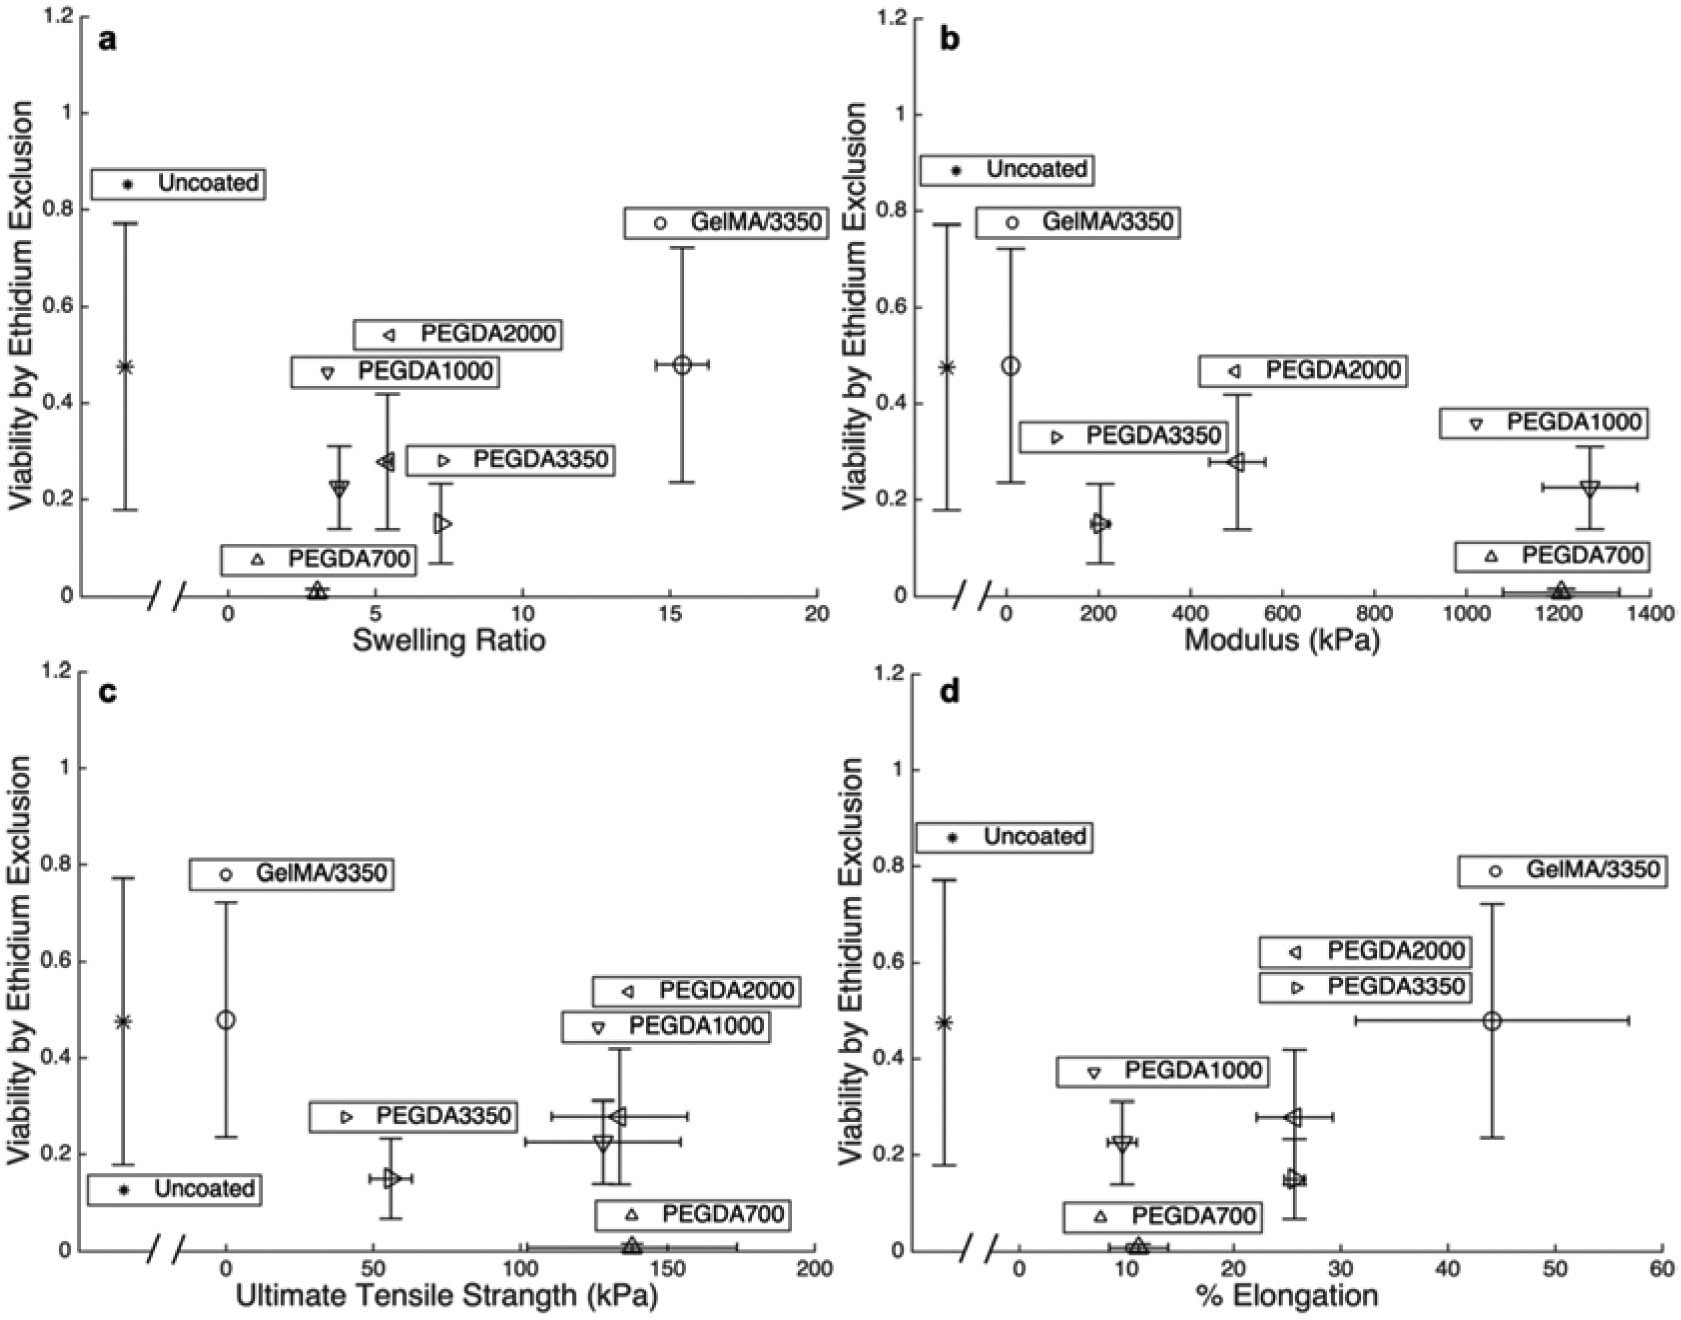
Fraction of cells with full membrane integrity determined by ethidium exclusion plotted against a) swelling ratio, b) modulus, c) UTS, and d) percent elongation at failure for each of the five macromers studied as well as uncoated cells following extrusion. Each point are mean values and error bar are standard deviations.