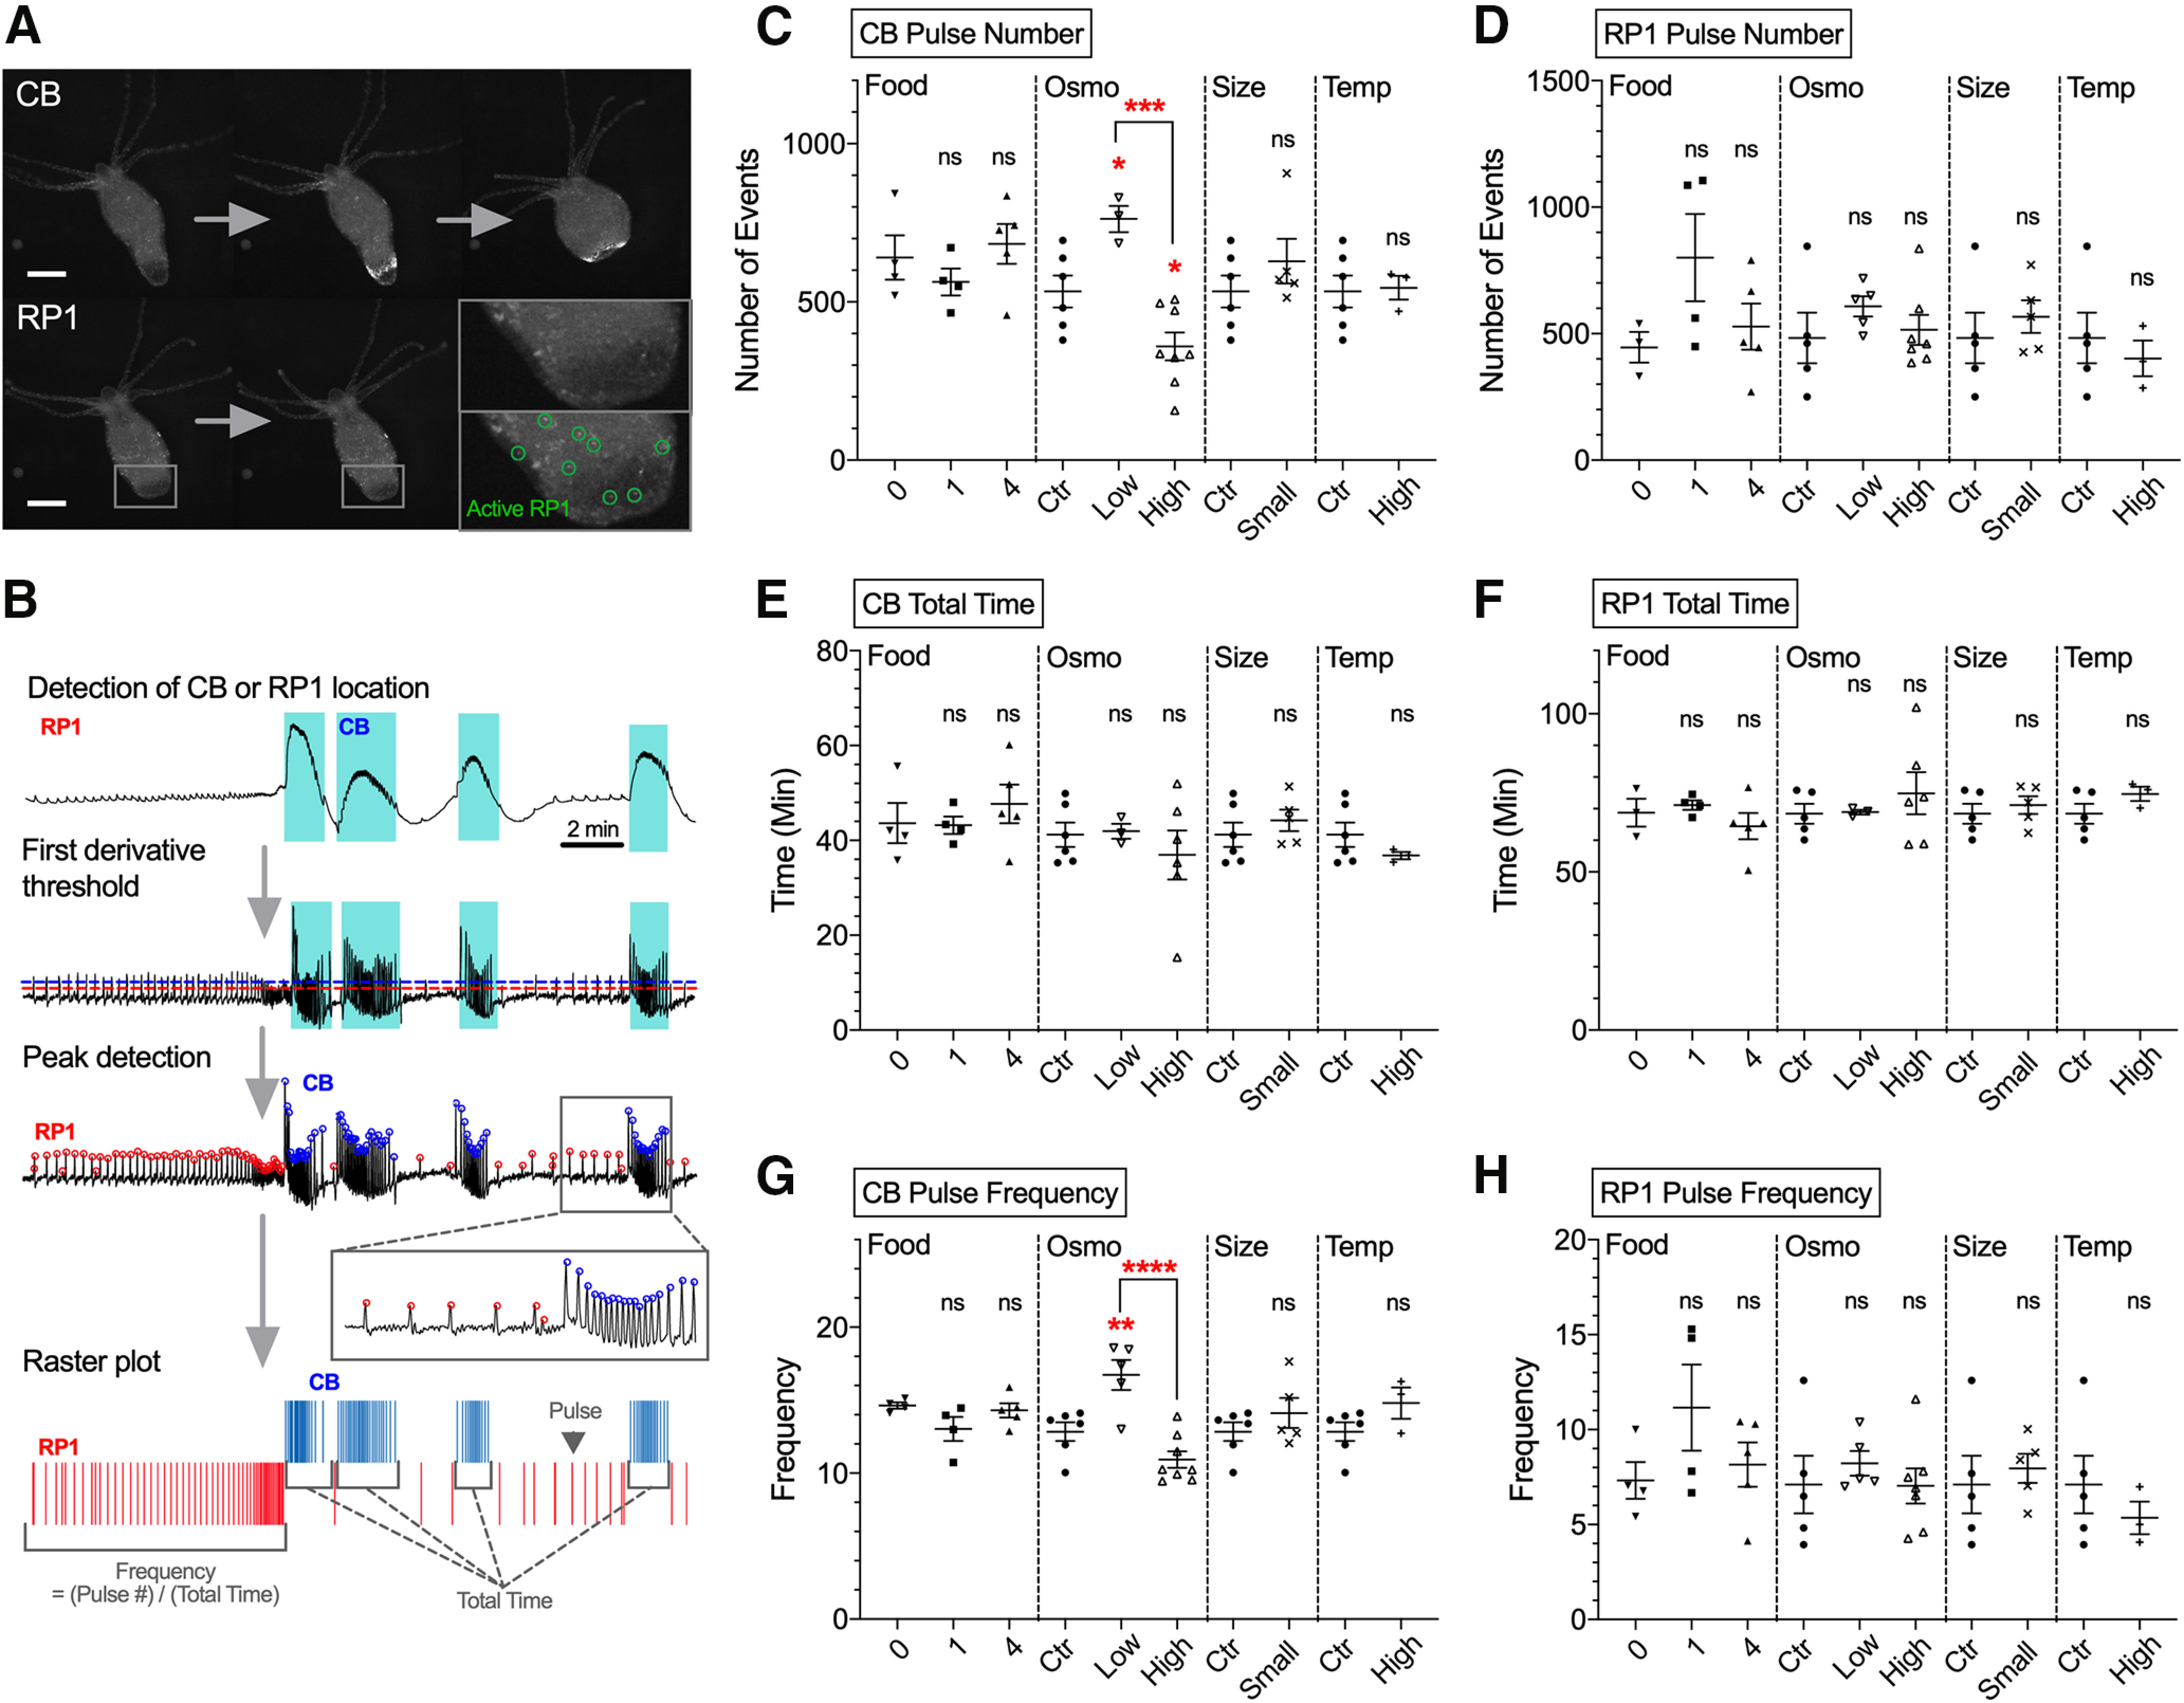
Figure 3.

Effect of experimental conditions on neuronal activity. A, upper images, Activation of CB neurons. Lower images, Activation of RP1 neurons. Scale bar, 500 μm. B, Schematic summarizing steps to detect peaks of CB and RP1 pulses from raw traces extracted from 2-h calcium imaging. C–H, Analysis of parameters: (C) CB pulse number; (D) RP1 pulse number; (E) CB total time; (F) RP1 total time; (G) CB pulse frequency; (H) RP1 pulse frequency. The four conditions used were food (Food), osmolarity (Osmo), size (Size), and temperature (Temp). Control medium (ctr). Error bars are shown as the mean ± SEM, with symbol marks denoting data points from individual Hydra (N = 3–8). Tukey’s multiple comparisons tests were performed following one-way ANOVA for osmolarity experiment, and Student’s t test was performed for others: ns ≥ 0.05; *p < 0.05, **p < 0.01, ***p < 0.001, ****p < 0.0001.
