

Abstract
Background
Determining the factors affecting the mortality and clinical conditions of the patients with Covid-19 are indispensable needs in developing patient treatment algorithms. We aimed to determine the parameters that can predict the mortality of moderate to severely ill patients with laboratory confirmed Covid-19.
Methods
Moderate to severely ill, Covid-19 patients older than 18 years were included. Mild Covid-19 patients and the ones with negative polymerase chain reaction test results were excluded from the study. The primary outcome of the study was 30-day mortality rate and we aimed to determine the factors affecting mortality in moderate to severely ill Covid-19 patients.
Results
168 patient results were analyzed. Median age of the patients was 59.5 (48.3 to 76) and 90 (53.6%) were male. According to multivariate regression analysis results, the presence of any comorbid disease (p = 0.027, HR = 26.11 (95%CI: 1.45 to 471.31)), elevated C-reactive protein levels (CRP) (p < 0.001, HR = 1.24 (95%CI: 1.11 to 1.38)) and presence of dyspnea (p = 0.026, HR = 4.26 ((95%CI: 1.19 to 15.28)) were found to significantly increase the mortality, while high pulse O 2 saturation level (p < 0.001, HR = 0.90 (95%CI: 0.82 to 0.99) was found to decrease. When receiver operating characteristic curve was created for laboratory tests, it was determined that white blood cell counts, neutrophil counts, CRP levels and neutrophil/lymphocyte ratio predicted mortality while Lymphocyte levels did not.
Conclusion
Dyspnea, the presence of any comorbid disease, elevated CRP levels, and low pulse O 2 saturation levels predict mortality in moderate to severely ill Covid-19 patients.
Keywords: 2019 novel coronavirus disease, SARS-CoV-2 infection, COVID-19 pandemic, Mortality
1. Introduction
Since December 2019, the world has been facing an unprecedented coronavirus (Covid-19) outbreak that started in China and rapidly spread internationally. Although outbreaks of the bird flu (H5N1), severe acute respiratory syndrome (SARS), swine flu (H1N1), Middle East respiratory syndrome (MERS), Ebola virus, and Zika virus have occurred in recent history, the most similar pandemic to the Covid-19 outbreak in terms of the number of people affected was the Spanish flu, which occurred about a century ago [[1], [2], [3], [4]]. The Spanish flu is thought to have been responsible for 17–50 million deaths [5]. According to the World Health Organization's (WHO) most recent report dated 17 August 2020, 21,294,845 people have been infected by Covid-19 and 761,779 have died [6].
Treatment guidelines have been constantly updated in the past few months. It is clear that better disease management and treatment algorithms for pandemics are needed, given that there is not yet an effective treatment or vaccine for this virus and the outbreak has not been fully controlled. More descriptive studies are needed to determine an effective approach for prevention and treatment of the disease. In particular, to develop patient treatment algorithms, it is crucial to determine the factors that affect the mortality and clinical conditions of patients. Thus, in this study, we aimed to determine the parameters that can predict the mortality of moderate to severely ill patients with laboratory-confirmed Covid-19.
2. Methods
2.1. Study design and setting
This prospective observational study was carried out in the emergency department (ED) of a tertiary care teaching hospital between 16 April 2020 and 16 June 2020 following approval by the local ethical committee.
2.2. Selection of participants
Patients older than 18 years who met the criteria for moderate to severe Covid-19 were consecutively included in the study. Moderate to severe Covid-19 was defined according to the COVID-19 Outbreak Management and Working Guideline created and published by the Turkish Ministry of Health. It is recommended that these patients be hospitalized, and patients who do not meet these criteria should undergo home isolation [7]. This definition included patients with symptoms of fever, muscle ache, cough, dyspnea, sore throat or nasal congestion, and at least one of the following: O2 saturation below 93% in room air; tachypnea (>22/min); poor prognostic criteria in blood tests (blood lymphocyte count <800/μl, D-Dimer >1000 ng/ml, ferritin>500 ng/ml, or C-reactive protein [CRP] >40 mg/L); bilateral diffuse parenchymal infiltration on chest x-ray or computed tomography; age of >50 years; and presence of comorbid diseases (diabetes mellitus, hypertension, malignancy, chronic lung disease, immunodeficiency disorders). Finally, at least one Covid-19 polymerase chain reaction test result was required to be positive. Patients with all negative results were excluded from the study.
2.3. Measurements
The baseline characteristics of the included patients—age, gender, complaint at the time of admission, comorbid diseases, angiotensin-converting enzyme inhibitors (ACEI), angiotensin II receptor blockers (ARBs), prophylactic hydroxychloroquine use, smoking, clinical features (such as vital signs), laboratory test results (white blood cell count, neutrophil count, lymphocyte count, CRP level, paO2 level), and fiO2 level—were recorded on a form created by a research assistant. The patients were followed up to determine the treatment they received, the duration of treatment, and the outcome.
2.4. Outcome measures
In this study, we aimed to determine the factors that affect mortality in moderate to severe Covid-19 patients. The primary outcome was 30-day mortality rate. The secondary outcome was determination of the factors that affect the development of acute respiratory distress syndrome (ARDS).
2.5. Statistical analysis
SPSS 26 (IBM Corp. Released 2019. IBM SPSS Statistics for Windows, Version 26.0. Armonk, NY: IBM Corp.) was used for statistical analyses. The Shapiro–Wilk test was used to determine the distribution of normality for the continuous variables. Normally distributed variables were expressed as the mean and standard deviation, while non-normally distributed variables were expressed with the median and 25th and 75th percentiles. Categorical data were represented by frequency and percentage. Comparison between the groups were performed by a Student's t-test or Mann–Whitney U test according to the normal distribution of the continuous variables. Comparison of the categorical data was performed with a Chi-square test and Fisher's exact test when necessary.
A receiver operating characteristic (ROC) curve was drawn for the laboratory values that were statistically associated with mortality, and the value with the highest sum of sensitivity and specificity was accepted as the cut-off value. Positive and negative likelihood ratios were determined according to this cut-off value. To determine the predictive value of several variables for both mortality and ARDS development, a multivariate regression model was created using variables whose p values were <0.2 in univariate analyses. After performing Spearman's test, the neutrophil count was excluded from the model because it was highly correlated with white blood cell count. When the patients were grouped into smokers and non-smokers, both groups were found to be similar in terms of demographic and clinical characteristics (supplemental file 1).
A two-tailed p value of <0.05 was considered statistically significant.
3. Results
In total, 557 possible Covid-19 patients who agreed to participate were included in the study, and the data of 168 patients who remained after applying the exclusion criteria were subjected to statistical analysis (Fig. 1 ). The median age of the patients was 59.5 (48.3 to 76), and 90 (53.6%) were male. The baseline characteristics and clinical features of the patients are presented in Table 1 .
Fig. 1.
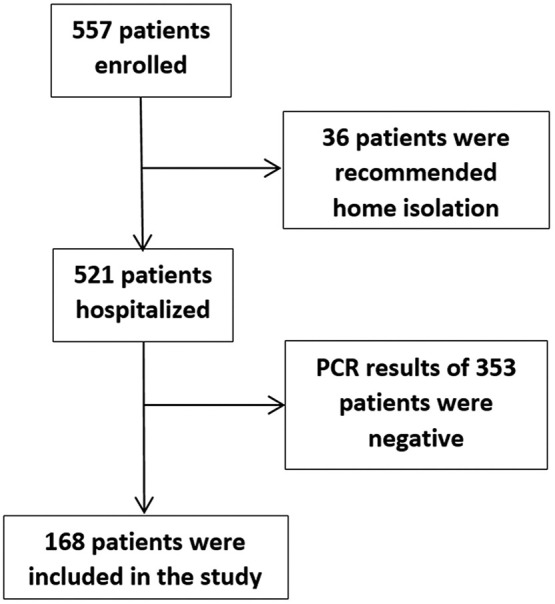
Patient flow chart.
Table 1.
Demographical and clinical characteristics of patients
| Variable | N (%)/Median (25th-75th percentiles) |
|---|---|
| Age, years | 59.5 (48.3–76) |
| Sex (male) | 90 (53.6) |
| Symptoms | |
| Temperature ≥38 °C | 34 (20.2) |
| Temperature <38 °C but fever expressed by patient | 73 (43.5) |
| Cough | 90 (53.6) |
| Dyspnea | 78 (46.4) |
| Myalgia | 48 (28.6) |
| Loss of smell | 13 (7.7) |
| Loss of taste | 16 (9.5) |
| Gastroenteritis | 26 (15.5) |
| Headache | 12 (7.1) |
| Hemoptysis | 1 (0.6) |
| Nasal congestion | 2 (1.2) |
| Conjunctivitis | 2 (1.2) |
| Throat ache | 10 (6.0) |
| Fatigue | 58 (34.5) |
| Asymptomatic | 10 (6.0) |
| Presence of any comorbid disease | 119 (70.8) |
| Hypertension | 81 (48.2) |
| Diabetes mellitus | 43 (25.6) |
| Coronary artery disease | 23 (13.7) |
| Congestive heart failure | 19 (11.3) |
| Chronic obstructive pulmonary disease | 17 (10.1) |
| Asthma | 14 (8.3) |
| Active malignancy | 11 (6.5) |
| Immunosuppressive treatment | 6 (3.6) |
| Chronic renal failure | 12 (7.1) |
| Cerebrovascular disease | 13 (7.7) |
| Demans | 18 (10.7) |
| Others | 20 (11.9) |
| No comorbid diseases | 49 (119) |
| Use of ACEa inhibitors or ARBsa | 46 (27.4) |
| Prophylactic hydroxychloroquine | 14 (8.3) |
| Cigarette | |
| Never smoker | 108 (64.3) |
| Quited smoking (more than 1 year) | 42 (25) |
| Current smoking | 18 (10.7) |
| Vital signs | |
| Heart rate, beats per minute | 87 (79–98) |
| Systolic blood pressure, mmHg | 125 (110–140) |
| Diastolic blood pressure, mmHg | 70 (65–79.8) |
| Respiratory rate, breaths per minute | 20 (16–22) |
| Pulse O2 saturation, % | 95 (91–97) |
| Laboratory results | |
| White blood cells, 103/μL | 6.61 (5–8.96) |
| Neutrophil, 103/μL | 4.48 (3.35–6.69) |
| Lymphocyte, 103/μL | 1.41 (0.90–1.95) |
| C-reactive protein, mg/dL | 3.35 (1–8.88) |
| paO2, mmHg (for 61 patients) | 68 (57–81.5) |
| FiO2, % | 0.21 (0.21–0.29) |
| paO2/FiO2 (for 61 patients) | 241.3 (139.8–345.2 |
| Thorax computed tomography results | |
| Normal | 7 (4.2) |
| Abnormal but covid-19 incompatible | 29 (17.3) |
| Covid-19 compatible | 132 (78.6) |
| Antiviral-antibacterial treatment given in hospital | |
| Hydroxychloroquine | 159 (94.6) |
| Oseltamivir | 103 (61.3) |
| Azithromycin | 131 (78.0) |
| Clarithromycin | 12 (7.1) |
| Amoxicillin | 1 (0.6) |
| Ampicillin | 2 (1.2) |
| Ceftriaxone | 75 (44.6) |
| Piperacillin tazobactam | 47 (28.0) |
| Meropenem | 26 (15.5) |
| Favipiravir | 66 (39.3) |
| Lopinavir–ritonavir | 8 (4.8) |
| Convalescent plasma | 9 (5.4) |
| Stem-cell | 1 (0.6) |
| Tocilizumab | 12 (7.1) |
| Other treatments | |
| Enoxaparin | 131 (78.0) |
| Ascorbic acid | 47 (28.0) |
| Oxygen support in emergency department | |
| No needed | 118 (70.2) |
| O2 with nasal cannula | 21 (12.5) |
| O2 with mask | 6 (3.6) |
| High flow nasal oxygen | 4 (2.4) |
| Non-invasive mechanical ventilation | 6 (3.6) |
| Intubation + mechanical ventilation | 13 (7.7) |
| Admission | |
| General wards | 144 (85.7) |
| Intensive care unit | 24 (14.3) |
| Acute respiratory distress syndrome | 38 (22.6) |
| In hospital mortality | 32 (19) |
ACE: angiotensin converting enzyme, ARB: Angiotensin II receptor blockers.
Patients were divided into two groups according to the mortality outcome. In the univariate analysis, the following parameters were found to be statistically associated with mortality: age, dyspnea, coronary artery disease, congestive heart failure, active malignancy, chronic kidney failure, presence of any comorbid disease, loss of taste, respiratory rate, O2 saturation, white blood cell count, neutrophil count, CRP, fiO2, and paO2/fiO2 value. According to the results of multivariate regression analysis using variables that were statistically significant in univariate analysis (age, dyspnea, presence of any comorbid disease, O2 saturation, white blood cell count, CRP level, and presence of nausea-vomiting), it was determined that the presence of any comorbid disease, elevated CRP levels, and presence of dyspnea were found to be significantly associated with increased mortality, while high O2 saturation level was associated with decreased mortality. (Table 2 ). The goodness of fit of the model was checked with the Hosmer–Lemeshow test (p = 0.730).
Table 2.
Univariate and multivariate analysis of variables for moderate-severe Covid-19 patients' mortality prediction.
| Variables | Non survivors |
Survivors |
Univariate |
Multivariate |
||
|---|---|---|---|---|---|---|
| N (%)/Median (IQR) | N (%)/Median (IQR) | HR (95% CI) | P-value | HR (95% CI) | P-value | |
| Age, years | 73 (59 to 79.5) | 62 (51.5 to 739) | – | 0.003 | 1.02 (0.98 to 1.06) | 0.466 |
| Age, ≥50 vs. <50 | 30 (93.8) | 94 (69.1) | 6.70 (1.53 to 29.35) | 0.004 | – | – |
| Sex (male) | 17 (53.1) | 73 (53.7) | 0.98 (0.45 to 2.12) | 0.955 | – | – |
| Symptoms | ||||||
| Temperature ≥ 38 °C | 7 (21.9) | 27 (19.9) | 1.13 (0.44 to 2.89) | 0.798 | – | – |
| Cough | 15 (46.9) | 75 (55.1) | 0.72 (0.33 to 1.55) | 0.399 | – | – |
| Dyspnea | 25 (78.1) | 53 (39) | 5.59 (2.26 to 13.84) | <0.001 | 4.26 (1.19 to 15.28) | 0.026 |
| Myalgia | 5 (15.6) | 43 (31.6) | 0.40 (0.14 to 1.11) | 0.072 | – | – |
| Loss of smell | 0 (0) | 13 (9.6) | 0.14 (0.01 to 2.43) | 0.132 | – | – |
| Loss of taste | 0 (0) | 16 (11.8) | N/A | 0.044 | – | – |
| Nausea and vomiting | 6 (18.8) | 10 (7.4) | 2.91 (0.97 to 8.71) | 0.086 | 0.97 (0.19 to 4.91) | 0.968 |
| Gastroenteritis | 4 (12.5) | 22 (16.2) | 0.74 (0.24 to 2.32) | 0.788 | – | – |
| Headache | 0 (0) | 12 (8.8) | 0.15 (0.001 to 2.66) | 0.126 | – | – |
| Hemoptysis | 0 (0) | 1 (0.7) | 1.39 (0.06 to 34.9) | 1 | – | – |
| Nasal congestion | 1 (3.1) | 1 (0.7) | 4.36 (0.27 to 71.56) | 0.346 | – | – |
| Conjunctivitis | 1 (3.1) | 1 (0.7) | 4.36 (0.27 to 71.56) | 0.346 | – | – |
| Throat ache | 1 (3.1) | 9 (6.6) | 0.46 (0.06 to 3.73) | 0.689 | – | – |
| Fatigue | 13 (40.6) | 45 (33.1) | 1.38 (0.63 to 3.05) | 0.420 | – | – |
| Asymptomatic | 0 (0) | 10 (7.4) | 0.19 (0.01 to 3.25) | 0.211 | – | – |
| Presence of any comorbid diseasea | 30 (93.8) | 89 (65.4) | 7.92 (1.81 to 34.60) | 0.002 | 26.11 (1.45 to 471.31) | 0.027 |
| Hypertension | 19 (59.4) | 62 (45.6) | 1.74 (0.80 to 3.81) | 0.160 | – | – |
| Diabetes mellitus | 9 (28.1) | 34 (25) | 1.17 (0.50 to 2.78) | 0.716 | – | – |
| Coronary artery disease | 9 (28.1) | 14 (10.3) | 3.41 (1.32 to 8.80) | 0.018 | – | – |
| Congestive heart failure | 8 (25) | 11 (8.1) | 3.79 (1.38 to 10.40) | 0.012 | – | – |
| Chronic obstructive pulmonary disease | 6 (18.8) | 11 (8.1) | 2.62 80.89 to 7.73) | 0.099 | – | – |
| Asthma | 2 (6.3) | 12 (8.8) | 0.69 (0.15 to 3.24) | 1 | – | – |
| Active malignancy | 7 (21.9) | 4 (2.9) | 9.24 (2.52 to 33.93) | 0.001 | – | – |
| Immunosuppressive treatment | 1 (3.1) | 5 (3.7) | 0.85 (0.10 to 7.50) | 1 | – | – |
| Chronic renal failure | 6 (18.8) | 6 (4.4) | 5.0 (1.50 to 16.73) | 0.012 | – | – |
| Cerebrovascular disease | 2 (6.3) | 11 (8.1) | 0.76 (0.16 to 3.60) | 1 | – | – |
| Demans | 6 (18.8) | 12 (8.8) | 2.39 (0.92 to 4.03) | 0.116 | – | – |
| Use of ACEa inhibitors or ARBsb | 10 (31.3) | 36 (26.5) | 1.26 (0.55 to 2.92) | 0.585 | – | – |
| Prophylactic hydroxychloroquine | 3 (9.4) | 11 (8.1) | 1.18 (0.31 to 4.49) | 0.732 | – | – |
| Cigarette smoker (current smoker or quitted) | 14 (43.8) | 46 (33.8) | 1.52 (0.70 to 3.33) | 0.292 | – | – |
| Vital signs | ||||||
| Heart rate, beats per minute | 87 (77 to 108.5) | 94 (83 to 103.5) | – | 0.087 | – | – |
| Systolic blood pressure, mmHg | 130 (116 to 147) | 120 (110 to 152) | – | 0.926 | – | – |
| Diastolic blood pressure, mmHg | 70 (63.5 to 75) | 72 (66.5 to 90.5) | – | 0.132 | – | – |
| Respiratory rate, breaths per minute | 25 (20 to 30) | 20 (16 to 21.3) | – | <0.001 | – | – |
| Pulse O2 saturation, % | 86 (73.5 to 94) | 92.5 (88.75 to 96) | – | <0.001 | 0.90 (0.82 to 0.99) | 0.022 |
| Laboratory results | ||||||
| White blood cells, 103/μL | 9.25 (6.48 to 13.53) | 6.78 (5.59 to 10.02) | – | <0.001 | 1.06 (0.97 to 1.14) | 0.196 |
| C-reactive protein, mg/dL | 12.05 (6.9 to 17.28) | 2.3 (0.7 to 6.98) | – | 0.001 | 1.24 (1.11 to 1.38) | <0.001 |
| Neutrophil, 103/μL | 8.25 (4.9 to 11.38) | 4.72 (3.79 to 7.16) | – | <0.001 | – | – |
| Lymphocyte, 103/μL | 0.9 (0.71 to 1.74) | 1.72 (0.86 to 2.33) | – | 0.078 | – | – |
| paO2, mmHg (for 61 patients) | 65 (54–84.8) | 69 (59.5 to 82.25) | – | 0.538 | – | – |
| FiO2, % | 0.37 (0.35 to 0.85) | 0.21 (0.21 to 0.43) | – | <0.001 | – | – |
| paO2/FiO2 (for 61 patients) | 151.4 (121.3 to 286.8) | 300 (195.7 to 435.7) | – | 0.007 | – | – |
| Thorax computed tomography results | 0.926 | – | – | |||
| Normal | 1 (14.3) | 6 (85.7) | – | – | – | – |
| Abnormal but Covid-19 incompatible | 6 (20.7) | 23 (79.3) | – | – | – | – |
| Covid-19 compatible | 25 (18.9) | 107 (81.1) | – | – | – | – |
ACE: angiotensin converting enzyme.
ARB: Angiotensin II receptor blockers.
Univariate analysis was performed to test whether the same variables predict ARDS development. The results indicate that the following parameters had a statistically significant relationship with ARDS development: older age, dyspnea, presence of any comorbid disease, congestive heart failure, chronic obstructive pulmonary disease, chronic kidney failure, ACEI or ARB use, increased respiratory rate, low O2 saturation, elevated white blood cell counts, elevated neutrophil, elevated CRP, decreased paO2, increased fiO2, and decreased paO2/fiO2 ratio. When multivariate regression analysis was performed to determine whether the variables predict ARDS development, high O2 saturation level and low heart rates were found to be associated with decreased ARDS development. The goodness of fit of the logistic regression model was determined by Hosmer-Lemeshow test (p = 0.951). The results of the univariate and multivariate analyses are given in Table 3 .
Table 3.
Univariate and multivariate analysis of variables for moderate to severe Covid-19 patients' ARDS prediction.
| Variables | Non-ARDS |
ARDS |
Univariate |
Multivariate |
||
|---|---|---|---|---|---|---|
| N (%)/Median (IQR) | N (%)/Median (IQR) | HR (95% CI) | P-value | HR (95% CI) | P-value | |
| Age, years | 57 (45 to 76) | 64 (57 to 76.3) | – | 0.018 | 1.02 (0.98 to 1.07) | 0.353 |
| Age ≥ 50 | 89 (68.5) | 35 (92.1) | 0.19 (0.05 to 0.64) | 0.004 | – | – |
| Sex (male) | 69 (53.1) | 21 (55.3) | 0.92 (0.44 to 1.89) | 0.812 | – | – |
| Symptoms | ||||||
| Temperature ≥ 38 °C | 27 (20.8) | 7 (18.4) | 1.16 (0.46 to 2.92) | 0.751 | – | – |
| Cough | 69 (53.1) | 21 (55.3) | 0.91 (0.44 to 1.89) | 0.812 | – | – |
| Dyspnea | 48 (36.9) | 30 (78.9) | 0.16 (0.07 to 0.37) | 0.001 | 2.32 (0.71 to 7.62) | 0.165 |
| Myalgia | 42 (32.3) | 6 (15.8) | 0.39 (0.15 to 1.01) | 0.075 | 1.45 (0.33 to 6.29) | 0.621 |
| Loss of smell | 12 (9.2) | 1 (2.6) | 3.76 (0.47 to 29.9) | 0.302 | – | – |
| Loss of taste | 15 (11.5) | 1 (2.6) | 4.83 (0.62 to 37.8) | 0.124 | 1.36 (0.11 to 17.27) | 0.812 |
| Nausea and vomiting | 10 (7.7) | 6 (15.8) | 0.44 (0.15 to 1.32) | 0.204 | – | – |
| Gastroenteritis | 21 (16.2) | 5 (13.2) | 1.27 (0.45 to 3.63) | 0.653 | – | – |
| Headache | 11 (8.5) | 1 (2.6) | 3.42 (0.43 to 27.38) | 0.302 | – | – |
| Hemoptysis | 1 (100) | 0 (0) | 0.89 (0.04 to 22.34) | 1.000 | – | – |
| Nasal congestion | 2 (1,5) | 0 (0) | 1.50 (0.07 to 31.88) | 1.000 | – | – |
| Conjunctivitis | 1 (0.8) | 1 (2.6) | 0.29 (0.02 to 4.70) | 0.402 | – | – |
| Throat ache | 10 (7.7) | 0 (0) | 6.71 (0.38 to 117.18) | 0.119 | 0 (0 to -) | 0.999 |
| Fatigue | 46 (35.4) | 12 (31.6) | 1.19 (0.55 to 2.57) | 0.664 | – | – |
| Asymptomatic | 10 (7.7) | 0 (0) | 1.19 (0.55 to 2.57) | 0.119 | – | – |
| Presence of any comorbid diseasea | 87 (66.9) | 32 (84.2) | 2.64 (1.02 to 6.79) | 0.039 | 1.0 (0.15 to 6.69) | 0.996 |
| Hypertension | 58 (44.6) | 23 (60.5) | 0.53 (0.25 to 1.10) | 0.084 | – | – |
| Diabetes mellitus | 32 (24.6) | 11 (28.9) | 0.80 (0.36 to 1.80) | 0.590 | – | – |
| Coronary artery disease | 15 (11.5) | 8 (21.1) | 0.49 (0.19 to 1.26) | 0.133 | – | – |
| Congestive heart failure | 11 (8.5) | 8 (21.1) | 0.35 (0.13 to 0.94) | 0.042 | – | – |
| Chronic obstructive pulmonary disease | 8 (6.2) | 9 (23.7) | 0.21 (0.08 to 0.60) | 0.004 | – | – |
| Asthma | 11 (8.5) | 3 (7.9) | 1.08 (0.29 to 4.08) | 1.000 | – | – |
| Active malignancy | 7 (5.4) | 4 (10.5) | 0.48 (0.13 to 1.80) | 0.272 | – | – |
| Immunosuppressive treatment | 5 (3.8) | 1 (2.6) | 1.48 (0.17 to 13.07) | 1.000 | – | – |
| Chronic renal failure | 6 (4.6) | 6 (15.8) | 0.26 (0.08 to 0.85) | 0.029 | – | – |
| Cerebrovascular disease | 11 (8.5) | 2 (5.3) | 1.66 (0.35 to 7.86) | 0.735 | – | – |
| Demans | 15 (11.5) | 3 (7.9) | 1.52 (0.42 to 5.56) | 0.766 | – | – |
| Use of ACEa inhibitors or ARBs** | 30 (23.1) | 16 (42.1) | 0.41 (0.19 to 0.88) | 0.021 | 3.82 (0.9 to 16.2) | 0.069 |
| Prophylactic hydroxychloroquine | 11 (8.5) | 3 (7.9) | 1.08 (0.29 to 4.08) | 1.000 | – | – |
| Cigarette smoker (current smoker or quitted) | 43 (33.1) | 17 (44.7) | 0.61 (0.29 to 1.28) | 0.187 | 1.14 (0.34 to 3.83) | 0.837 |
| Vital signs | ||||||
| Heart rate, beats per minute | 86 (76 to 96) | 94 (84 to 109) | – | 0.006 | 1.04 (1.0 to 1.08) | 0.05 |
| Systolic blood pressure, mmHg | 124 (110 to 139) | 129 (114 to 160.5) | – | 0.224 | – | – |
| Diastolic blood pressure, mmHg | 70 (64 to 78) | 74 (67.5 to 85.5) | – | 0.235 | – | – |
| Respiratory rate, breaths per minute | 19 (16 to 21) | 22 (18 to 30) | – | 0.001 | 1.0 (0.95 to 1.06) | 0.842 |
| Pulse O2 saturation, %a | 96 (94 to 97.75) | 88 (81 to 91) | – | <0.001 | 0.74 (0.64 to 0.85) | <0.001 |
| Laboratory results | ||||||
| White blood cells, 103/μL | 6.66 (5.56 to 8.41) | 9.08 (6.10 to 13.50) | – | <0.001 | 0.98 (0.89 to 1.08) | 0.693 |
| Neutrophil, 103/μL | 4.49 (3.66 to 6.40) | 7.20 (4.39 to 10.20) | – | <0.001 | – | – |
| Lymphocyte, 103/μL | 1.74 (0.90 to 2.12) | 1.11 (0.73 to1.92) | – | 0.234 | – | – |
| C-reactive protein, mg/dL | 5.60 (1.50 to 8.40) | 9.40 (1.32 to 16.63) | – | 0.001 | 1.09 (0.98 to 1.22) | 0.106 |
| paO2, mmHg (for 61 patients) | 81 (71 to 95) | 59.50 (54.75 to 65.50) | – | <0.001 | – | – |
| FiO2, %a | 0.21 (0.21 to 0.21) | 0.37 (0.29 to 0.46) | – | <0.001 | – | – |
| paO2/FiO2 (for 61 patients), ±SDa | 379.17 ± 47.6 | 171.41 ± 73.9 | – | <0.001 | – | – |
ACE: angiotensin converting enzyme, ARB: angiotensin receptor blocker, FiO2: fraction of inspired oxygen, paO2: partial pressure of oxygen, O2: Oxygen, ARDS: Acute respiratory distress syndrome.
A ROC was created for laboratory tests, and it was determined that white blood cell, neutrophil, and CRP levels and the neutrophil/lymphocyte ratio predict mortality, while lymphocyte levels do not (p values and area under the curve [AUC] results, respectively: p < 0.001, AUC = 0.731; p < 0.001, AUC = 0.774; p < 0.001, AUC = 0.822; p < 0.001, AUC = 0.75; p = 0.078, AUC = 0.600) (Fig. 2 ). CRP exhibited the best test performance for predicting mortality. The sensitivity and specificity results for different cut-off values of CRP are given in Table 4 .
Fig. 2.

Receiver operating characteristic results of laboratory test results for mortality prediction.
Table 4.
Sensitivity and specificity results of C-reactive protein for different cut-off levels.
| Cut-off values for C-reactive protein, mg/L | Sensitivity, % (95% CI) | Specificity, % (95% CI) |
|---|---|---|
| 10 | 93.8 (79.2–99.2) | 27.94 (20.59–36.28) |
| 50 | 84.4 (67.2–94.7) | 65.4 (56.81–73.38) |
| 134a | 50 (31.9–68.1) | 95.6 (90.64–98.4) |
| 170 | 25 (11.5–43.4) | 99.3 (96–100) |
Cut of level was calculated using Youden's index.
4. Discussion
As researchers are learning about Covid-19 in real time during its outbreak and knowledge about the disease is continuously slightly updated, determining the variables that predict the prognosis of the disease in different locations is crucial for the development of disease management guidelines. In this way, policymakers can determine how patients should be triaged in EDs, which patients should be hospitalized, and which ones should be treated on an outpatient basis.
In our study, we found that dyspnea, presence of any comorbid disease, CRP level, and pulse O2 saturation predict mortality in moderate to severely ill Covid-19 patients. Importantly, the presence of any comorbid disease and dyspnea are associated with increased mortality rate. Indeed, it is well-known that severe illness is more common in patients with comorbidities [5]. In a study conducted in Italy, older age, low lymphocyte count, cancer, coronary artery disease, and high radiographic assessment of lung edema score were found to be independent factors associated with increased risk of mortality [8]. According to a multiple machine learning-based classification algorithm developed by Yadaw et al., five variables were suggested as prognostic predictors: age, hydroxychloroquine use, O2 saturation, body temperature, and type of patient [9]. In a large retrospective study of 44,000 cases in China, age and presence of comorbid diseases were found to be the two main determinants of mortality in Covid-19 cases. Considering the development of ARDS, which was the secondary outcome of our study, we found that only low oxygen saturation levels and increased heart rate increased the risk of ARDS development.
In our study, some results agreed with the literature and some did not. The most striking result is that increased CRP level had the highest AUC value, indicating that it is associated with increased mortality. In a meta-analysis by Huang et al., elevated CRP levels with elevated procalcitonin, D-dimer, and serum ferritin levels were associated with a composite poor outcome for Covid-19. When the cut-off value for CRP was ≥10 mg/L, AUC was calculated as 0.84, sensitivity was 51%, and specificity was 88% [10]. While these AUC values were similar to the results of our study, the sensitivity we found was 93.8%, higher at the same cut-off level.
Importantly, age was not found to have an effect on mortality according to the multivariate analysis, although it seems to be associated with increased mortality according to the results of the univariate analysis. This could be explained by the exclusion of mild Covid-19 patients, who are likely to have a lower median age, which led to a median age of survivors of 62 years. As expected in other studies involving these excluded patients, older age appears to increase mortality [11,12]. In addition to the studies in the literature that indicate that age increased mortality, we believe that older age is associated with poor clinical outcomes in Covid-19 patients, considering that it increased the development of ARDS according to the results of our analysis.
In our study, we found that smoking was not associated with mortality or ARDS development. In studies that consider many chronic diseases, especially lung diseases caused by smoking, many authors indicate that smoking has a negative effect on the clinical outcomes of Covid-19 patients. However, the results of the literature are contradictory enough to prevent us from making a conclusion regarding this. Some studies report that smoking leads to an increased risk of adverse clinical outcomes in Covid-19 patients, and others state that tobacco smoking may facilitate transmission of the virus to other people through smoke [9,13]. However, in some studies with much larger case numbers, smoking has not been associated with poor clinical outcomes in Covid-19 patients, and confusingly, some have reported that it may have a protective effect. A meta-analysis that included five studies found that active smoking was not associated with the severity of Covid-19 when the data of individual studies were pooled (OR, 1.69; 95% CI, 0.41–6.92; p = 0.254) [14]. A study from Mexico analyzed 32,583 patient results and found that smoking was not a risk factor for Covid-19, but in fact was protective against Covid-19, with an adjusted odds ratio of 0.63 (95% CI, 0.51–0.77) [15]. Although some authors have tried to explain the “protective” effect of smoking as a result of various mechanisms, such as ACE2 allelic variants and protease activation, we believe that this interpretation may cause erroneous inferences due to the limited number of studies available today [16]. New and higher-quality studies on this topic are needed.
5. Limitations
The fact that the study was conducted at one center is a major limitation of the study that limits the generalizability of the results. The relatively low number of patients may have caused small but significant differences between groups to remain undetected. Validation of our results is needed with larger sample sizes.
6. Conclusion
Dyspnea, the presence of any comorbid disease, elevated CRP levels, and low pulse O2 saturation levels predict mortality in moderate to severely ill Covid-19 patients. In addition, low oxygen saturations and increased heart rate predict ARDS development. These criteria should be included in Covid-19 disease scoring systems developed in the future, and patients that meet these criteria should be hospitalized and treated closely.
CRediT authorship contribution statement
Gökhan Aksel: Conceptualization, Methodology, Software, Validation, Formal analysis, Writing - original draft, Writing - review & editing, Supervision, Project administration. Mehmet Muzaffer Islam: Conceptualization, Methodology, Formal analysis, Investigation, Writing - original draft, Writing - review & editing, Project administration. Abdullah Algin: Methodology, Formal analysis, Writing - original draft, Writing - review & editing, Visualization. Serkan Emre Eroğlu: Conceptualization, Writing - original draft, Writing - review & editing, Supervision. Gökselin Beleli Yaşar: Investigation, Resources, Data curation, Writing - original draft, Writing - review & editing, Visualization. Enis Ademoğlu: Methodology, Formal analysis, Investigation, Resources, Data curation, Writing - original draft, Writing - review & editing, Visualization. Ümit Can Dölek: Software, Validation, Investigation, Resources, Data curation, Writing - original draft, Visualization.
Footnotes
Supplementary data to this article can be found online at https://doi.org/10.1016/j.ajem.2020.08.076.
Appendix A. Supplementary data
Supplement material.
References
- 1.Gao G.F. From ‘A’IV to ‘Z’IKV: Attacks from emerging and re-emerging pathogens. Cell. 2018;172(6):1157–1159. doi: 10.1016/j.cell.2018.02.025. 08. [DOI] [PMC free article] [PubMed] [Google Scholar]
- 2.Morens D.M., Folkers G.K., Fauci A.S. The challenge of emerging and re-emerging infectious diseases. Nature. 2004 Jul 8;430(6996):242–249. doi: 10.1038/nature02759. [DOI] [PMC free article] [PubMed] [Google Scholar]
- 3.Taubenberger J.K., Morens D.M. 1918 influenza: The mother of all pandemics. Emerging Infect Dis. 2006 Jan;12(1):15–22. doi: 10.3201/eid1201.050979. [DOI] [PMC free article] [PubMed] [Google Scholar]
- 4.Spreeuwenberg P., Kroneman M., Paget J. Reassessing the global mortality burden of the 1918 influenza pandemic. Am J Epidemiol. 2018;187(12):2561–2567. doi: 10.1093/aje/kwy191. 01. [DOI] [PMC free article] [PubMed] [Google Scholar]
- 5.Khan G., Sheek-Hussein M., Al Suwaidi A., Idris K., Abu-Zidan F. Novel coronavirus pandemic: A global health threat. Turk J Emerg Med. 2020;20(2):55. doi: 10.4103/2452-2473.285016. [DOI] [PMC free article] [PubMed] [Google Scholar]
- 6.Coronavirus Disease (COVID-19) Situation Reports [Internet] 2020. https://www.who.int/emergencies/diseases/novel-coronavirus-2019/situation-reports [cited. Aug 17]. Available from:
- 7.COVID-19 Algoritmalar [Internet] 2020. https://covid19bilgi.saglik.gov.tr/tr/algoritmalar [cited. Apr 16]. Available from:
- 8.Ciceri F., Castagna A., Rovere-Querini P., De Cobelli F., Ruggeri A., Galli L., et al. Early predictors of clinical outcomes of COVID-19 outbreak in Milan. Italy Clin Immunol. 2020 Jun 12;217:108509. doi: 10.1016/j.clim.2020.108509. [DOI] [PMC free article] [PubMed] [Google Scholar]
- 9.Yadaw A.S., Li Y.-C., Bose S., Iyengar R., Bunyavanich S., Pandey G. 2020 May 22. Clinical predictors of COVID-19 mortality. medRxiv. [DOI] [PMC free article] [PubMed] [Google Scholar]
- 10.Huang I., Pranata R., Lim M.A., Oehadian A., Alisjahbana B. C-reactive protein, procalcitonin, D-dimer, and ferritin in severe coronavirus disease-2019: A meta-analysis. Ther Adv Respir Dis. 2020 Jan;14 doi: 10.1177/1753466620937175. (175346662093717) [DOI] [PMC free article] [PubMed] [Google Scholar]
- 11.Imam Z., Odish F., Gill I., O’Connor D., Armstrong J., Vanood A., et al. Older age and comorbidity are independent mortality predictors in a large cohort of 1305 COVID-19 patients in Michigan, United States. J Intern Med. 2020 Jun;4 doi: 10.1111/joim.13119. [DOI] [PMC free article] [PubMed] [Google Scholar]
- 12.Asfahan S., Deokar K., Dutt N., Niwas R., Jain P., Agarwal M. Extrapolation of mortality in COVID-19: Exploring the role of age, sex, co-morbidities and health-care related occupation. Monaldi Arch Chest Dis. 2020 May;21:90(2). doi: 10.4081/monaldi.2020.1325. [DOI] [PubMed] [Google Scholar]
- 13.Ahmed N., Maqsood A., Abduljabbar T., Vohra F. Tobacco smoking a potential risk factor in transmission of COVID-19 infection. Pak J Med Sci. 2020 May;36(COVID19-S4):S104–S107. doi: 10.12669/pjms.36.COVID19-S4.2739. [DOI] [PMC free article] [PubMed] [Google Scholar]
- 14.Lippi G., Henry B.M. Active smoking is not associated with severity of coronavirus disease 2019 (COVID-19) Eur J Intern Med. 2020;75:107–108. doi: 10.1016/j.ejim.2020.03.014. [DOI] [PMC free article] [PubMed] [Google Scholar]
- 15.Hernández-Garduño E. Obesity is the comorbidity more strongly associated for Covid-19 in Mexico. A case-control study. Obes Res Clin Pract. 2020 Jun 11 doi: 10.1016/j.orcp.2020.06.001. [DOI] [PMC free article] [PubMed] [Google Scholar]
- 16.Polverino F. Cigarette smoking and COVID-19: A complex interaction. Am J Respir Crit Care Med. 2020 Jun;202(3):471–472. doi: 10.1164/rccm.202005-1646LE. [DOI] [PMC free article] [PubMed] [Google Scholar]
Associated Data
This section collects any data citations, data availability statements, or supplementary materials included in this article.
Supplementary Materials
Supplement material.