

Abstract
Electronic cigarettes (ECIGs) heat and vaporize a liquid mixture to produce an inhalable aerosol that can deliver nicotine to the user. The liquid mixture is typically composed of propylene glycol (PG) and vegetable glycerin (VG), in which are dissolved trace quantities of flavorants and, usually, nicotine. Due to their different chemical and thermodynamic properties, the proportions of PG and VG in the liquid solution may affect nicotine delivery and user sensory experience. In social media and popular culture, greater PG fraction is associated with greater “throat-hit”, a sensation that has been attributed in cigarette smokers to increased presence of vapor-phase nicotine. VG, on the other hand, is associated with thicker and larger exhaled “clouds”. In this study, we aim to investigate how PG/VG ratio influences variables that relate to nicotine delivery and plume visibility. Aerosols from varying PG/VG liquids were generated using a digitally controlled vaping instrument and a commercially available ECIG, and analyzed for nicotine content by GC-MS. Particle mass and number distribution were determined using a six-stage cascade impactor and a fast particle spectrometer (TSI EEPS), with tightly controlled dilution and sampling biases. A Mie theory model was used to compute the aerosol scattering coefficients in the visible spectrum. Decreasing the PG/VG ratio resulted in a decrease in total particulate matter (TPM) and nicotine yield (R2 > 0.9, p<.0001). Measured particle count median diameter ranged between 44-97nm, and was significantly smaller for PG liquids. Although the particle mass concentration was lower, aerosols produced using liquids that contained VG had an order of magnitude greater light scattering coefficients. These findings indicate that PG/VG ratio is a strong determinant of both nicotine delivery and user sensory experience.
Introduction
Electronic cigarettes (ECIGs; Figure 1) are an increasingly prevalent product category for the self-administration of the addictive drug nicotine. These devices use an electrically powered heating element to vaporize a liquid consisting of a propylene glycol (PG)–vegetable glycerin (VG) solvent system in which nicotine, flavorants, and other additives are dissolved. As the vapors flow through the ECIG they cool and condense to form a dense, visible aerosol that is drawn into the mouth of the user. ECIG users can select from numerous product variables, including basic design type (disposable, cartomizer, or tank), electrical power input, and liquid composition, including nicotine concentration. Combined with puff topography variables such as puff duration and number of puffs drawn, these features provide users with a degree of control over the nicotine delivery profile that is probably unprecedented in the history of inhaled tobacco products (Shihadeh and Eissenberg 2015). As a result users are able to extract in a few puffs far less to far more nicotine than is drawn from a typical combustible cigarette (Talih et al. 2015), resulting in plasma nicotine levels in users that range from null to greater than is observed with use of combustible tobacco products (Bullen et al. 2010; Eissenberg 2010; Vansickel et al. 2010; Vansickel et al. 2012; Farsalinos et al. 2014; Hajek et al. 2015; Ramoa et al. 2015; St Helen et al. 2016). As nicotine exposure is a public health concern, a central task for tobacco regulatory science is to elucidate factors that influence nicotine and other toxicant delivery to the user.
Figure 1.
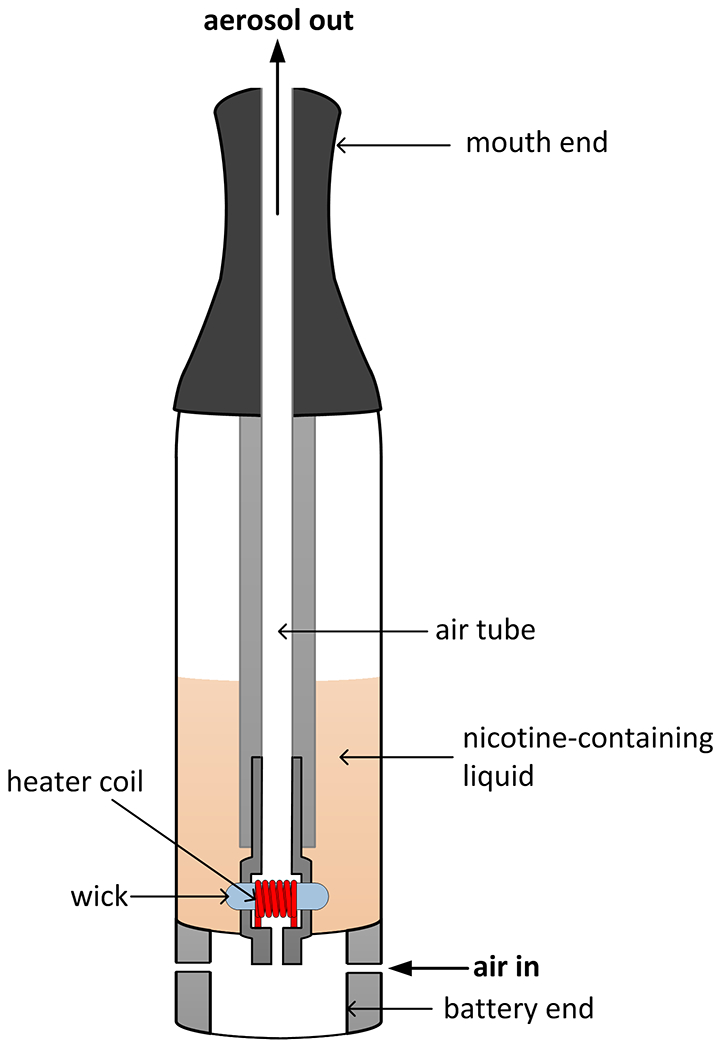
Schematic of a “tank” ECIG. When the battery is activated, the heating element heats and vaporizes the nicotine-containing liquid present in the wick. The resulting vapor is swept away towards the mouth-end of the device. As it travels through the air tube, the vapor cools and condenses into an inhalable mist.
Talih et al. (2015) have previously shown that ECIG nicotine yield (i.e. the mass of nicotine emitted in a given number of puffs) varies with power input, liquid nicotine concentration, and puff topography (puff duration, puff volume). Another variable that may influence nicotine delivery is the PG/VG ratio of the liquid. Analyses of commercially available ECIG liquids show wide variations in PG/VG ratio (Cheah et al. 2014) and YouTube videos and ECIG product websites (e.g. vaping360.com; veppocig.com) commonly advise consumers that using more PG increases “throat hit” – a harsh sensation common to smoking combustible cigarettes, and thought to be associated with vapor phase nicotine (Barbeau et al. 2013). These sources also advise that using relatively more VG, on the other hand, results in “thicker” and larger user-exhaled aerosol plumes, commonly referred to in the vaping community as “clouds.” Since both throat hit and cloud production are considered desirable qualities, ECIG users are advised to select PG/VG ratio by trading off throat hit against cloud production.
Indeed, the order of magnitude difference in vapor pressure and the approximately 100 °C difference in boiling point of PG and VG suggest that PG/VG ratio may significantly alter the evaporation-condensation processes involved in aerosolizing the liquid, resulting in varying mass emission rates and particle size distributions (PSD; Talih et al. (2016)). These differences may significantly influence ECIG emissions. To date, limited research has addressed the effect of PG/VG ratio on ECIG emissions. Kosmider et al. (2014) found that PG-based solutions generate the highest levels of aldehyde emissions. Talih et al. (2016) found that decreasing the PG/VG ratio results in a decrease in nicotine flux (the rate at which nicotine is emitted per unit of time).
The aim of this study was to investigate how PG/VG ratio influences the total particulate matter (TPM), PSD, and nicotine emissions from ECIGs under controlled conditions in which dilution and sampling biases were strictly minimized. A secondary outcome was to investigate the relationship between PG/VG ratio and aerosol light scattering efficiency. These variables together determine throat hit and aerosol visibility, two key factors that can influence user’s preference of liquid composition.
Materials and Methods
Aerosol generation
ECIG aerosols were machine-generated using a 2.5 Ohm Vapor-Fi™ tank unit (online Supplemental Information; Figure S1). This model was chosen because it represents a commonly used “second generation” tankECIG system (Soussy et al. 2016). The coil was operated at 4.3W using a home-built feedback controlled power drive. For each measurement, 15 puffs of 4 s duration were drawn at a flow rate of 16.7 ml/s (1 L/min), with an inter-puff interval of 10 s. These puff topography parameters are similar to those measured with experienced ECIG users (Spindle et. al., 2014; Behar et al., 2015), and were chosen for consistency with previous studies (Talih et al., 2015). Analytical grade PG (≥99.5%), VG (99.0-101.0%,) and nicotine (≥99%) procured from Sigma Aldrich were mixed to obtain liquid batches spanning a range of 100/0 to 0/100 PG/VG ratios by volume with a constant nicotine concentration of 18 mg/ml. Liquids were stored in the dark at 4°C for the duration of the study. When changing the liquid, the tank unit was emptied and cleaned with deionized water and ethanol and dried with compressed air. After adding the new liquid, 15 conditioning puffs were drawn prior to making any measurements. The same ECIG unit was used throughout the experiments and its electrical resistance was checked prior to every puffing bout.
Nicotine Yield and TPM Measurements
For nicotine yield and TPM, a home built digitally controlled smoking machine was configured to draw the aerosol from the ECIG through a glass fiber filter (Pall Type A/E, 47 mm) mounted in a polycarbonate holder as in Talih et al. (2015). The ECIG mouthpiece was connected to the holder via a 2 cm length of ¼-inch Tygon™ tubing. Nicotine was determined by sonicating the filter pad in 6 ml of ethyl acetate for 30 min at ambient temperature and analyzing an aliquot of the resulting solution by gas chromatography–mass spectrometry (GC-MS). The GC-MS analysis was performed on a Thermo-Finnigan Trace GC-Ultra Polaris ITQ 900 equipped with AS 3000 II autosampler. Separation was achieved with RTx®−5MS (30 m × 0.25 mm × 0.25 μm film thickness) fused silica capillary column purchased from Restek. A splitless injection mode of 1 μL and He mobile phase of 1 mL/min flow rate were utilized. The injector temperature was set at 250 ˚C. The oven temperature program was initiated at 70 ˚C for 2 min, and then ramped at 20 ˚C/min until reaching 230 ˚C. An extracted calibration curve with concentrations ranging from 1 to 20 ppm was used to interpret the resulting chromatograms. The limit of detection was calculated as the average plus three times the standard deviation of the reported values from 6 repeated measurements of a 1 ppm standard solution, and was found to be 0.15 ppm. Triplicate filter blanks were prepared by collecting 15 puffs of room air for each filter. Measured nicotine concentration in the blanks was 0 mg. Spiked filter assays of nicotine in PG solution showed recoveries of greater than 90%. See El-Hellani et al. (2016) for more methodological detail. TPM was measured by weighing the filter pad and holder before and after each sampling session. Three repeated aerosol nicotine and TPM determinations were made using 11 ECIG liquids that varied in composition from 100/0 to 0/100 PG/VG (online Supplemental Information; Table S1).
Particle Mass Distribution
Particle mass distribution was determined using a six-stage cascade impactor (CI; California Measurements Inc, Model PC 2AS) which was incorporated into the smoking machine, as shown in Figure 2. The smoking machine was programmed to draw 15 ECIG puffs of 4 sec duration through the CI. The total smoking machine flow rate of 29.2 ml/s was generated by drawing 16.7 ml/s (1L/min) through the ECIG and 12.5 ml/s of HEPA filtered lab air through a mass flow controller (OMEGA®, Model FMA5400), resulting in a net dilution ratio (DR) of 1.75:1. Because the particle mass concentrations following this modest dilution step remained much larger than the vapor saturation concentrations of the liquids involved, it can be readily shown that the amount of evaporation required to restore phase equilibrium to the diluted system require negligible changes in particle size.. A comparison between relevant mass concentrations and saturation concentrations for pure PG and pure VG is presented in Table S4. After each 15 puff bout, the weight change of each impactor stage was determined gravimetrically using a balance (A&D®, Model GR-200) with 0.1 mg sensitivity.
Figure 2.
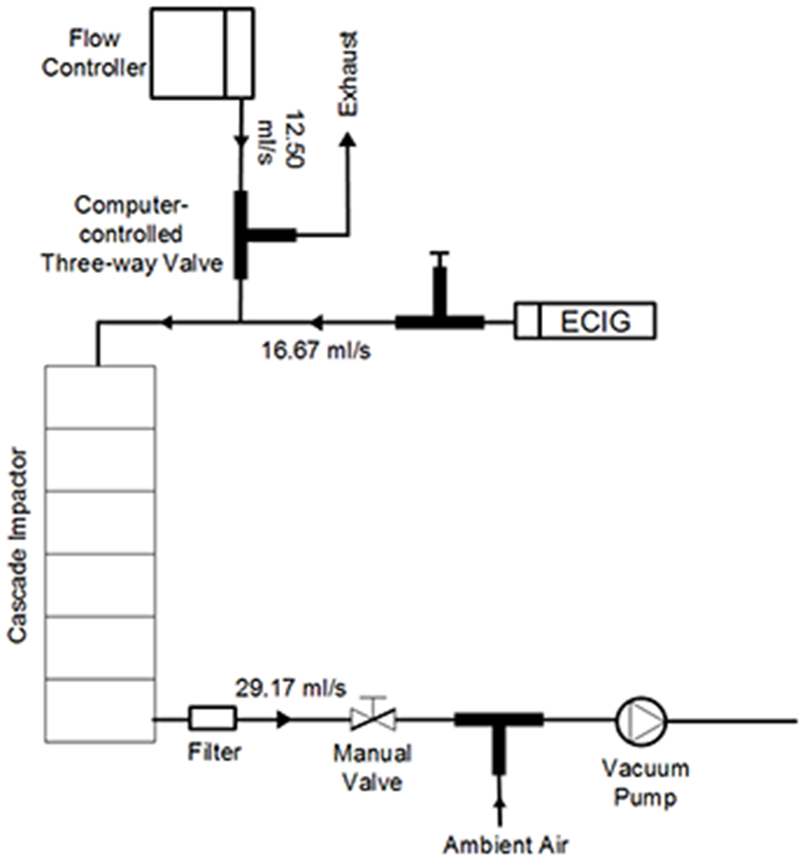
Experimental setup used to measure particle mass distribution
To estimate the degree to which reported impactor results may have been biased by sample evaporation during sample handling, we collected aerosol generated using a 100/0 PG/VG liquid and placed an impactor plate sample on the balance in the open air for 15 minutes. By the end of the 15 minutes, less than 4% of the collected mass had evaporated. During actual measurements, each impactor plate was weighed within 30 s of its removal from the impactor, thus any bias error is expected to be less than 4%. Five data sets were generated for the three liquids studied in this manner (100/0, 70/30, 0/100 PG/VG). 70/30 PG/VG is a common ratio used in commercial ECIG solutions.
Particle Number Distribution
Particle number size distributions were measured using an electrical mobility particle sizer (TSI EEPS; TSI Inc, Model 3090) with a sizing range of 5.6 – 560 nm and a sampling frequency of 10 Hz. Three bouts of 15 puffs were repeated for each ECIG liquid (100/0, 70/30, 0/100 PG/VG). During puffing, particle-free air was pushed through the ECIG at 16.67 ml/s by operating the smoking machine in a reverse-puffing configuration (Figure 3). Aerosol exiting the ECIG was diluted 290:1 to limit the number concentration of the sampled flow to within the measurement limits of the EEPS. Because the EEPS further dilutes the sample with sheath air inside the instrument, the final overall DR was 1450:1. Potential artifacts due to dilution-induced evaporation of ECIG aerosols have been discussed in the literature (Ingebrethsen et al. 2012).
Figure 3.
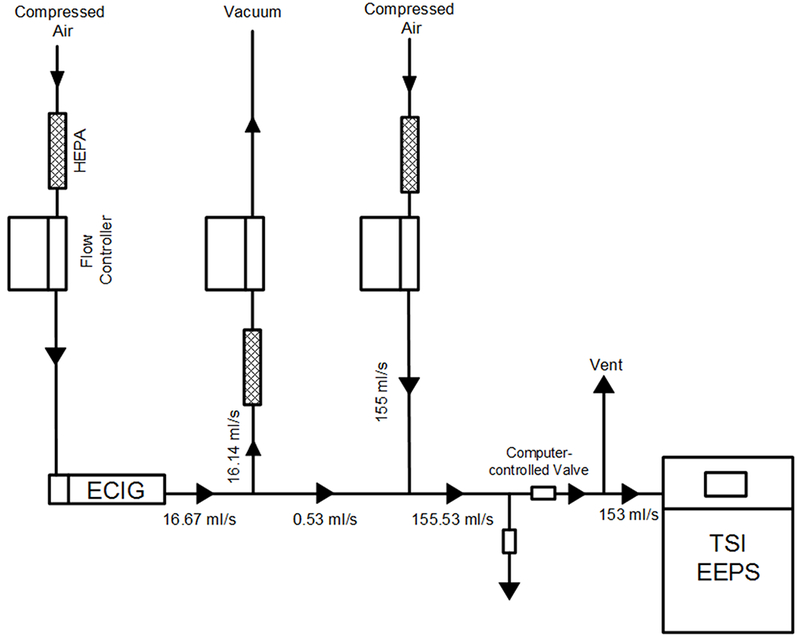
Experimental setup for measurement of particle number distribution
We investigated the potential bias in measured PSD resulting from dilution process by simulating the evolution of particle size as the aerosol passed through the setup using an unsteady plug-flow evaporation model (Saleh and Shihadeh 2007). To do so, mass PSD measured using the cascade impactor was converted into number PSD assuming a log-normal distribution and geometric standard deviation of 1.8 for PG and 1.5 for VG, and the resulting computed number distribution was merged with the number distribution measured using the EEPS. Model inputs included the vapor pressures (PG: 14.72 Pa; VG: 0.01 Pa), binary diffusion coefficients (VG: 8.2×10⁻⁶ m2/sec, PG: 8.9×10⁻⁶ m2/sec), and surface tensions of PG and VG (PG: 0.03 N/m, VG: 0.06 N/m), and plumbing mean particle residence times of 2 s. The mixing process involved in the dilution steps were conservatively assumed to take place instantaneously. Spherical particles, evaporation coefficient of unity, and inert flow boundaries (zero mass flux boundary condition) were assumed. We also used this model to estimate order of magnitude lifetimes of particles exhaled into the environment for various PG/VG compositions, by setting the vapor phase saturation ratio to zero.
We found that for our experimental conditions, only the 100/0 PG/VG condition (i.e. the most volatile condition) had the potential for significant bias in number PSD due to dilution-induced evaporation. We therefore conducted a series of measurements with a 100/0 PG/VG aerosol in which we compared PSD measured when the dilution air was pre-saturated with PG vapors to that when the dilution air was pure. We found no significant difference across these two conditions (e.g. CMD 44.3±2.9 nm vs 45.9±1.65 nm, pure air vs saturated air), and therefore for convenience conducted all measurements with zero air for the dilution stream.
Light Scattering
To explore potential effects of PSD on the visibility of particles in ECIG emissions, we used a Mie theory model (Bohren and Huffman 1983) to compute the aerosol scattering coefficients (total scattering cross-section of the aerosol particles per unit volume of air) in the visible spectrum (400 nm – 800 nm). Calculations were performed for the 100/0, 70/30, and 0/100 cases. Model inputs included the measured number PSD and the refractive indices. Both PG and VG are non-absorbing in the visible spectrum, and thus have a negligible imaginary part of the refractive index. The refractive indices used in the model for the 100/0, 70/30, and 0/100 cases were 1.43, 1.45, and 1.47, respectively (Ingebrethsen et al. 2012).
Statistical analysis
Student’s t-test was used to compare the effect of PG/VG ratio on particle size mass concentration (Cm), number distribution geometric standard deviation (GSDn), mass distribution geometric standard deviation (GSDm), mass median diameter (MMD), number concentration (N), count median diameter (CMD), and computed mean light scattering coefficient (α) (Table 1). Linear regression between PG/VG, TPM and nicotine yields were performed. All statistical analysis were conducted using SPSS version 24.0 (IBM, Armonk, NY). Statistical significance was p<.05.
Table 1.
Measured size distribution statistics and computed mean α at minimum and maximum visible wavelengths (λmin and λmax). Mean±SD; N=3 repeated measurements per condition.
| PG/VG ratio | 100/0 | 70/30 | 0/100 |
|---|---|---|---|
| Cm(μg/cm3) | 73.3 ± 5* | 52.1 ±4.2 | 38.6 ± 1.4* |
| MMD (nm) | 2279 ± 92* | 3105 ± 480 | 3573 ± 380 |
| GSDm | 1.81 ± 0.02 | 1.72 ± 0.11 | 1.56 ± 0.09* |
| N (#/cm3) | 7.80±1.04×10⁹* | 1.41±0.13×10¹⁰ | 1.50±0.24×10¹⁰ |
| CMD (nm) | 44±2* | 81±4 | 97±10 |
| GSDn | 1.54* | 2.56 | 2.65 |
| α (1/m)at λmin | 31.53 ± 0.45* | 296.21 ± 16.67 | 497.02 ± 114.01* |
| α (1/m)at λmax | 9.50 ± 0.95* | 58.61 ± 4.95 | 102.72 ± 21.56* |
Indicates significant difference relative to 70/30 PG/VG condition.
Results
TPM and nicotine yields
TPM and nicotine yields in 15 puffs ranged from 20 mg to 78 mg, and 0.13 mg to 0.58 mg, respectively (online Supplemental Information; Table S1), and were found to decrease with decreasing PG/VG ratio (R2 = 0.91, p<.0001; Figure 4). TPM and nicotine were found to be highly correlated (R2 =0.97, p<.0001), with a particle phase nicotine concentration approximately equal to that of the parent liquid in the ECIG tank (p=0.72).
Figure 4.
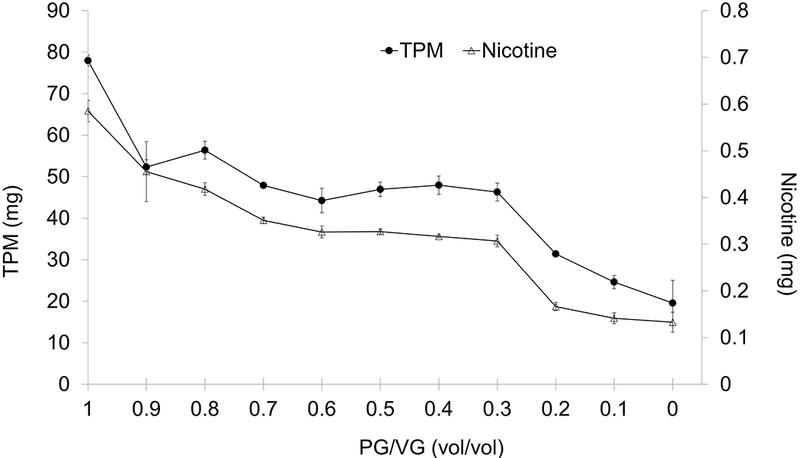
Effect of PG/VG on TPM and nicotine yields in 15 puffs of 4 s duration and 66.7 ml volume (total volume in 15 puffs = 1 liter). ECIG operating at 4.3 W. (Mean±SD, N=3)
Particle Size Distribution
Particle mass distribution of the three liquids examined using the cascade impactor had a similar pattern (Figure 5), with an average of 76±7% of the aerosol mass falling in the 0.5 to 2.5 µm size range. Mass median diameter (MMD) ranged between 2.28 µm and 3.57 µm (Table 1).
Figure 5.
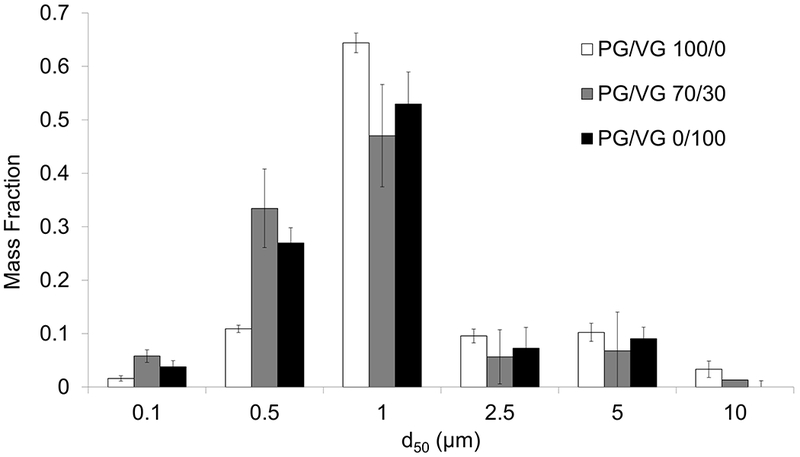
Measured particle mass distribution for 100/0, 70/30, and 0/100 PG/VG conditions. (Mean±SD; N=5 repeated measurements per condition.)
As observed with the TPM filter measurements, mass concentration (Cm) measured using the cascade impactor increased with increasing PG/VG ratio.
As shown in Figure 6, particle number distribution was bi-modal for the 70/30 and 0/100 PG/VG conditions, with a smaller mode apparent near 10 nm and the main mode near 160 nm. For the 100/0 condition, while the main mode was near 35 nm, a smaller mode is also apparent near 10 nm, but less prominently than that of the VG containing cases. Total number concentration and count median diameter (CMD) was smaller for the pure PG condition (Table 1).
Figure 6.
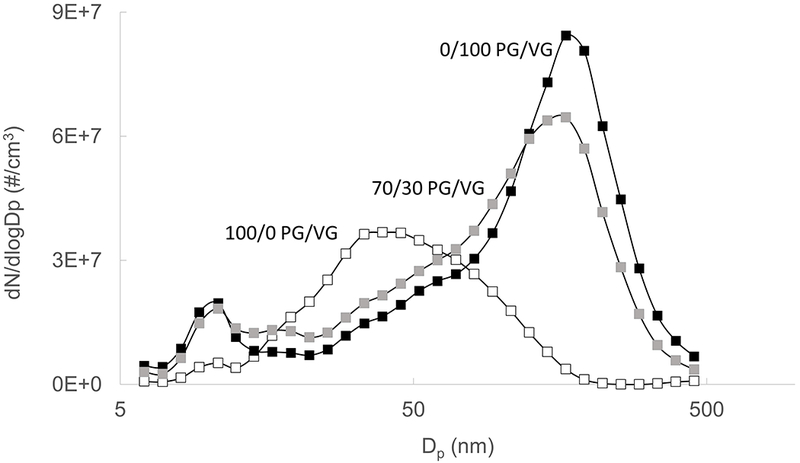
Effect of liquid composition on measured particle number distribution for 100/0, 70/30, and 0/100 PG/VG conditions. Mean of three 15-puff data sets shown for each liquid.
Light Scattering
The computed light scattering coefficients of the VG-containing aerosols in the visible wavelength were found to be an order of magnitude greater than those of the PG-based aerosol (Figure 7; Table 1). This result is expected because the VG-containing aerosol has a significantly larger concentration of particles in the size range comparable to the visible light wavelength where scattering is most efficient.
Figure 7.
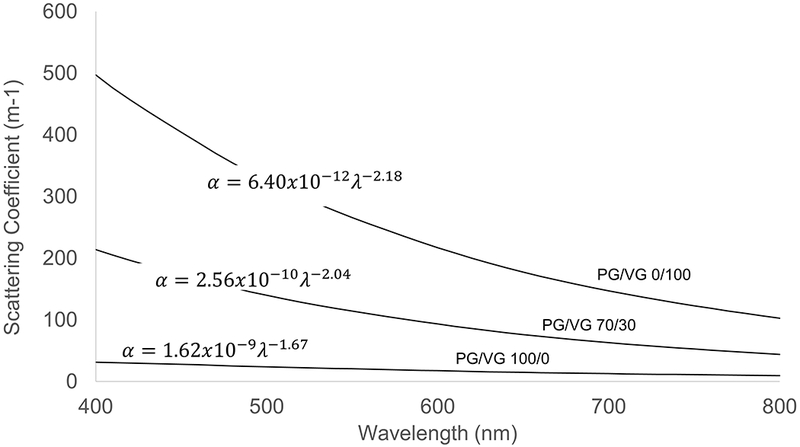
Effect of liquid composition on computed light scattering coefficient (total scattering cross-section of the aerosol particles per unit volume of air).
Discussion
This study was conducted to investigate variables that may impact nicotine delivery and aerosol plume characteristics, and their dependence on ECIG liquid composition. We found that liquid composition had a large impact on nicotine and total particulate matter emissions, with greater PG content resulting in more than 4 times greater nicotine and TPM emissions than the condition with no PG present. Greater nicotine yields of the high PG conditions is consistent with advice given to new users of ECIG devices that high PG liquids provide greater throat hit. This finding also highlights the importance of controlling for variations in PG/VG ratio in clinical studies with ECIG users.
The observation that greater nicotine and TPM emissions are associated with increasing PG/VG ratio is consistent with the heat and mass transport model proposed by Talih et al. (2016), in which the higher volatility of PG results in a greater liquid vaporization rate, and greater nicotine and TPM emissions. Interestingly, despite exhibiting a larger mass concentration, the PG-derived aerosol had an order of magnitude smaller light scattering coefficient than the aerosols produced using liquids which contained VG. Further analysis shows that this difference is almost entirely due to the relative skew of the PG-derived aerosol toward the smaller particle sizes; the differences in refractive index across liquids had little effect on scattering coefficient. These results suggest one reason why ECIG consumers use VG-containing liquids when wanting to make large, visible aerosol “clouds”. Another reason may derive from the order of magnitude smaller vapor pressure of VG, resulting in far slower particle evaporation time scales and therefore a longer-lived cloud. We found that simulated evaporation time scales of the PG-based aerosols in a vapor-free environment were two orders of magnitude smaller than those of the VG-based aerosols measured in this study.
To the extent that particle size distribution impacts particle delivery to the lung, the variations across the conditions studied are not clinically important (i.e. there are negligible differences in computed regional lung deposition patterns using the ICRP model). When compared to combustible cigarettes, however, ECIGs exhibit considerably more complex PSDs, with multiple modes spanning the nano-to-micrometer size ranges. These varying modes may correspond to differing particle sources in the ECIG; for example, it has been suggested by Mikheev et al. (2016) that the mode in the sub 50 nm size range may be due to metal emissions from the heating filament. In addition, we note that while cigarette aerosol PSDs are almost entirely in the submicron range, ECIG aerosol spans a wider size range (online Supplemental Information; Table S3) that requires more than one measuring instrument type for full characterization.
In recent years, several reports of ECIG aerosol PSDs have appeared in the scientific literature, as summarized in Table S2. While the reports are in broad agreement that ECIG aerosols are by number predominantly found in the submicron size range, the variability in measurement techniques and various degrees to which researchers attempted to control for or recognize potential dilution biases and the importance of ECIG liquid composition used put into question any interpretation of much of the reported data. While Ingebrethsen et al. (2012) report that varying dilution conditions across studies may account for discrepancies in reported PSDs, we caution also that ECIG aerosols appear to contain a part of their mass in a size range greater than 1000 nm. As a result conversion of count size distribution to mass or volume distribution using instruments which do not size super-micron particles will also introduce errors. Fuoco et al. (2014) utilized an instrument with a particle size range lower limit near 5 nm and found a number mode near 100 nm, whereas studies made with instruments that could not resolve small particles reported CMDs in the several-hundred nm size range (e.g. Ingebrethsen et al., 2012; Alderman et al., 2014). Clearly, the reported results are dependent on the instruments used. Finally, we note that Alderman et al. (2014) previously reported head-to-head comparisons of PSD across different PG/VG ratios. Like the current study, they found that increasing PG concentration in the liquid resulted in smaller CMD and MMD.
Conclusions
PG/VG ratio has a large impact on nicotine emissions, total particulate matter, and aerosol light scattering cross-section. Consistent with the “throat hit” versus “cloud making” tradeoff reported in ECIG consumer literature, greater PG content increases nicotine yield, while greater VG content increases aerosol visibility because it increases average particle size. Contrary to common understanding, the greater visibility of VG aerosols comes despite the lower mass concentration of the aerosol, not because of it. Future clinical studies of ECIG nicotine delivery must account for variations in PG/VG ratio of the products used, in addition to nicotine concentration. Similarly, to the extent that ECIGs will be regulated for nicotine emissions, regulations addressing liquid composition will need to account for PG/VG ratio in addition to nicotine concentration.
Supplementary Material
Nomenclature
- PSD
Particle size distribution
- TPM
Total particulate matter (mg)
- Cm
Mass concentration (μg/m3)
- GSDn
Geometric standard deviation of particle number size distribution
- GSDm
Geometric standard deviation of particle mass size distribution
- MMD
Mass median diameter (nm)
- N
Number concentration (#/cm3)
- CMD
Count median diameter (nm)
- α
Light scattering coefficient (1/m)
- λmin
Minimum visible wavelength (nm)
- λ max
Maximum visible wavelength (nm)
References
- Barbeau AM, Burda J, and Siegel M (2013). “Perceived efficacy of e-cigarettes versus nicotine replacement therapy among successful e-cigarette users: a qualitative approach.” Addiction Science & Clinical Practice, 8(1), 1. [DOI] [PMC free article] [PubMed] [Google Scholar]
- Bohren CF, and Huffman DR (1983). Absorption and scattering of light by small particles. Wiley; New York, . [Google Scholar]
- Bullen C, McRobbie H, Thornley S, Glover M, Lin R, and Laugesen M (2010). “Effect of an electronic nicotine delivery device (e cigarette) on desire to smoke and withdrawal, user preferences and nicotine delivery: randomised cross-over trial.” Tob.Control, 19(2), 98–103. [DOI] [PubMed] [Google Scholar]
- Cheah NP, Chong NW, Tan J, Morsed FA, and Yee SK (2014). “Electronic nicotine delivery systems: regulatory and safety challenges: Singapore perspective.” Tob.Control, 23(2), 119–125. [DOI] [PubMed] [Google Scholar]
- Eissenberg T (2010). “Electronic nicotine delivery devices: ineffective nicotine delivery and craving suppression after acute administration.” Tob.Control, 19(1), 87–88. [DOI] [PMC free article] [PubMed] [Google Scholar]
- El-Hellani A, Salman R, El-Hage R, Talih S, Malek N, Baalbaki R, Karaoghlanian N, Nakkash R, Shihadeh A, and Saliba NA (2016). “Nicotine and Carbonyl Emissions From Popular Electronic Cigarette Products: Correlation to Liquid Composition and Design Characteristics.” Nicotine Tob.Res. [DOI] [PMC free article] [PubMed] [Google Scholar]
- Farsalinos, KE., Spyrou, A, Tsimopoulou, K, Stefopoulos, C, Romagna, G, and Voudris, V. (2014). “Nicotine absorption from electronic cigarette use: comparison between first and new-generation devices.” Scientific Reports, 4. [DOI] [PMC free article] [PubMed] [Google Scholar]
- Hajek P, Goniewicz ML, Phillips A, Myers Smith K, West O, and McRobbie H (2015). “Nicotine intake from electronic cigarettes on initial use and after 4 weeks of regular use.” Nicotine Tob.Res, 17(2), 175–179. [DOI] [PMC free article] [PubMed] [Google Scholar]
- Ingebrethsen BJ, Cole SK, and Alderman SL (2012). “Electronic cigarette aerosol particle size distribution measurements.” Inhal.Toxicol., 24(14), 976–984. [DOI] [PubMed] [Google Scholar]
- Kosmider L, Sobczak A, Fik M, Knysak J, Zaciera M, Kurek J, and Goniewicz ML (2014). “Carbonyl compounds in electronic cigarette vapors: effects of nicotine solvent and battery output voltage.” Nicotine Tob.Res, 16(10), 1319–1326. [DOI] [PMC free article] [PubMed] [Google Scholar]
- Mikheev, VB, Brinkman, MC, Granville, CA, Gordon, SM, and Clark, PI. (2016). “Real-Time Measurement of Electronic Cigarette Aerosol Size Distribution and Metals Content Analysis.” Nicotine Tob.Res., 18(9), 1895–1902. [DOI] [PMC free article] [PubMed] [Google Scholar]
- Ramoa C, Spindle T, Osei K, Kilgalen B, Breland A, and Eissenberg T (2015). “Does electronic cigarette liquid nicotine concentration and user experience influence plasma nicotine concentration?” Drug Alcohol Depend, (156), e185. [Google Scholar]
- Saleh R, and Shihadeh A (2007). “Hygroscopic growth and evaporation in an aerosol with boundary heat and mass transfer.” J.Aerosol Sci, 38(1), 1–16. [Google Scholar]
- Soussy S, Ahmad EH, Baalbaki R, Salman R, Shihadeh A, & Saliba NA (2016). “Detection of 5-hydroxymethylfurfural and furfural in the aerosol of electronic cigarettes.” Tobacco control, tobaccocontrol-2016. [DOI] [PubMed] [Google Scholar]
- Shihadeh A, and Eissenberg T (2015). “Electronic cigarette effectiveness and abuse liability: predicting and regulating nicotine flux.” Nicotine Tob.Res, 17(2), 158–162. [DOI] [PMC free article] [PubMed] [Google Scholar]
- Shihadeh A, Sheheitli H, and Daher N, (2008). A poster presented at the annual meeting of the American Association for Aerosol Research. (AAAR) Orlando, FL. [Google Scholar]
- St Helen G, Havel C, Dempsey DA, Jacob P, and Benowitz NL (2016). “Nicotine delivery, retention and pharmacokinetics from various electronic cigarettes.” Addiction, 111(3), 535–544. [DOI] [PMC free article] [PubMed] [Google Scholar]
- Talih S, Balhas Z, Salman R, El-Hage R, Karaoghlanian N, El-Hellani A, Baassiri M, Jaroudi E, Eissenberg T, and Saliba N (2016). “Transport phenomena governing nicotine emissions from electronic cigarettes: model formulation and experimental investigation.” Aerosol Science and Technology, (just-accepted),. [DOI] [PMC free article] [PubMed] [Google Scholar]
- Talih S, Balhas Z, Eissenberg T, Salman R, Karaoghlanian N, El Hellani A, Baalbaki R, Saliba N, and Shihadeh A (2015). “Effects of user puff topography, device voltage, and liquid nicotine concentration on electronic cigarette nicotine yield: measurements and model predictions.” Nicotine Tob.Res, 17(2), 150–157. [DOI] [PMC free article] [PubMed] [Google Scholar]
- Vansickel AR, Weaver MF, and Eissenberg T (2012). “Clinical laboratory assessment of the abuse liability of an electronic cigarette.” Addiction, 107(8), 1493–1500. [DOI] [PMC free article] [PubMed] [Google Scholar]
- Vansickel AR, Cobb CO, Weaver MF, and Eissenberg TE (2010). “A clinical laboratory model for evaluating the acute effects of electronic “cigarettes”: nicotine delivery profile and cardiovascular and subjective effects.” Cancer Epidemiol.Biomarkers Prev, 19(8), 1945–1953. [DOI] [PMC free article] [PubMed] [Google Scholar]
Associated Data
This section collects any data citations, data availability statements, or supplementary materials included in this article.