Abstract
In terms of dose distribution, protons are more sensitive to range variations than photons due to their unique properties. The aim of this study was to develop a method to identify patient-specific robust proton beam angles for lung tumor irradiation by investigating the association between water equivalent thickness (WET) variation and inter-fraction motion-induced target dose degradation. Using 3-dimensional computed tomography (3D-CT) images, the impact of WET variations on the target dose coverage of a series of coplanar proton beams was evaluated for 4 patients with lung cancer. Using ray tracing, WET maps, or WET baseline, were estimated for the internal target volume (ITV) at every 5° gantry interval in the axial plane. After calculating the WET baseline, the planning CT was shifted 5 mm in each anterior-posterior (AP), superior-inferior (SI), and left-right (LR) direction, yielding a total of 6 shifted CTs, and differential WET maps between the planning CT and each shifted CT were calculated. Target dose differences were associated with the average WET change between the original planning CT and the shifted CTs for all 360° gantry rotation beams. Target and OAR dose metrics in the ΔWET-guided plans were compared with those of the clinical plans. The WET variation maps showed areas of both high and low WET variations, with overall similar patterns yet individual differences reflecting tumor position differences. For all 4 patients investigated in this study, the coplanar plans demonstrated a strong correlation between WET changes and ITV dose reductions. Target dose coverage was more stable with the ΔWET-guided plan while OAR doses were comparable to the clinical plan. The WET variation maps have been used in this pilot study to identify proton beam angles that are either sensitive or robust to WET changes in proton passive scattering. This work demonstrates the feasibility of using WET variation maps to assist the planner in inter-fraction motion-robust proton beam angle selection.
Keywords: proton radiation therapy, lung cancer, passive scattering, treatment planning, inter-fraction motion, robustness
Introduction
Lung cancer is the second most common cancer in the United States and the leading cause of cancer deaths, with more people dying from lung cancer than of colon, breast, and prostate cancers combined each year. The American Cancer Society predicted over 228,000 new cases of lung cancer in 2019 and anticipated over 142,000 related deaths.1 Five-year survival rates vary wildly depending on the state and extent of disease, but range from nearly 50% for stage I disease to only 1% for stage IV.2
Proton radiation therapy provides a unique path to lung cancer treatment.3-6 Benefit from the unique characteristics of protons, better normal tissue sparing can be achieved by using protons than photons.7,8 Protons deposit majority of their energy in tissue near the end of their range, the penetration depth depends on the tissue densities along the beam path and the energy of the protons. Therefore, protons are more sensitive to changes in patient anatomy and motion9-11 and treatment planning of proton therapy is an inherently complex process that involves the participation of multiple specialists. An effective proton plan must not only deliver a prescription dose to a specified target, but also spare as much normal tissue as possible, with high robustness against dosimetric perturbations of various uncertainties.3,12 At present, the selection of suitable beam angles in proton therapy is generally based upon the experience of the planner. Given the inter- and intra-fractional motion induced by patient setup and the sensitivity of protons to anatomical changes, treatment planners require assistance in choosing robust beam angles with proton radiation therapy.
The beam angles yielding the least density changes in the tissue traversed by the proton beams are considered most robust to range and setup uncertainties. The proton energy is often defined in terms of water-equivalent thickness (WET) in order to relating proton ranges in different materials.13,14 The range uncertainties are therefore closely coupled to WET changes in the proton beam path. Casarez-Magaz et al.15 investigated the correlation of WET variation with dose degradation on 4D-CT scans of lung cancer patients. Matney et al.16 studied the perturbation of WET using 4D-CT and correlate it with the patient respiratory motion. While the previous studies investigated the intra-fraction motion interplay effects based on 4D-CT, proton lung cancer plan robustness has not been analyzed from the perspective of inter-fraction motion, i, e, setup errors. In this study, we developed a WET variation method to assist coplanar beam angle selection to improve plan robustness against inter-fraction motion in lung cancer proton therapy using passive scattering. A metric was developed to assess changes in the WET for all possible beam angles with different setup uncertainties. Because of setup uncertainty, this metric was associated with target dose degradation, thus providing an important method for choosing the most reliable and stable beams for the treatment.
Methods and Materials
Design and Procedure
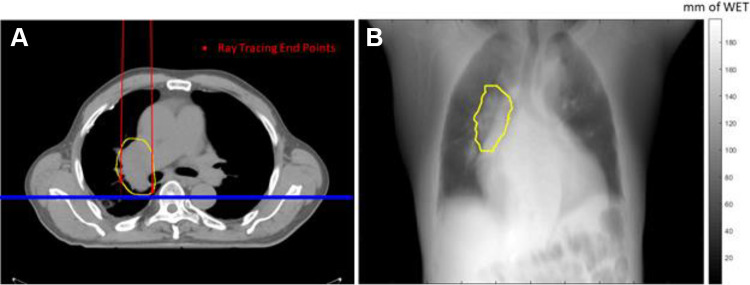
The primary aim of this work was to evaluate the robustness of each beam angle compared with patient inter-fraction motion, i.e. setup uncertainties, in proton passive scattering. Planning CT was used to calculate the WET baseline at any specific angle. A plane perpendicular to the beam line and at the furthest distal end of the ITV structure was defined to accumulate the WET. All proton rays passing through the ITV structure along the beam line were selected to calculate the beam’s eye view (BEV) WET map. The BEV WET map is a 2D map, where each pixel is the WET accumulation of all voxels along the ray path, from the virtual proton source to each distal end voxels on the ITV structure, as shown in Figure 1.
Figure 1.
Conceptual illustration of the WET map calculation used in this study. (a) The ITV structure is shown contoured by the yellow line. The beam angle was at 0°; the red dots represent the end voxels of each ray tracing; the blue plane was defined to accumulate the WET map. (b) The WET map accumulated on the blue plane. A ray passing through the ITV will stop at the distal end of the ITV; otherwise, it will stop at the virtual detector defined by the blue plane. Note that only the WET in the ITV region was included in the statistics analysis.
After calculating the WET baseline for all beams in the full 360° rotation, the planning CT was shifted 5 mm (in keeping with the smearing radius of the range compensator) in each of the anterior-posterior (AP), superior-inferior (SI), and left-right (LR) directions. The WET maps were recalculated for each set of shifted CTs using the same method. The absolute difference of BEV WET maps between the planning CT and each shifted CT, or the ΔWET map, was calculated. In order to obtain a specific WET value for each beam angle, the ΔWET BEV map was averaged over all considered ray paths. For all gantry angles ranging from 0° to 360° with a 5° interval in the axial plane, the mean ΔWET was determined.
WET Calculation
In-house software was developed using MATLAB (MathWorks, Natick, MA) and C++ to conduct this study. The stoichiometric calibration method was used to convert the HU value of each voxel of the planning CT to relative proton stopping powers. With a ray-tracing technique, the WET between the given start point and stop point was determined for further analysis. As shown in Equation (1), the product of the ray path length (li) and the relative stopping power (RSPi) of 1 voxel represents the WET within that voxel. Accumulation of the WETi from all voxels traversed by the ray represents the total WET of the ray path:
Where i represents the voxel number along the ray tracing line.
WET Analysis
The WET matrix was projected to a 1 x 1 mm2 2D detector plane, as shown in Figure 1. The proton WET required to adequately cover the volume of ITV is represented by each pixel on the 2D detector. The WET changes along each ray path was calculated by taking the WET map difference between the planning CT and shifted CTs. Same process was carried out for all gantry angles around the patient, ranging from 0° to 360° with a 5° interval. The ΔWET matrix mean values were calculated for each beam angle and plotted to estimate the angle-dependent motion robustness.
Patient Data
Four patients with mediastinum lung cancer were retrospectively enrolled in this study. 4D-CT data sets were acquired on a Philips 16-slice Brilliance Big Bore CT Scanner (Phillips Medical Systems, Cleveland, OH) for the purpose of proton radiotherapy. Helical mode was used for the acquisitions, with a table pitch of 0.06 and 1200 mAs effective exposure at 140 kVp. The 4D reconstruction was performed using simultaneous acquisition of a Pneumo Chest pressure belt (Lafayette Instrument, Lafayette, IN) respiratory surrogate signal. The reconstruction produced 10 3D CT frames with a 1 x 1 x 2 mm3 voxel size.
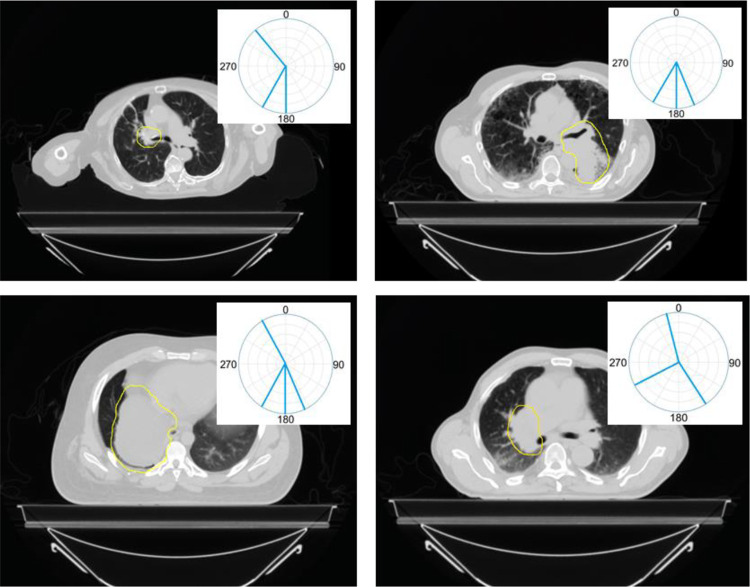
Average intensity projection (AVG) and maximum intensity projection (MIP) were created from the 4D-CT images and were used to delineate the normal tissue and target contours, respectively. The proton radiotherapy planning for each patient was carried out on the AVG CT as well. The plan dose was calculated using the Eclipse treatment plan system (Varian Medical Systems, Palo Alto, CA). Typically less beam angles are preferred when treating with protons compared to photon therapy. As shown in Figure 2, the 4 proton passive-scattering plans used a total number of 13 fields, averaging 3 fields per patient.
Figure 2.
The target contours and clinical beam arrangements for all 4 patients in this study. The ITV structures are shown contoured by the yellow lines and beam angles are shown by aqua lines. The 4 proton passive-scattering plans used a total number of 13 fields, averaging 3 fields per patient.
Correlation of ΔWET to ΔDose
Previous studies conducted by other groups have demonstrated that WET variation is correlated with dose degradation.15,17 The correlations of ΔWET to ΔDose are further investigated in this study by comparing the dose volume histograms (DVHs) of the planner-selected treatment plans with those of the ΔWET-guided treatment plans. DVHs of planner-selected treatment plans and ΔWET-guided beam plans were calculated on perturbed CT sets shifted 3 mm each in the anterior, left, and superior directions for comparison.
Results
Water Equivalent Thickness Analysis
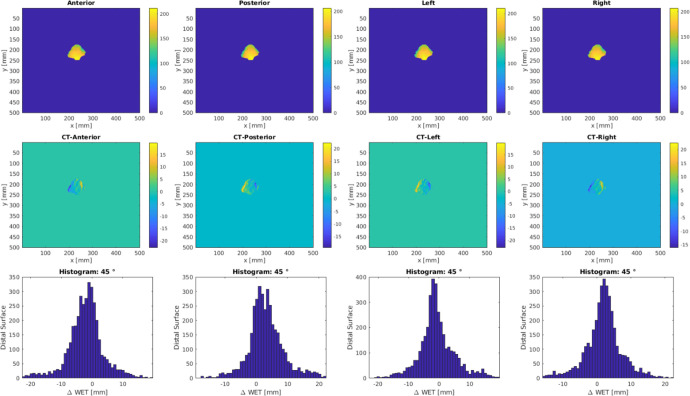
Figure 3 shows an example of ΔWET analysis output. The planning CT was shifted 5 mm in the anterior-posterior, left-right, superior-inferior directions and the corresponding WET maps were estimated with ray tracing. The WET difference maps between the planning CT and the shifted CT were calculated and the histograms were plotted for ΔWET visual assess per field.
Figure 3.
Example output of ΔWET analysis for beam angle at 45°. Top row is the BEV WET matrix at the distal edge of the ITV for various CT shifts. The ΔWET matrix, as shown in the second row, is calculated from the difference between the planning CT and shifted CTs. Histograms are shown in the third row for ΔWET visual assess per field.
Beam Angle Analysis
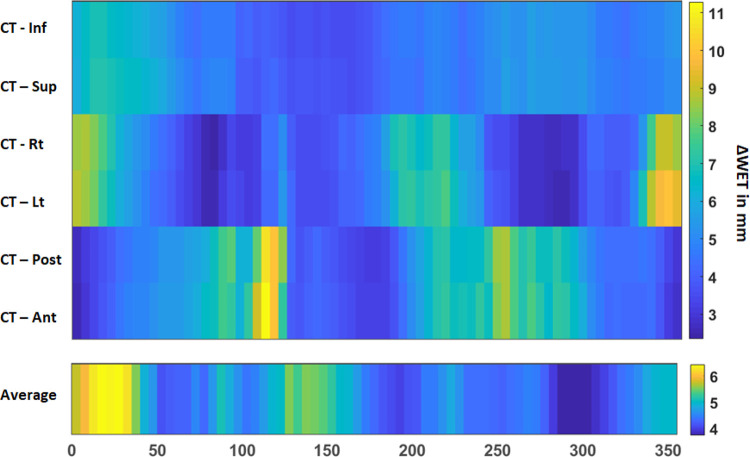
The calculated ΔWET for all gantry angles ranging from 0° to 360° with a 5° interval in the axial plane is plotted as a function of the angle around the patient. This calculation was performed on the shifted CT in the AP, LR, and SI directions, respectively, as shown in Figure 4. For the planning CT shifted in 6 directions, the ΔWET maps showed larger variations across angles, especially in the LR and AP directions.
Figure 4.
Example of a ΔWET map mean value versus the beam angle output in a coplanar arrangement around a patient. The upper plot is the ΔWET map mean value between the planning CT and shifted CT in the AP, LR, SI directions. The lower plot is the average value of all directions for each angle.
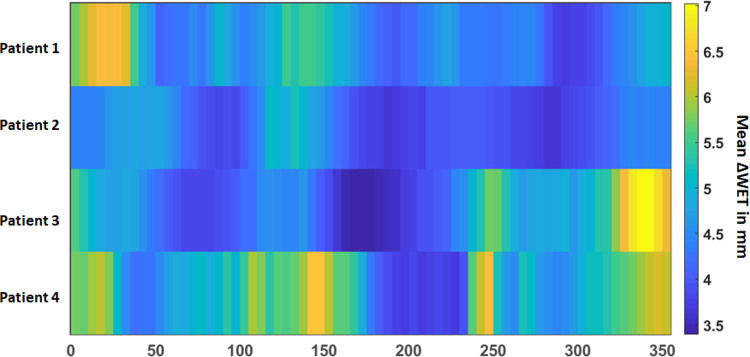
The average ΔWET map of the 4 patients with different gantry angles is shown in Figure 5 where a general pattern of least variation remains around the posterior beams (160°-220°), but the anterior variation pattern differs from patient to patient.
Figure 5.
Mean values of the ΔWET maps versus the beam angle output for all 4 patients investigated in this study.
DVH Analysis
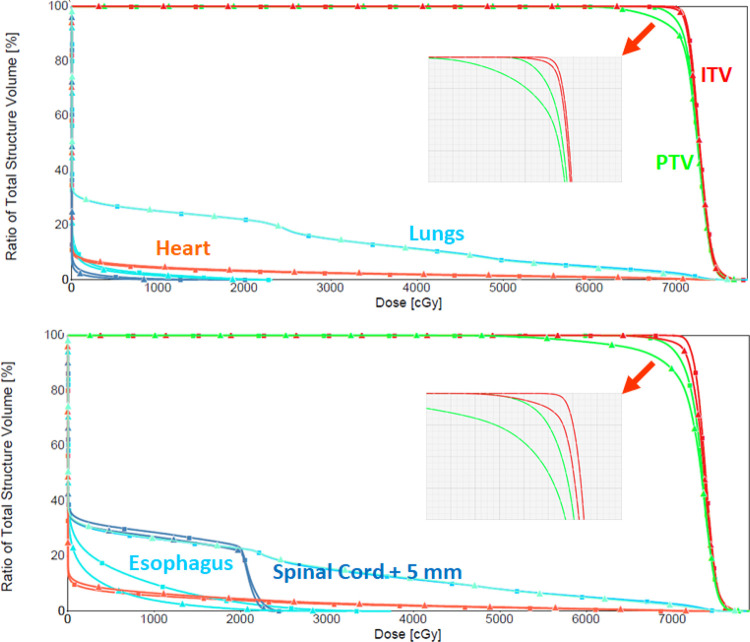
Figure 6 shows a comparison of a ΔWET-guided plan and a clinical plan initially used. As shown by the DVHs in Figure 7 and Table 1, they yield very similar coverage. The DVHs between the original CT and shifted CT (5-mm vector, 3 mm each to the anterior, left, and superior directions) for both the ΔWET-guided plan and the original clinical plan are compared in Figure 7 and Table 1 as well.
Figure 6.
Comparison of a ΔWET-guided plan (left) and a clinical plan initially used (right). New field angles of 295°, 230°, and 185° field angles were used in the ΔWET-guided plan, while 145°, 345°, and 245° field angles were used the original plan.
Figure 7.
For the example patient showed in Figure 6, this figure shows the ΔWET-guided plan (top) DVH curves before and after the shift. DVH curves from the original plan (bottom) before and after the shift from the original clinical plan are shown for comparison.
Table 1.
Statistics for the ΔWET-Guided Plan and Clinical Plan From Figure 6.
| Before shift | After shift | ||||
|---|---|---|---|---|---|
| Structure | Dose metrics | Clinical | ΔWET-guided | Clinical | ΔWET-guided |
| PTV | CI | 1.1 | 1.1 | 1.1 | 1.1 |
| Dmax (%) | 113 | 112 | 112 | 111 | |
| V95% (%) | 100 | 100 | 94 | 97 | |
| ITV | V99% (%) | 100 | 100 | 98 | 100 |
| Lungs | V5 Gy (%) | 28.5 | 26.5 | 28.7 | 27.2 |
| V20 Gy (%) | 22.5 | 21.5 | 22.7 | 22.0 | |
| Dmean (Gy) | 10.2 | 9.8 | 10.7 | 10.1 | |
| Esophagus | V55 Gy (%) | 0 | 0 | 0 | 0 |
| Dmean (Gy) | 0.2 | 0.6 | 1.3 | 0.5 | |
| Heart | V50 Gy (%) | 1.3 | 1.4 | 1.5 | 1.6 |
| Dmean (Gy) | 0.2 | 1.8 | 2.4 | 2.0 | |
| Cord+5mm | Dmax (Gy) | 24.9 | 21.7 | 24.1 | 14.6 |
Abbreviations: VxGy: portion of OAR volume irradiated by dose higher than x Gy (unit: percentage of OAR volume); Vx%: portion of target volume irradiated by x% of the prescribed dose (unit: percentage of target volume); Dmax: maximum dose (unit: Gy); Dmean: mean dose (unit: Gy).
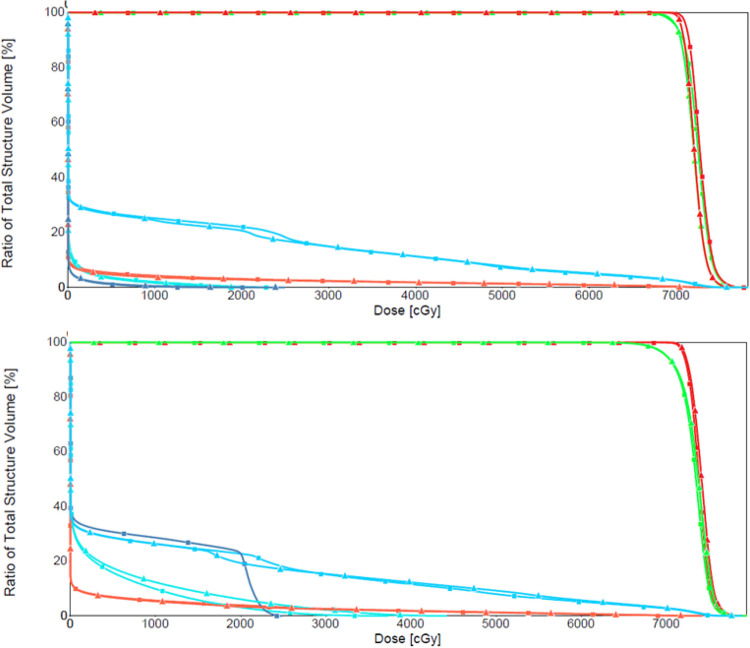
The robustness of the beams was further validated using a patient verification scan. Both the planner-selected treatment plan and the ΔWET-guided treatment plan yielded robust coverage, as shown in Figure 8.
Figure 8.
The ΔWET-guided plan (top) DVH curves using the planning CT and evaluation CT. DVH curves from the planner-selected-treatment-plan (bottom) are shown for comparison.
Discussion
A method of assessing the robustness of proton beam angle selection versus beam dose coverage has been presented in this study for passive-scattering lung cancer proton treatment, taking into account the dose degradation due to inter-fraction motion in the WET. The suggested WET measurement has been found in the 4 investigated cases to have a clear association with the dose degradation across the angles of the beam.
WET Analysis
As shown in Figure 1, this study focused on calculating the ΔWET map in beam’s eye view, and the ray tracing stops at the distal edge of ITV structure. The proton WET required to adequately cover the volume of ITV is represented by each pixel on the 2D detector. It was purposely designed as this in this study due to the characteristics of proton beams as we described in the introduction section.
Beam Angle Analysis
While a small number of patients were investigated in this pilot study, the findings indicate that the metric of ΔWET is strongly associated with dose coverage variation. It shows a general pattern of least variation around the posterior beams (160°-220°), whereas the anterior variation pattern differs from patient to patient.
Plan Quality
Figure 7 and Table 1 showed the DVH changes between the ΔWET-guided plan and the original plan before and after the CT shift. These results demonstrate that compare to the original treatment plan, the ΔWET-guided plans are more robust to the setup uncertainties. Note that the DVH in the ΔWET-guided plans are not always improved compared to the original plan. However, plan dose variations are reduced for all studied cases, as the intention of this study is not to create a superior plan compared to the original, but rather to create a plan that is more stable to the uncertainties of inter-fraction setup.
Typically, 3 beams are used for lung cases to minimize the overall impact of beam range uncertainties for passive scattering at our institute. Anterior beams are used judiciously because of chest (breathing) motion. Posterior oblique beams are used often when considering target size, beam overlapping, and OAR sparing. Patient setup is routinely monitored with kV-kV, cone-beam CT, and weekly verification CT. On the other hand, we avoided passing the beam through the couch edge and possible skin fold, although the planner-selected treatment plan demonstrates a suboptimal beam angle by having the right posterior-oblique beam pass through the table edge. For smaller targets for which other posterior angles can be used, beam angles passing through the shoulder are prohibited.
Clinical Implementation
In clinical practice, ΔWET-guided angle selection can assist the planner in choosing robust angles before planning. The method proposed in this study only requires target contour information and planning CT images. The physician’s delineation of target volumes is one of the initial steps toward creating a treatment plan for the patient. Therefore, to guide beam-angle selection for the planner, the ΔWET analysis can be completed before the treatment plan.
Study Limitations
Many factors should be considered when selecting field angles for proton radiation therapy, motion robustness being one of them. The ΔWET-based beam angle selection, based on translational shifts only, is limited in describing all possible combinations of inter-fraction setup errors, intra-fraction motion, and patient anatomy changes that occur throughout a proton therapy treatment course. This study mainly focuses on the inter-fraction setup uncertainties. The intra-fraction motion was simply included by introducing a large setup error.
In addition, this study does not include the OAR dose sparing in the angle selection process as the IMRT auto-plan proposed by the other groups. Different optimization algorithms and OAR dose constraints would influence the beam selection. Note that in Figure 6, the WET-guided plan created hot spots in the chest wall, this can be improved by the OAR dose sparing in the angle selection process in our future work. Future studies, including larger patient populations, are warranted to incorporate both the 4D-CT data and the OAR dose sparing into the proton beam angle selection.
Conclusion
This pilot study demonstrated the feasibility of using WET variation maps to assist the planner in selecting robust beam angles for passive-scattering proton therapy. The associations between the WET variations and the target dose coverage degradations have been investigated in this study and the proposed approach could effectively classify proton field angles that are either sensitive or robust to WET changes, thereby assisting the planner in developing a robust passive scattering proton plan.
Acknowledgments
The authors would like to thank Dr. Ying Feng at University of Florida Health Proton Therapy Institute (UFHPTI) for patient data collection and discussions about treatment planning, and Ms. Jessica Kriwan from University of Florida Department of Radiation Oncology Research & Editorial Office for the editorial review of this manuscript.
Footnotes
Declaration of Conflicting Interests: The author(s) declared no potential conflicts of interest with respect to the research, authorship, and/or publication of this article.
Funding: The author(s) received no financial support for the research, authorship, and/or publication of this article.
ORCID iD: Yawei Zhang  https://orcid.org/0000-0001-6436-264X
References
- 1. American Cancer Society. Lung cancer statistics. 2019.
- 2. American Cancer Society. Key statistics for lung cancer. 2019.
- 3. Vyfhuis MAL, Onyeuku N, Diwanji T, et al. Advances in proton therapy in lung cancer. Ther Adv Respir Dis. 2018;12:1753466618783878. [DOI] [PMC free article] [PubMed] [Google Scholar]
- 4. Rwigema JM, Verma V, Lin L, et al. Prospective study of proton-beam radiation therapy for limited-stage small cell lung cancer. Cancer. 2017;123(21):4244–4251. [DOI] [PubMed] [Google Scholar]
- 5. Mesko S, Gomez D. Proton therapy in non-small cell lung cancer. Curr Treat Options Oncol. 2018;19(12):76. [DOI] [PubMed] [Google Scholar]
- 6. Chang JY, Verma V, Li M, et al. Proton beam radiotherapy and concurrent chemotherapy for unresectable stage III non-small cell lung cancer: final results of a phase 2 study. JAMA Oncol. 2017;3(8):e172032. [DOI] [PMC free article] [PubMed] [Google Scholar]
- 7. Colaco RJ, Huh S, Nichols RC, et al. Dosimetric rationale and early experience at UFPTI of thoracic proton therapy and chemotherapy in limited-stage small cell lung cancer. Acta Oncol. 2013;52(3):506–513. [DOI] [PubMed] [Google Scholar]
- 8. Ono T, Nakamura T, Yamaguchi H, et al. Clinical results of proton beam therapy for elderly patients with non-small cell lung cancer. Radiat Oncol. 2018;13(1):19. [DOI] [PMC free article] [PubMed] [Google Scholar]
- 9. Hui Z, Zhang X, Starkschall G, et al. Effects of interfractional motion and anatomic changes on proton therapy dose distribution in lung cancer. Int J Radiat Oncol Biol Phys. 2008;72(5):1385–1395. [DOI] [PMC free article] [PubMed] [Google Scholar]
- 10. Cubillos-Mesías M, Baumann M, Troost EG, et al. Impact of robust treatment planning on single- and multi-field optimized plans for proton beam therapy of unilateral head and neck target volumes. Radiat Oncol. 2017;12(1):190. [DOI] [PMC free article] [PubMed] [Google Scholar]
- 11. Liu H, Chang JY. Proton therapy in clinical practice. Chin J Cancer. 2011;30(5):315–326. [DOI] [PMC free article] [PubMed] [Google Scholar]
- 12. McGowan SE, Burnet NG, Lomax AJ. Treatment planning optimisation in proton therapy. Br J Radiol. 2013;86(1021):20120288. [DOI] [PMC free article] [PubMed] [Google Scholar]
- 13. Schneider U, Pemler P, Besserer J, et al. The water equivalence of solid materials used for dosimetry with small proton beams. Med Phys. 2002;29(12):2946–2951. [DOI] [PubMed] [Google Scholar]
- 14. Zhang R, Newhauser WD. Calculation of water equivalent thickness of materials of arbitrary density, elemental composition and thickness in proton beam irradiation. Phys Med Biol. 2009;54(6):1383–1395. [DOI] [PMC free article] [PubMed] [Google Scholar]
- 15. Casares-Magaz O, Toftegaard J, Muren LP, et al. A method for selection of beam angles robust to intra-fractional motion in proton therapy of lung cancer. Acta Oncol. 2014;53(8):1058–1063. [DOI] [PubMed] [Google Scholar]
- 16. Matney JE, Park PC, Li H, et al. Perturbation of water-equivalent thickness as a surrogate for respiratory motion in proton therapy. J Appl Clin Med Phys. 2016;17(2):368–378. [DOI] [PMC free article] [PubMed] [Google Scholar]
- 17. Wang P, Yin L, Zhang Y, et al. Quantitative assessment of anatomical change using a virtual proton depth radiograph for adaptive head and neck proton therapy. J Appl Clin Med Phys. 2016;17(2):427–440. [DOI] [PMC free article] [PubMed] [Google Scholar]


