

Abstract
In this study, the structural properties of soot produced in diffusion flames are analyzed to elucidate the formation of mature aggregates from large young particles. Soot samples are generated in a laminar diffusion inverted gravity flame reactor (IGFR) operated on methane, ethane, and ethylene with Ar dilution to reduce the flame temperature. Soot produced in temperature ranges from 1495K-1568 K contains 100nm-300nm particles with (i) isotropic or (ii) multiple core structures, supporting a soot maturation pathway where one young soot particle evolves into a mature fractal aggregate via an internal nucleation route. During the process, these large amorphous particles can form internal voids as the particle loses mass due to pyrolysis or oxidation. Transmission electron microscopy (TEM) shows that young soot aggregates contain a higher fraction of shorter fringes and highly curved aromatics (11% vs. 23%), which is in agreement with their higher organic carbon content (3.3%-5.4% vs. 12.1%-28.8% wt.). Increasing the flame temperature reduces the curvature of polycyclic aromatic hydrocarbons (PAHs) and allows for more efficient layer stacking as indicated by a higher percent of stacked fringes. For these gaseous fuels, carbonization appears to be primarily a function of the flame temperature and independent of the fuel composition.
Graphical Abstract

1. Introduction
Combustion-generated particulate matter (PM) containing black carbon (BC) and brown carbon is a major component of air pollution with known health risks1 and adverse environmental impacts2. Several questions related to the formation and evolution of soot particles that dictate the physicochemical properties of PM remain a subject of scientific debate3. Particularly, insights into soot maturation and aggregation are needed to improve our understanding of the influence fuel composition and combustion conditions have on PM morphology and reactivity4–5. These insights can be used in the optimization of combustion systems to minimize adverse health and environmental effects.
The planar nature and inherent stability of aromatic compounds are linked to the formation of soot particles6–7. More than 100 polycyclic aromatic hydrocarbons (PAHs) cluster together to form liquid-like particles in flames with temperatures greater than 1350 K8. The size of PAHs in young soot has been approximated by molecular dynamics simulations to be between four rings (pyrene) and 19 rings (circumcoronene)9–10; this range agrees with PAH sizes observed by atomic force microscopy7. Young soot particles appear to be transparent and isotropic. A recent report shows that smaller PAHs may reside near the surface and larger PAHs cluster near the core11. While typically only planar PAHs are used in soot models, curved aromatics may play a significant role in soot formation due to higher kinetic growth rates12. Curved aromatics have a permanent dipole that can increase rigidity13.
After nucleation, young particles grow through surface growth and collisions with other young particles, leading to their coalescence and agglomeration. Coalescence is the merging of two particles into one, whereas during agglomeration the particles collide but keep their initial shape, creating a fractal structure. In computational models, particle critical diameter (5 nm to 35 nm)14 or characteristic times15 are used to determine a threshold for the transition from coalescence to agglomeration. The computational thresholds are typically tuned to match experimental results; however, previous work has shown that multiple processes related to soot growth and maturation can occur at the same time16. Furthermore, until recently17, computational models have not taken into account the internal organization of soot particles. Pyrolysis studies have shown that a graphitic shell forms on the periphery of mature soot particles in a range of temperatures between 1523 K and 1923 K 18. Experimental studies using thermophoretic probing show that, in diffusion flames, the shell forms as particles travel through temperature regions > 1500 K11, 19. Identifying the exact transition temperature in sooting flame conditions is challenging and likely cannot be assigned to a single value. Understanding the maturation process is critical because it affects particle absorption, emissivity, reflection, and is directly involved in the coalescence kinetics.
Reilly et al. 20 proposed an aggregate formation mechanism that is driven by the particle’s internal structure. The authors report the presence of large “PAH-containing” particles in laminar acetylene diffusion flames. These young soot particles, measured to be on the order of 0.5 microns to 1.0 micron, later evolved into mature soot aggregates. The mature soot aggregates were of similar size and largely depleted of PAH species. The authors concluded that young soot particles could form large unstructured aggregates and then transition to mature aggregates with multiple core-shell sites ~20 nm in diameter20. Other researchers have shown these large, liquid-like, particles without well-defined spherical primary particles exist inside the flame19 and can persist post-flame21. Further characterization of these large, unstructured particles and their transition to the multi-core soot aggregate can provide critical insight into the soot maturation process. The young soot can be produced in low-temperature flames below carbonization temperatures, which can be readily achieved in an inverted gravity flame rector (IGFR) operated with diluted fuels. This type of reactor design was first reported by Stipe et al.22 and has since been used to synthesize materials such as carbon and TiO2 aerosol gels23–24.
This work aims to provide experimental data on the transition of young soot to mature aggregates through the analysis of soot chemical composition and structure at different stages of their maturity. The combustion conditions in the IGFR are varied to evaluate the effects of dilution and temperature by (i) introducing Ar to the fuel stream and (ii) reagent preheating. The laminar diffusion flame is operated on methane, ethylene, and ethane with up to 90% Ar dilution by volume. Low-temperature flames yield particles 100 nm – 300 nm, each with an isotropic structure and a high fraction of curved PAHs. High-temperature flames produce aggregates with similar overall dimensions, composed of smaller (~20 nm) core-shell structures. The reduction in curved PAHs during carbonization is hypothesized to be a significant contributor in forming the core-shell structure.
2. Experimental
2.1. Experimental Design
Experimental work employs an IGFR operated with methane, ethylene, ethane, Ar, and air. The IGFR is constructed of a 150 mm long quartz tube enclosing concentric inlets 9.5 mm and 32.0 mm in diameter. The co-flow inlets are directed downwards, counteracting buoyant forces which increases residence time (τres) and flame stability at high dilutions. A fuel-Ar mixture, up to 90% by volume, is introduced through the inner inlet tube. Air is introduced through the outer annular section. Ethylene (Praxair 99.5%), ethane (Airgas 98.5%), and methane (Praxair 99.0%) are selected due to their different sooting propensities. The experimental conditions and flow rates are given in Table 1. Figure 1 shows ethane flame images with varied fuel dilution. Methane and ethylene flame images are shown in Figure S1. Flame images, taken at varied exposures to avoid image saturation, are used to find the location of the maximum soot radiation as described in the following section. The highest dilution ratio is determined by our ability to collect sufficient sample for analysis.
Table 1:
Experimental flow rates for the IGFR for flames operated on fuels diluted with Ar.
| CH4 | C2H4 | C2H6 | |||||||
|---|---|---|---|---|---|---|---|---|---|
| Flame | 1 | 2 | 3 | 4 | 5 | 6 | 7 | 8 | 9 |
| Fuel flow rate (slpm) | 0.24 | 0.24 | 0.24 | 0.12 | 0.12 | 0.12 | 0.12 | 0.12 | 0.12 |
| Air flow rate (slpm) | 2.72 | 2.72 | 2.72 | 2.72 | 2.72 | 2.72 | 2.72 | 2.72 | 2.72 |
| Ar Flow Rate (slpm) | 0 | 0.24 | 0.48 | 0 | 0.12 | 1.08 | 0 | 0.12 | 0.68 |
| Diution Percentage | 0.0 | 50.0 | 67.0 | 0.0 | 67.0 | 90.0 | 0.0 | 50.0 | 85.0 |
| Max Flame Temperature (K), Tmax | 1957 | 1898 | 1816 | 1968 | 1934 | 1746 | 1946 | 1918 | 1749 |
| Temperature at Max Radiation Location (K), T* | 1774 | 1734 | 1583 | 1901 | 1701 | 1508 | 1727 | 1672 | 1521 |
| Flame Length (mm) | 54 | 60 | 62 | 42 | 50 | 75 | 51 | 59 | 78 |
| Open Tip | Yes | Yes | No | Yes | Yes | No | Yes | Yes | No |
Figure 1.
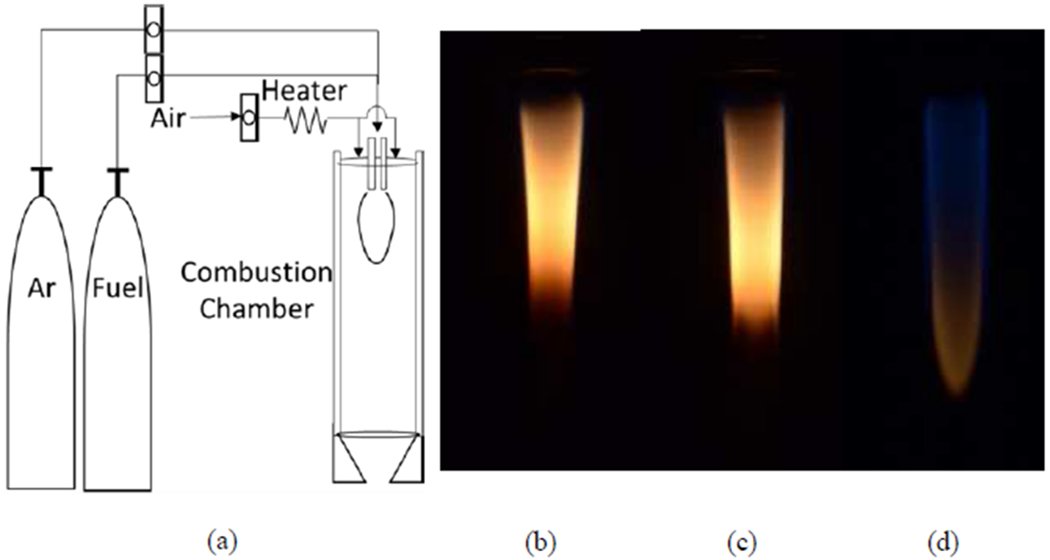
(a) IGFR schematic and ethane flames images with (b) Ar-0% vol, (c) Ar-50% vol, and (d) Ar-85% vol (captured with longer exposure). Dilution increases flame length and decreases luminosity due to a decrease in soot concentration. Higher dilution transitions the highest red luminosity point from the flame wing to the flame tip.
Soot is collected on a fiberglass filter (SterliTech 934-AH) at the reactor exit to ensure the collection does not disturb the flame structure. For the highest dilutions, the orange flame tip indicates the formation of soot; however, the total soot yields are significantly lower at these conditions. The lower flame radiation in the red region indicates the lack of particles with a carbonized shell, which increases emissivity5, 25. For these low sooting conditions, a secondary collection method was used. An Inconel probe 3.175 mm in diameter was placed at the tip of the flame, ~2.0 mm from the tip of the flame for 30 seconds. The probing did not change the flame structure. To verify that the sampling procedure did not influence the particle structure, i.e., did not quench particle carbonization, samples from a 75% diluted ethane flame were collected on the probe. These samples show a mature nanostructure, similar to the other lower dilution cases, see Figure S2. Similar flame probing has been used in previous studies that concluded that a carbonized shell forms before soot reaches the oxidation region11.
2.2. Flame Characterization
The flame structure and temperature play a critical role in the availability of gas-phase hydrocarbon species required for soot growth, condensation, coalescence, transport, carbonization, and aggregation rates9, 26. In the current study, the flame temperature is measured using an uncoated R-type thermocouple (bead diameter ~ 170 μm, wire diameter ~75 μm, measured with an optical microscope). A rapid thermocouple insertion technique was used to reduce soot deposition and temperature correction error27. An Arduino/bipolar motor system with a 1/400 revolution resolution positioned below the reactor controls the position of the thermocouple. Thermocouple exposure time in the flame is set at 2.5 seconds when the thermocouple is moved back into the sheath airflow. The process is repeated ten times to find the maximum temperature at a given axial location. Temperature measurements are recorded in 5.0 mm axial increments from the fuel inlet to the flame tip.
A radiation temperature correction is calculated using previously reported methods28–29. Heat loss by conduction via the thermocouple wire is neglected. The Nusselt number (Nu) is approximated as that of a sphere, thermal conductivity (k) is approximated using the linear relationship of k and T for air29, and emissivity (εTC) is the average of the two thermocouple wires28. Using these assumptions, flame temperature (Tflame) is approximated as:
| (1) |
where σ is the Stefan-Boltzman constant. Catalytic effects were neglected as the temperature is measured in the fuel-lean regions.
The downstream shift in the highest flame luminosity location, coupled with an elongated flame structure, shown in Figure 1, complicates temperature measurements for soot characterization. The maximum flame temperature is measured on the flame wing 10 mm to 20 mm (axially) from the inlet. However, in the high dilution flames, there is not red radiation in this location. Since luminosity in the red spectra depends on soot temperature and soot volume fraction (fv), the maximum flame temperature does not correspond to the environment relevant to soot maturation. Here, we characterize soot maturation by T* — the highest estimated soot temperature, i.e., the flame temperature at the location of the highest radiation. Images of each flame are captured, and the red layer of each image is processed to find the axial location with the highest luminosity, see Figure S1. Previous reports show that the maximum fv is located in the fuel-rich region of the diffusion flame front and can have a lower temperature than the flame front by 150 K to 300 K 29–31; thus, T* characterizes the upper temperature limit of soot exposure. The 67% dilution methane also includes a radial temperature correction (Tradial) to account for shift in the visible soot radiation region away from the flame front, as discussed in section 3.1. This estimate is most accurate for the highest dilution cases as the highest luminosity is at the tip of the flame where path lines are orthogonal to the flame front and the soot particles must travel through that temperature region before exiting the flame. These low-temperature flames with a closed tip structure are of the most interest to this work as they produce soot with a disordered structure.
2.3. Elemental and Organic Carbon Analysis
The C/H ratio of soot changes during carbonization32, i.e., a higher elemental carbon (EC) fraction correlates with mature soot. To examine this behavior in the IGFR, the soot samples collected on the filter were analyzed for EC and organic carbon (OC) content for each fuel and multiple dilutions. The analysis was performed at Sunset Laboratory Inc. using a thermo-optical method (NIOSH 5040)33.
2.4. HRTEM of Soot Particles
High-resolution transmission electron microscopy (HRTEM) analysis provides the direct observation of soot structure. Soot samples were suspended in ethanol and sonicated for 15 minutes before being pipetted onto a copper grid. The samples were imaged using a Tecnai G2 F20 Supertwin TEM. The TEM is operated at a 200kV accelerating voltage, 5 spot size, and 490kx magnification. The ‘high-resolution’ designation signifies the ability to resolve the soot nanostructure. For each fuel, the highest dilution case increased sample reactivity with the electron beam, likely due to beam-induced polymerization. Additional considerations in the analysis of high dilution samples were necessary, i.e., reducing the beam intensity avoided a foggy appearance of the image from sample-beam interaction. It has been previously reported that exposure to the electron beam can change the structural properties of young soot particles34. We conducted 20-minute tests, capturing an image every two minutes, for the highest dilution ethylene sample (isotropic particle). As seen in Figure S5, we observed discernable changes in the particle nanostructure, such as the formation of long fringes and stacking on the outer portion of the particles. The electron beam can induce a structural change that is only apparent in the high dilution cases that produce isotropic particles. To minimize electron beam influence, images are captured as soon as the particle is in-focus. All images are taken within the first 10 minutes of sample exposure to the electron beam. Here, three to seven HRTEM images for each sampling condition were analyzed to reduce uncertainty.
2.5. HRTEM Image Processing for Nanostructure Analysis
Sample interference with the electron beam reduces the number of transmitted electrons when operated in bright-field mode. Therefore, dark regions in the TEM image reveal the structural properties of a sample. To extract quantitative information related to soot structure from each image, an in-house MATLAB script is developed to process 8-bit grayscale images based on previous reports 35–36.
After the image processing, one-pixel-thick fringes remain. Each processed image is overlaid on the original image to ensure processing accuracy. Figure 2 shows examples of raw and processed images. An automated algorithm is used to measure the fringe length (FL), tortuosity, percent of stacked fringes (PSF), and the average separation distance between stacked fringes. The fringe length is computed based on the number of pixels in a given fringe. If the pixels are connected diagonally, the connection length is set to . The total number of pixels in a given fringe is multiplied by the pixel resolution to determine the fringe length. To reduce noise, all fringes shorter than two aromatic rings in length (0.483 nm) are removed. Tortuosity, a measure of fringe curvature, is computed as the fringe length divided by the Euclidean distance between the endpoints.
Figure 2.

Soot sample from the zero-dilution methane flame a) before and b) after processing. The processed image is used to obtain quantitative information from HRTEM images.
Special consideration is given to calculate the PSF. PAHs stack due to the overlapping of π orbitals, aligning graphitic layers in parallel orientation37. In previous work, fringes have been selected by hand to extract the separation distance35. We found that this method introduces user bias. To reduce uncertainties with measuring lattice spacing, we have automated the procedure. The algorithm labels a pair of fringes as stacked if they satisfy three conditions: the pair 1) forms a relative angle < 10 degrees, 2) are located within 0.80 nm, and 3) run parallel for a threshold distance set at 0.20 nm (parallel overlap threshold). The algorithm follows the following steps:
The script assigns each pixel on a given fringe an angle represented by the sum of the vector components for the five nearest pixels on the fringe. The use of vector components improves upon previous techniques where an angle was assigned to each pixel and then averaging the angles38.
The algorithm searches 0.8 nm perpendicular to each given pixel. If a neighboring fringe is found, the script checks if the angle between the fringes is less than 10 degrees.
If both criteria are met, the fringe pair is stored.
After running the algorithm for the entire region of interest (ROI), as long as two fringes are paired over 0.20 nm of fringe length, the fringes are considered stacked. If the fringes do not satisfy the conditions, they are recorded as non-stacked.
The parallel overlap threshold of 0.20 nm for stacked fringes is a free tuning parameter; a parameter test was performed where the 0.20 nm threshold is systematically reduced down to one pixel (~0.02 nm). Figure 3 and Figure S3 shows the effect of the parallel overlap threshold value on the PSF for ethylene for different fuel dilutions. Reducing the threshold from 0.20 nm to 0.02 nm increases the total PSF by 45% to 55%, though the overall trends in soot nanostructure remain similar for all threshold values. We choose to use the 0.20 nm threshold since the selectivity of erroneous stacked fringes decreases as the parallel overlap threshold increases to 0.20 nm, see Figure S3. Reducing the parallel overlap threshold to one pixel gives a PSF of 77% to 88%, similar to values for mature soot in previous reports that reported 70% to 75% PSF11.
Figure 3.
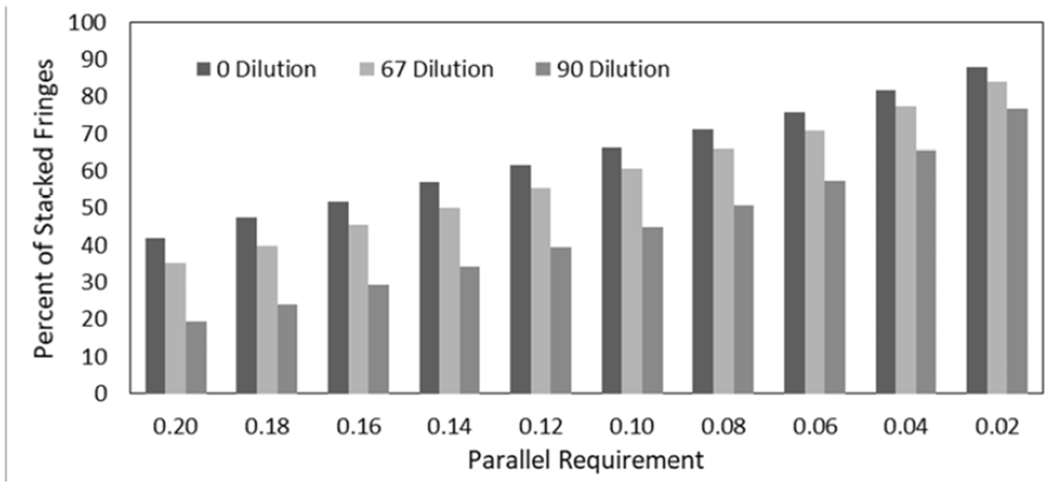
Parameter study to determine the effect of parallel overlap threshold length on the PSF. Increasing the threshold from one pixel (0.02nm ) to 0.20nm decreases the absolute PSF value linearly. Results are from 13 images of C2H4 soot from Figure S3.
The average separation distance between two stacked fringes is related to lattice spacing. For a graphitic crystal, lattice spacing is 0.335 nm39, the spacing of coronene stacks in soot particles have been reported in the range of 0.35 nm to 0.40 nm40. In our initial analysis, the maximum lattice spacing was limited to 0.6 nm, similar to previous reports34–35. However, as shown in Figure 4, a secondary peak exists beyond the 0.6nm threshold. This second peak skews the lattice spacing distribution to the right40–41. The second peak is attributed to the stacking of multiple planes in the crystal structure. Fitting the lattice spacing histogram with two Gaussian PDFs reduces the influence of multiple stacked planes on the reported lattice spacing parameters. Here we report the lattice spacing at the center of the first peak. We cannot definitively say that spacing compression takes place in the multiple layers stacking scenarios, such as spacing between two adjacent layers, e.g., 1st and 2nd or 2nd and 3rd, are similar.
Figure 4.

Fringe spacing distribution for the zero dilution ethane flame. A secondary peak indicated multiple stacked layers. When the stacking distance threshold is > 0.60nm, a second peak appears within the set fringe separation measurements. The height of the second peak is 10% to 30% of the primary peak.
3. Results and Discussion
3.1. Flame Temperature and Soot Composition
Figure 5 shows the flame front temperature corresponding to the highest flame luminosity (T*) for methane, ethylene, and ethane flames as a function of fuel dilution with Ar. As discussed in section 2.2, T* ranges for the zero and intermediate dilution flames are likely to be higher than the actual soot temperature due to the high-temperature gradient in the flame front. In the highest dilution ethylene and ethane flames, T* is measured at the flame tip and is a good indicator of the maximum soot temperature. At the highest dilutions, T* is measured as 1500K-15400 K for ethylene and 1495K-1568 K for ethane. The soot produced in the closed-tip flames travels through the tip instead of exiting from the wing as in the lower dilution cases. The temperature range presented here represents uncertainty in the axial flame location42. For nearly all flames, the maximum soot luminosity region was observed in close proximity to the temperature measurement location in the radial direction. However, for high dilution methane flames, the highest soot radiation region shifts away from the flame front. Among analyzed samples, the 67% dilution methane case is the only flame that exhibits a 1.8 mm wide blue sheath on the perimeter of the flame. Previous reports on methane-air diffusion flame also indicate that the temperature from the wing to the maximum soot volume fraction at a given height can decrease 150K–300K30–31. In this work, the thermocouple measurements did not allow for accurate radial temperature resolution, thus we incorporated a 200K radial correction for the 67% diluted methane case yielding a T* = 1509K–1637K. The temperature at the tip of the 67% methane flame ranges from 1590K to 1489K (52mm to 61mm below the fuel nozzle), similar to the temperature range from the radial correction. Thus, the maximum soot carbonization region temperature is in the 1509K-1637K, as shown in Figure 5. The radial correction for other flames is not required as they do not exhibit a blue sheath.
Figure 5.
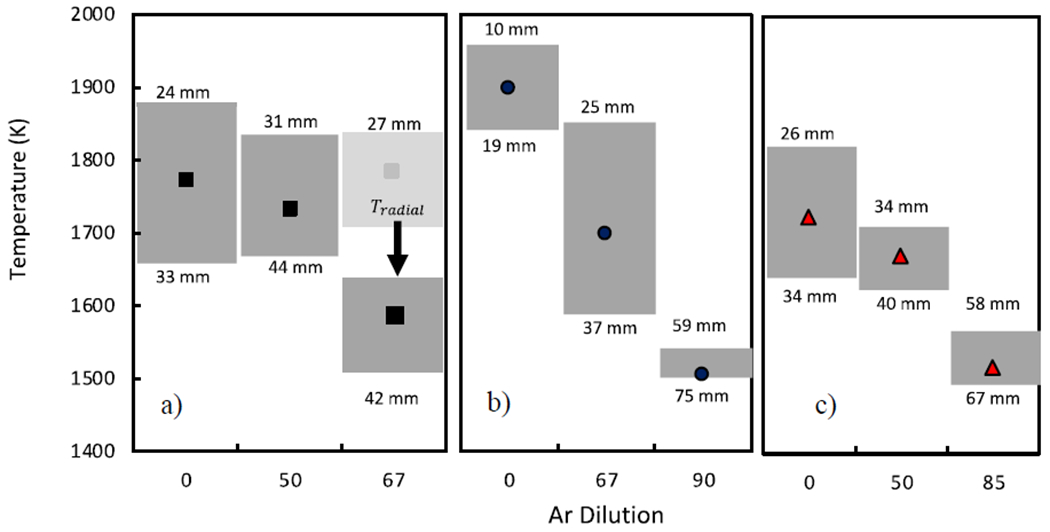
Highest soot luminosity flame temperature for a) methane, b) ethylene, and c) ethane for different fuel dilution ratios. The points correspond to the highest luminosity and the ranges correspond to the range of the axial location with the high flame radiation below the fuel nozzle. In the highest dilution methane flame, the T* requires a radial temperature correction due to the blue flame front.
Figure 6 shows the soot OC measurements as a function of fuel dilution. The total OC fraction for non-diluted flames is 3.3% to 5.4%. This low OC content is expected for the particles with a mature core-shell structure43. Dilution increases the OC content of the methane and ethane samples to 28.8% and 26.1%, respectively. For the ethylene flame at 90% dilution, the OC content is measured at 12.1% of the total sample mass. The gradual increase in OC with dilution means either (i) soot maturation does not have a well-defined threshold and occurs over a range of conditions, or (ii) a soot formation shifts to the colder region of the flame, i.e., a higher fraction of soot is produced along the axis, away from the high-temperature flame wing (seen with developing flame tip). To test the latter, it is possible to operate the IGFR at higher dilutions (lower temperatures). However, these conditions do not yield a sufficient soot sample for EC/OC analysis even after eight hours of collection. These flames are entirely blue and do not emit in the red region, suggesting that no carbonized soot is present in the flame.
Figure 6.

OC mass fraction in collected soot particles measured offsite shows an increase with dilution. The presence of OC indicates soot in the high dilution flames has not undergone carbonization.
3.2. HRTEM- Dilution Influence on Nanostructure
Qualitative differences between soot from the low dilution and high dilution flames are apparent by the presence and absence of graphitic shells. Figure 7 shows that for all fuels, the flames without dilution produce soot aggregates with a structured shell surrounding cores ~5.0 nm in diameter. The core-shell structure is an indicator of a mature soot particle. Formation of these particles is associated with the IGFR flames that exhibit high radiation intensity on the flame wing, corresponding to the higher values of T*.
Figure 7.

HRTEM images for no fuel dilution flames a) methane, b) ethylene, and c) ethane. All three fuels yield mature core-shell particle nanostructure. White arrows point to the shell on the periphery of the particles; colored arrows point to the unstructured core.
In the intermediate dilution flames, the graphitic shell is still present, see Figure 8. However, there are indications of reduced structure, such as larger core radii and the appearance of particles with multiple cores. These observations align with the OC measurements, showing that the soot at these intermediate dilutions has an increased OC fraction. In the intermediate dilution cases, T* = 1624K-1851K. The GC-MS and EEM fluorescent analyses of the samples produced at these conditions do not show significantly different chemical composition from the zero dilution cases44.
Figure 8.

HRTEM images for intermediate dilution, a) methane – 50%, b) ethylene – 67%, and c) ethane – 50%. Particles have a structured graphitic shell. White arrows point to the shell on the periphery of the particles; colored arrows point to the unstructured core.
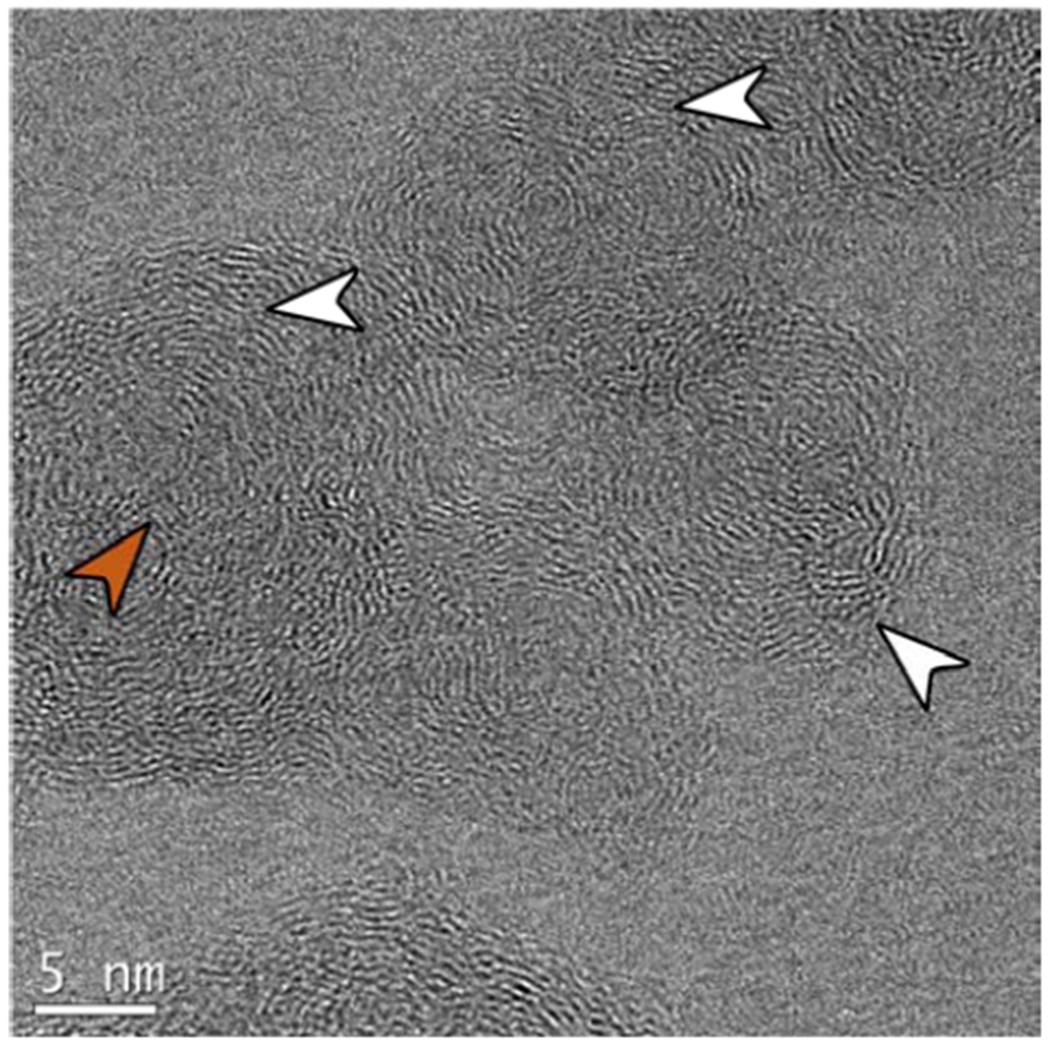
For the highest dilution flames, the core-shell structure is not present; the aggregates display two types of nanostructures. The first type is an isotropic particle shown in Figure 9 (a–c). These particles have a similar nanostructure to nascent soot particles before they reach the high-temperature flame front, i.e., prior to carbonization45. The observation also aligns with the aggregation formation mechanism proposed by Reilly et al. due to the presence of large young particles20. The second structure observed in the low-temperature ethylene and ethane flames show multiple internal cores ~5.0 nm in diameter, see Figure 9 (e, d). Similar structures have been observed in the high temperature, low residence time pyrolysis study in the absence of oxygen by Vander Wal and Tomasek, in which the structures were described as ‘curved’ nanostructures18. Reilly et al. have proposed that multiple nucleation sites form in the large “PAH-containing” particles20. In our experiments, the OC fraction of these samples is between 12% and 29% (see Figure 6). Additionally, the PAH analysis reported by Mahamuni et al. for the same set of samples shows that these low-temperature conditions yield soot particles with high concentrations of PAHs with molecular weights from 202-302 amu44. It is possible that the small spherical crystal sites represent an intermediate structure between the isotropic particle and the core-shell structure aggregate. The spherical crystal sites nucleate inside a larger liquid-like particle (100 nm to 300 nm) and then facilitate the transition into the mature aggregates with core-shell particles that have an overall dimension similar to the parent particle, as shown later (see Figure 13). During the particle maturation, the amorphous particle shrinks, often forming internal voids (Figure 9e), due to the loss of the volatile species by pyrolysis. The remaining carbon organizes into the graphitic shells associated with mature core-shell structures.
Figure 9.
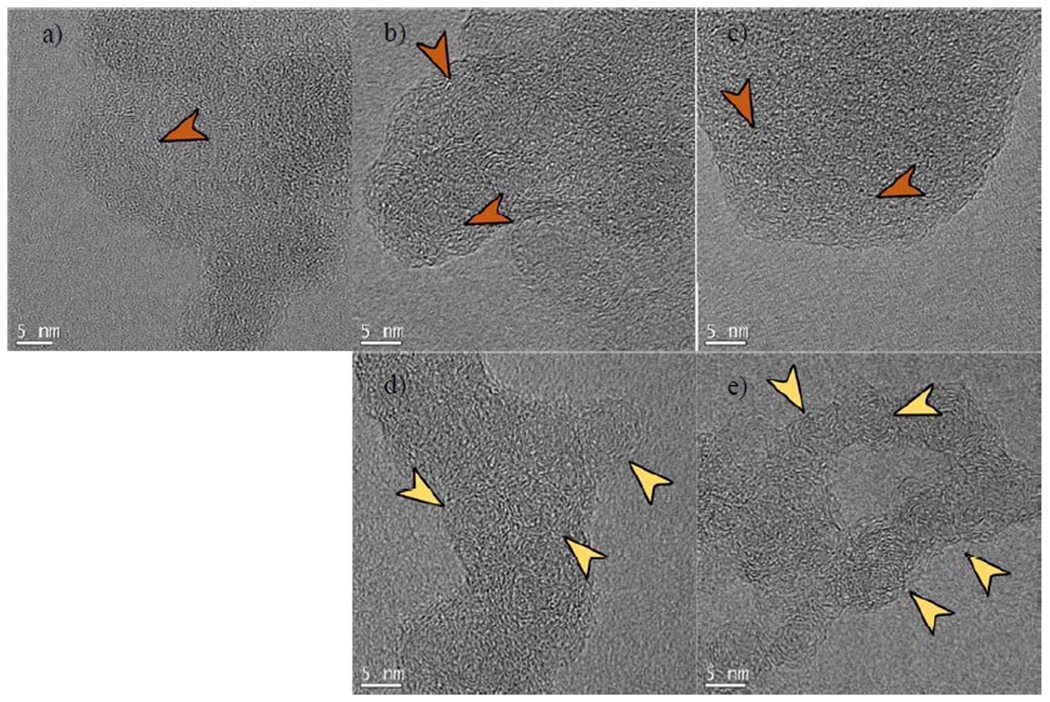
Highest dilution flames, (a) methane – 67%, (b) ethylene – 90%, and (c) ethane flames – 85%, do not create a graphitic shell. Flame temperatures range from 1495 K to 1568 K. For ethane and ethylene, these flames also produce multi-core particles (core diameter ~5 nm) without shell structure for (d) ethylene and (e) ethane flames. Orange arrows point to the unstructured portions of the particles, the yellow arrows point to ~5 nm domains. (A colour version of this figure can be viewed online.)
Figure 13.

Evidence for the soot carbonization mechanism based on internal nucleation. The high dilution and lower temperature flames produce soot particles without a well-defined core-shell structure, shown at 50k x magnification, similar to PAH-containing particles described by Reilly et al20. The soot particle exposed to high temperatures (right column) exhibits a mature soot aggregate structure. HRTEM images at 490k x magnification (middle row center) show the presence of 5 nm crystal nuclei inside of these low-temperature particles.
Another possible explanation for the 5 nm domains is the oxidation of the young soot particles 46. In our high dilution flames, the young soot aggregates reach the flame front, where they can be rapidly oxidized. Because the highest dilution flame has both a lower flame temperature and a closed tip, the young particles travel through an oxidative environment. The void shown in Figure 9e is similar to the proposed internal oxidation mechanism 47. These smaller domains do not have an unstructured core pointing to the role of internal oxidation 48.
The T* range that corresponds to the formation of these spherical crystal sites can be correlated to soot maturation thresholds. In our experiments, the T* values associated with this transition are 1637K for methane, 1540K for ethylene, and 1568K for ethane. These temperatures agree with previously reported soot carbonization temperatures of 1495K 19 and >1523K18. However, the distinction of carbonization vs. formation of the initial crystal site in the parent aggregate is debatable as these samples contain up to 30% OC, indicating high amounts of bound hydrogen. Furthermore, in comparing these thresholds, one needs to recognize uncertainty in the thermocouple temperature measurements. As discussed above, the temperatures in this analysis correspond to the flame temperature in the vicinity of maximum radiation and not the soot temperature itself.
To verify that the shell formation is the result of temperature and not dilution, we performed limited experiments where the reagents entering the IGFR were preheated. The heating tape was wrapped around the inlet manifold and an inline thermocouple measured inlet air temperature. For the highest dilution condition for ethane (85%), the temperature of the fuel and air stream at the nozzle was measured at 498 K with an inline k type thermocouple42. The preheated ethane flame had higher radiation compared to the non-preheated flame at the same dilution. Figure 10 shows an HRTEM image; a core-shell structure is formed under the high dilution conditions, indicating the dominant role of T* on soot maturation.
Figure 10.
Ethane soot at 85% Ar dilution with 498 K inlet temperature. The preheat increases flame temperature, resulting in core-shell formation. White arrows point to the shell on the periphery of the particles; colored arrows point to the unstructured core.
Nanostructure measurements provide further insight into differences between the molecular components of the structured and unstructured soot particles. The complete set of HRTEM images used for analysis is given in Figure S4. Table 2 shows the mean nanostructure measurements for all dilutions; these follow the general trends. (1) For methane, ethylene, and ethane, at the highest dilution, the average fringe length decreases (compared to no-dilution cases) by 0.13 nm, 0.02 nm, and 0.11 nm, respectively. This decrease in fringe length agrees with reports that PAHs’ conjugation length increases during carbonization49. (2) For methane, ethylene, and ethane, the mean tortuosity increases with dilution by 0.09, 0.04, and 0.05, respectively. Tortuosity is a representation of impurities in the graphene-like sheet, where five-membered rings or oxygen and nitrogen interstitials increase the curvature of a molecule37. Higher temperature flames increase carbonization and produce PAHs with higher planarity. (3) For methane, ethylene, and ethane, the PSF decreases with dilution by 18.8%, 15.9%, and 16.5%, respectively. The gradual decrease in PSF and changes in OC fraction with dilution suggests that the soot maturation process does not occur instantaneously at a given threshold condition, but instead, carbonization is a complex process that occurs in the temperature range. In our experiment, the onset of carbonization temperature is ~1540 K for ethylene and ~1568K for ethane. Figure 11 shows that the OC content is well correlated with PSF measurements for all fuels tested.
Table 2.
Average nanostructure measurements for nine flames from HRTEM image analysis.
| Methane No Dilution | Methane 50 Dilution | Methane 67 Dilution | Ethylene No Dilutions | Ethylene 67 Dilutions | Ethylene 90 Dilution | Ethane No Dilution | Ethane 50 Dilution | Ethane 85 Dilution | |
|---|---|---|---|---|---|---|---|---|---|
| FL (nm) | 0.98 | 0.90 | 0.85 | 0.91 | 0.90 | 0.89 | 0.99 | 0.89 | 0.88 |
| Tortuosity | 1.21 | 1.24 | 1.30 | 1.20 | 1.21 | 1.24 | 1.20 | 1.22 | 1.25 |
| Highly Curved (%, T > 1.3) | 14.8 | 20.1 | 32.9 | 13.3 | 13.8 | 19.7 | 10.8 | 16.3 | 22.7 |
| Lattice Spacing (nm) | 0.39 | 0.39 | 0.41 | 0.39 | 0.39 | 0.39 | 0.37 | 0.38 | 0.40 |
| PSF (%) | 37.2 | 26.3 | 18.4 | 41.7 | 34.0 | 25.8 | 40.6 | 31.0 | 24.1 |
| Aromatic rings | 25 | 21 | 17 | 22 | 21 | 21 | 29 | 22 | 19 |
| Optical Band gap (eV) | 1.70 | 1.80 | 1.94 | 1.79 | 1.80 | 1.81 | 1.63 | 1.78 | 1.86 |
| Processed Images # | 5 | 3 | 4 | 4 | 6 | 7 | 3 | 4 | 6 |
Figure 11.

Organic carbon content as a function of the PSF in young and mature particles. Soot nanostructure is a good indicator of OC independent of fuel.
The lattice spacing is in the range of 0.37 nm and 0.41 nm, for both young and mature soot, which is similar to previous reports (range between 0.38 nm and 0.40 nm)50. Though some previous literature suggests that young soot particles have larger lattice spacing25, 45, 51, in our analysis, we find only minor differences in the lattice spacing between the young and mature soot, i.e., for ethane combustion, the lattice spacing is 0.39 nm for mature soot and 0.41 nm for young soot, see Table 2. Note that in this study we have optimized the lattice spacing measurement technique by including a larger parameter space and automating the process. The constant lattice spacing, regardless of flame temperature, suggests that graphitic layer assembly in the young and mature particles is similar.
Figure 12 splits up the stacked portions of each sample and the non-stacked portions of each sample by fringe length and tortuosity. Regardless of flame temperature, structured fringes of particles are similar. For all fuels and dilutions, the stacked fringes are on average 0.3 nm longer and have a tortuosity value 0.05 lower, suggesting that an increase in planarity and a higher number of π orbitals are conducive to fringe stacking. The higher temperatures enable this transition via hydrogen atom abstraction as indicated by lower OC fraction.
Figure 12.

Fringe length and tortuosity for diluted methane, ethylene, and ethane flames. Red boxes represent stacked fringes and black boxes represent non-stacked fringes. Regardless of fuel, stacked fringes are longer and have a lower tortuosity in comparison to non-stacked fringes.
3.3. Optical Gap Analysis
HRTEM measurements are used to approximate the optical band gap (). A greater conjugation length of organic materials decreases the energy difference between the HOMO and LUMO bands; therefore, larger aromatics have a smaller 52. Previous work has approximated the of soot particles using Tauc analysis of PAHs between 4-24 rings 52–53 using the linear relationship:
| (2) |
where M is the number of aromatic rings approximated as . The given in Table 2 is larger for less structured particles by 0.24 eV to 0.02 eV. This preliminary result needs further investigation, given that computational modeling suggests that varies significantly for similar-sized PAHs that comprise soot particles54.
3.4. Soot maturity and shell formation discussion
Reilly et al. observed that large young soot particles (~500 nm) exist in the fuel-rich regions of the flame [reilly]. Their overall dimensions of carbonized aggregates were also in the same size range. The authors proposed that during carbonization, small crystal sites formed inside of young soot particles. These sites increase the fractal character of the soot particles and form the aggregate structure with multiple core-shell sites where the overall dimensions of the mature fractal aggregates are similar to the parent particle19–20. Evidence for this transition was based on particle size and PAH composition; the nanostructures of these particles were not reported. In this study, we analyze the internal particle structure transition over the range of flame temperatures. The analysis includes measurements of tortuosity, fringe length, PSF, and OC fraction to characterize the soot maturation mechanism.
Figure 13 illustrates the different stages of particle maturity before and after carbonization. The young soot particle at 50kx magnification has dimensions of ~300 nm. The aggregate structure differs from the young soot particles described by Kholghy et al.19, where a liquid particle with solid nuclei can spread on the surface due to impaction with the TEM grid and appear transparent compared to the solid nuclei. Young aggregates collected in our experiments are similar to young, irregularly shaped aggregates from post flame that have undergone some degree of carbonization, as reported by Blevins et al.21 Unlike the mature aggregate with well-defined core-shell sites, the young particle does not have well-defined spherical primary particles19, 55. Furthermore, the 490kx magnification images of the young and mature soot reveal that the mature particle contains a core-shell structure while the young particle does not. These young particles exhibit two different structures: (i) large isotropic regions and (ii) large particles with multiple 5 nm domains. In the authors’ opinion, these 5 nm domains are the developing crystal sites that indicate the incipient transition from non-structured (liquid-like particles) to mature soot aggregates by the internal nucleation route.
The most important factor in soot carbonization is the outgassing of hydrogen and other volatile species driven by pyrolysis or oxidation. Low-temperature combustion produces particles with high OC content 43. The C/H ratio increases for higher flame temperatures. Reduction in the hydrogen content plays two key roles: (i) increases the number of π-π bonds and (ii) reduces PAH curvature. Both effects increase PAH stacking by making the PAHs more polarizable and geometrically uniform; two PAHs with similar geometries are more likely to fit together than PAHs with dissimilar geometries. We observed lower stacking of curved PAHs for all fuels and dilutions, despite their higher dipole moment and the potential for the increased stacking of similarly-curved PAHs, see Figure 12 37. The higher planarity reduces steric hindrance and allows the PAHs to stack56. The range of transition temperature is measured to be at 1500K-1540K for ethylene and 1495K-1568K for ethane. In the methane experiments, the range of temperature is harder to determine due to the radial correction of the highest soot luminosity region; it was estimated to be 1509K-1637K, after a 200K radial correction. This radial correction can be 150K-300K29–31, which would change the estimate. The temperature range for all three fuels is in agreement with previous reports that have measured the transition temperature to be ~1495 K for liquid fuels19 and >1523 K for unsaturated and aromatic fuels18. Higher temperatures or longer τres likely provides the energy required for the small domains to develop into the graphitic shells.
4. Conclusions
IGFR flames operated on three fuels with Ar dilution were used to generate combustion samples in flame temperatures from 1495K-1968K. At the highest dilution (lowest temperature) conditions, large young particles were observed exiting the flame for all three fuels. The nanostructure analysis using HRTEM images measured the graphitic fringe curvature, length, percent of stacked fringes, lattice spacing, and optical bandgap to characterize the soot maturation process. Along with a lower OC fraction, soot from higher temperature flames exhibit a mature fractal structure. Differences between flame conditions and soot properties are summarized as follows:
Low-temperature flames: Tmax ~1746 K – 1816 K, (T*~1495 K – 1637 K), produce large amorphous particles with OC content 12.0 % to 29.0% wt., short fringe length ~0.85 nm to 0.89 nm, high fringe tortuosity 1.24 to 1.30, and low PSF 18.0 % to 25.8%.
High-temperature flames: Tmax~1946 K – 1968 K (T*~1727 K - 1960 K), produce structured aggregates with OC content 2.8 % to 6.0% wt., long fringe length ~0.91 nm to 0.99 nm, low fringe tortuosity 1.20 to 1.21, and high PSF 37.2% to 41.7%.
The observation of crystal sites inside of young soot aggregates provides evidence for a single young soot particle maturating to a final fractal aggregate via the internal nucleation route. A decrease in PAH curvature and increase in PAH conjugation length at high T* allow PAHs to stack more efficiently to form graphitic structures, whereas highly curved PAHs need to find a similar geometric fringe to initiate stacking. The layer spacing in samples remained in the range of 0.37 nm - 0.41 nm, independent of flame conditions. The aggregate structure during the maturation process changes due to the outgassing or oxidation of hydrogen and/or volatile hydrogen-rich species indicated by an increase of the C/H ratio at the higher flame temperatures. The large young aggregate carbonizes by forming multiple structured 5 nm cores that grow into individual primary particles in the mature aggregate with core-shell structure. During the process, the unstructured particle reduces in volume, often forming the internal voids, as the particle loses mass due to pyrolysis or oxidation.
Though this work characterizes the temperature effect in simple laminar diffusion flames, generally, in any flame, the curved PAHs that form young soot particles will transition to graphitic structures forming mature soot aggregates, i.e., black carbon. In our experiment, the lower temperature samples also exhibit a brown color, which is characterized by high OC fraction, often found in low-temperature flames, such as biomass combustion due to the lower heating value of the fuel (high moisture content) and the complex (endothermic) surface chemistry reaction. The increase in particle structure is the key to a reduction in particle reactivity, changes in particle optical properties, and reduction in the active sites on the soot surface. The current work can aid modeling efforts in soot formation, guide the design of combustion systems, and estimate environmental and health effects based on the reactivity of combustion generated particulate matter.
Supplementary Material
Acknowledgments:
This work was partially supported by the National Institutes of Health (grant numbers: NIBIB U01 EB021923, NIBIB R42ES026532 subcontract to UW). Part of this work was conducted at the Molecular Analysis Facility, a National Nanotechnology Coordinated Infrastructure site at the University of Washington which is supported in part by the National Science Foundation (grant ECC-1542101), the University of Washington, the Molecular Engineering & Sciences Institute, and the Clean Energy Institute.
Footnotes
Publisher's Disclaimer: This is a PDF file of an unedited manuscript that has been accepted for publication. As a service to our customers we are providing this early version of the manuscript. The manuscript will undergo copyediting, typesetting, and review of the resulting proof before it is published in its final form. Please note that during the production process errors may be discovered which could affect the content, and all legal disclaimers that apply to the journal pertain.
The authors have no conflict of interest to declare.
References:
- 1.Peters A; Veronesi B; Calderón-Garcidueñas L; Gehr P; Chen LC; Geiser M; Reed W; Rothen-Rutishauser B; Schürch S; Schulz H, Translocation and potential neurological effects of fine and ultrafine particles a critical update. Particle and fibre toxicology 2006, 3 (1), 13. [DOI] [PMC free article] [PubMed] [Google Scholar]
- 2.Fuzzi S; Baltensperger U; Carslaw K; Decesari S; Denier Van Der Gon H; Facchini M; Fowler D; Koren I; Langford B; Lohmann U, Particulate matter, air quality and climate: lessons learned and future needs. Atmospheric chemistry and physics 2015, 15 (14), 8217–8299. [Google Scholar]
- 3.Jung Y; Bae C, Immaturity of soot particles in exhaust gas for low temperature diesel combustion in a direct injection compression ignition engine. Fuel 2015, 161, 312–322. [Google Scholar]
- 4.Yehliu K; Vander Wal RL; Armas O; Boehman AL, Impact of fuel formulation on the nanostructure and reactivity of diesel soot. Combustion and Flame 2012, 159 (12), 3597–3606. [Google Scholar]
- 5.Alfè M; Apicella B; Barbella R; Rouzaud J-N; Tregrossi A; Ciajolo A, Structure-property relationship in nanostructures of young and mature soot in premixed flames. Proceedings of the Combustion Institute 2009, 32 (1), 697–704. [Google Scholar]
- 6.Stein SE; Fahr A, High-temperature stabilities of hydrocarbons. The Journal of Physical Chemistry 1985, 89 (17), 3714–3725. [Google Scholar]
- 7.Commodo M; Kaiser K; De Falco G; Minutolo P; Schulz F; D’Anna A; Gross L, On the early stages of soot formation: Molecular structure elucidation by high-resolution atomic force microscopy. Combustion and Flame 2019, 205, 154–164. [Google Scholar]
- 8.Dobbins RA, Soot inception temperature and the carbonization rate of precursor particles. Combustion and Flame 2002, 130 (3), 204–214. [Google Scholar]
- 9.Chen D; Akroyd J; Mosbach S; Opalka D; Kraft M, Solid–liquid transitions in homogenous ovalene, hexabenzocoronene and circumcoronene clusters: A molecular dynamics study. Combustion and Flame 2015, 162 (2), 486–495. [Google Scholar]
- 10.Aubagnac-Karkar D; El Bakali A; Desgroux P, Soot particles inception and PAH condensation modelling applied in a soot model utilizing a sectional method. COMBUSTION AND FLAME 2018, 189, 190–206. [Google Scholar]
- 11.Botero ML; Sheng Y; Akroyd J; Martin J; Dreyer JA; Yang W; Kraft M, Internal structure of soot particles in a diffusion flame. Carbon 2019, 141, 635–642. [Google Scholar]
- 12.Raj A, Structural effects on the growth of large polycyclic aromatic hydrocarbons by C2H2. Combustion and Flame 2019, 204, 331–340. [Google Scholar]
- 13.Martin JW; Menon A; Lao CT; Akroyd J; Kraft M, Dynamic polarity of curved aromatic soot precursors. Combustion and Flame 2019, 206, 150–157. [Google Scholar]
- 14.Saffaripour M; Veshkini A; Kholghy M; Thomson MJ, Experimental investigation and detailed modeling of soot aggregate formation and size distribution in laminar coflow diffusion flames of Jet A-1, a synthetic kerosene, and n-decane. Combustion and Flame 2014, 161 (3), 848–863. [Google Scholar]
- 15.Sirignano M; Kent J; D’Anna A, Modeling formation and oxidation of soot in nonpremixed flames. Energy & Fuels 2013, 27 (4), 2303–2315. [Google Scholar]
- 16.Mitchell P; Frenklach M In Monte Carlo simulation of soot aggregation with simultaneous surface growth-why primary particles appear spherical, Symposium (International) on Combustion, Elsevier: 1998; pp 1507–1514. [Google Scholar]
- 17.Kholghy MR; Veshkini A; Thomson MJ, The core-shell internal nanostructure of soot-A criterion to model soot maturity. Carbon 2016, 100, 508–536. [Google Scholar]
- 18.Vander Wal RL; Tomasek AJ, Soot nanostructure: dependence upon synthesis conditions. Combustion and Flame 2004, 136 (1–2), 129–140. [Google Scholar]
- 19.Kholghy M; Saffaripour M; Yip C; Thomson MJ, The evolution of soot morphology in a laminar coflow diffusion flame of a surrogate for Jet A-1. Combustion and Flame 2013, 160 (10), 2119–2130. [Google Scholar]
- 20.Reilly P; Gieray R; Whitten W; Ramsey J, Direct observation of the evolution of the soot carbonization process in an acetylene diffusion flame via real-time aerosol mass spectrometry. Combustion and flame 2000, 122 (1-2), 90–104. [Google Scholar]
- 21.Blevins LG; Fletcher RA; Benner BA; Steel EB; Mulholland GW, The existence of young soot in the exhaust of inverse diffusion flames. Proceedings of the Combustion Institute 2002, 29 (2), 2325–2333. [Google Scholar]
- 22.Stipe CB; Higgins BS; Lucas D; Koshland CP; Sawyer RF, Inverted co-flow diffusion flame for producing soot. Review of scientific instruments 2005, 76 (2), 023908. [Google Scholar]
- 23.Chakrabarty RK; Novosselov IV; Beres ND; Moosmüller H; Sorensen CM; Stipe CB, Trapping and aerogelation of nanoparticles in negative gravity hydrocarbon flames. Applied Physics Letters 2014, 104 (24), 243103. [Google Scholar]
- 24.Liu P; Arnold IJ; Wang Y; Yu Y; Fang J; Biswas P; Chakrabarty RK, Synthesis of titanium dioxide aerosol gels in a buoyancy-opposed flame reactor. Aerosol Science and Technology 2015, 49 (12), 1232–1241. [Google Scholar]
- 25.Toth P; Jacobsson D; Ek M; Wiinikka H, Real-time, in situ, atomic scale observation of soot oxidation. Carbon 2019, 145, 149–160. [Google Scholar]
- 26.Bowal K; Martin JW; Kraft M, Partitioning of polycyclic aromatic hydrocarbons in heterogeneous clusters. Carbon 2019, 143, 247–256. [Google Scholar]
- 27.Hindasageri V; Vedula R; Prabhu S, Thermocouple error correction for measuring the flame temperature with determination of emissivity and heat transfer coefficient. Review of Scientific Instruments 2013, 84 (2), 024902. [DOI] [PubMed] [Google Scholar]
- 28.Shaddix CR Correcting thermocouple measurements for radiation loss: a critical review; Sandia National Labs., Livermore, CA (US): 1999. [Google Scholar]
- 29.Kholghy MR; Afarin Y; Sediako AD; Barba J; Lapuerta M; Chu C; Weingarten J; Borshanpour B; Chernov V; Thomson MJ, Comparison of multiple diagnostic techniques to study soot formation and morphology in a diffusion flame. Combustion and Flame 2017, 176, 567–583. [Google Scholar]
- 30.Liu F; Guo H; Smallwood GJ, Effects of radiation model on the modeling of a laminar coflow methane/air diffusion flame. Combustion and Flame 2004, 138 (1-2), 136–154. [Google Scholar]
- 31.Smooke M; McEnally C; Pfefferle L; Hall R; Colket M, Computational and experimental study of soot formation in a coflow, laminar diffusion flame. Combustion and Flame 1999, 117 (1), 117–139. [Google Scholar]
- 32.Russo C; Apicella B; Lighty J; Ciajolo A; Tregrossi A, Optical properties of organic carbon and soot produced in an inverse diffusion flame. Carbon 2017, 124, 372–379. [Google Scholar]
- 33.Birch M; Cary R, Elemental carbon-based method for monitoring occupational exposures to particulate diesel exhaust. Aerosol Science and Technology 1996, 25 (3), 221–241. [DOI] [PubMed] [Google Scholar]
- 34.Wan K; Chen D; Wang H, On imaging nascent soot by transmission electron microscopy. Combustion and Flame 2018, 198, 260–266. [Google Scholar]
- 35.Yehliu K; Vander Wal RL; Boehman AL, Development of an HRTEM image analysis method to quantify carbon nanostructure. Combustion and Flame 2011, 158 (9), 1837–1851. [Google Scholar]
- 36.Botero ML; Adkins EM; González-Calera S; Miller H; Kraft M, PAH structure analysis of soot in a non-premixed flame using high-resolution transmission electron microscopy and optical band gap analysis. Combustion and Flame 2016, 164, 250–258. [Google Scholar]
- 37.Sygula A; Saebø S, π-π Stacking of curved carbon networks: The corannulene dimer. International Journal of Quantum Chemistry 2009, 109 (1), 65–72. [Google Scholar]
- 38.Davis J; Tiwari K; Novosselov I, Soot morphology and nanostructure in complex flame flow patterns via secondary particle surface growth. Fuel 2019, 245, 447–457. [DOI] [PMC free article] [PubMed] [Google Scholar]
- 39.Vander Wal RL; Bryg VM; Hays MD, Fingerprinting soot (towards source identification): Physical structure and chemical composition. Journal of Aerosol Science 2010, 41 (1), 108–117. [Google Scholar]
- 40.Wang CS; Bartelt NC; Ragan R; Thürmer K, Revealing the molecular structure of soot precursors. Carbon 2018, 129, 537–542. [Google Scholar]
- 41.Pascazio L; Sirignano M; D’Anna A, Simulating the morphology of clusters of polycyclic aromatic hydrocarbons: The influence of the intermolecular potential. Combustion and Flame 2017, 185, 53–62. [Google Scholar]
- 42.Molnar E Effects of Temperature and Fuel Dilution on Soot Yields in an Inverted Gravity Flame Reactor. Master of Science in Engineering, Univiersity of Washington, Seattle, WA, 2019. [Google Scholar]
- 43.Russo C; Apicella B; Lighty JS; Ciajolo A; Tregrossi A, Optical properties of organic carbon and soot produced in an inverse diffusion flame. Carbon 2017, 124, 372–379. [Google Scholar]
- 44.Mahamuni G. M. Gaurav; Rutherford Jay; Davis Justin; Molnar Eric; Posner Jonathan D.; Seto Edmund, Excitation-Emission Matrix Spectroscopy for Analysis of Chemical Composition of Combustion Generated Particulate Matter. ChemRxiv 2019. [DOI] [PubMed] [Google Scholar]
- 45.Apicella B; Pré P; Rouzaud J; Abrahamson J; Vander Wal R; Ciajolo A; Tregrossi A; Russo C, Laser-induced structural modifications of differently aged soot investigated by HRTEM. Combustion and Flame 2019, 204, 13–22. [Google Scholar]
- 46.Ghiassi H; Toth P; Jaramillo IC; Lighty JS, Soot oxidation-induced fragmentation: Part 1: The relationship between soot nanostructure and oxidation-induced fragmentation. Combustion and Flame 2016, 163, 179–187. [Google Scholar]
- 47.Jaramillo IC; Gaddam CK; Vander Wal RL; Lighty JS, Effect of nanostructure, oxidative pressure and extent of oxidation on model carbon reactivity. Combustion and Flame 2015, 162 (5), 1848–1856. [Google Scholar]
- 48.Botero ML; Eaves N; Dreyer JAH; Sheng Y; Akroyd J; Yang W; Kraft M, Experimental and numerical study of the evolution of soot primary particles in a diffusion flame. Proceedings of the Combustion Institute 2019, 37 (2), 2047–2055. [Google Scholar]
- 49.Herdman JD; Connelly BC; Smooke MD; Long MB; Miller JH, A comparison of Raman signatures and laser-induced incandescence with direct numerical simulation of soot growth in non-premixed ethylene/air flames. Carbon 2011, 49 (15), 5298–5311. [Google Scholar]
- 50.Alfè M; Apicella B; Rouzaud J-N; Tregrossi A; Ciajolo A, The effect of temperature on soot properties in premixed methane flames. Combustion and Flame 2010, 157 (10), 1959–1965. [Google Scholar]
- 51.Toth P; Palotas AB; Eddings EG; Whitaker RT; Lighty JS, A novel framework for the quantitative analysis of high resolution transmission electron micrographs of soot I. Improved measurement of interlayer spacing. Combustion and Flame 2013, 160 (5), 909–919. [Google Scholar]
- 52.Adkins EM; Miller JH, Extinction measurements for optical band gap determination of soot in a series of nitrogen-diluted ethylene/air non-premixed flames. Physical Chemistry Chemical Physics 2015, 17 (4), 2686–2695. [DOI] [PubMed] [Google Scholar]
- 53.Ferrari A; Robertson J, Resonant Raman spectroscopy of disordered, amorphous, and diamondlike carbon. Physical Review B 2001, 64 (7), 075414. [Google Scholar]
- 54.Chen D; Wang H, HOMO-LUMO energy splitting in polycyclic aromatic hydrocarbons and their derivatives. Proceedings of the Combustion Institute 2019, 37 (1), 953–959. [Google Scholar]
- 55.Apicella B; Ciajolo A; Tregrossi A; Abrahamson J; Vander Wal R; Russo C, HRTEM and EELS investigations of flame-formed soot nanostructure. Fuel 2018, 225, 218–224. [Google Scholar]
- 56.Martin JW; Bowal K; Menon A; Slavchov RI; Akroyd J; Mosbach S; Kraft M, Polar curved polycyclic aromatic hydrocarbons in soot formation. Proceedings of the Combustion Institute 2019, 37 (1), 1117–1123. [Google Scholar]
Associated Data
This section collects any data citations, data availability statements, or supplementary materials included in this article.