

Abstract
Purpose:
To assess whether primary care practices with and without support from a larger organization differ in their ability to produce timely reports on cardiovascular disease quality measures.
Background:
Although many primary care practices are now part of larger organizations, it is not clear whether such a shift will improve the ability of those who work in these primary care settings to easily access and use their own data for improvement.
Methods:
Smaller primary care practices were enrolled in a trial of external practice support to build quality improvement (QI) capacity. A request for clinical quality measure (eCQM) data were sent to each practice and study outcomes were defined based on the date on which practices first submitted valid data for at least 1 of the 3 measures. A practice survey completed by a clinic manager captured practice characteristics, including the presence of QI support from a larger organization.
Results:
Of the 209 enrolled practices, 205 had complete data for analysis. Practices without central QI support had higher rates of eCQM submission at 30 days (38% vs 20%) and 60 days, (63% vs 48%) than practices with central QI support. Practices with central QI support took longer to submit data (median, 57 days) compared with practices without centralized support (median, 40 days) although this difference was not significant.
Conclusion:
The ability of smaller practices without centralized QI support to report their eCQMs more quickly may have implications for their subsequent ability to improve these measures.
Keywords: Electronic Health Records, Health Metrics, Primary Health Care, Quality Improvement, Surveys and Questionnaires
Introduction
Primary care practices are expected to report on the quality of the care they provide using electronic health record (EHR) data.1,2 These electronic clinical quality measures (eCQMs) require the use of a health information technology to produce reports on their patient population using standard data definitions. In addition to reporting requirements, the ability to measure care quality is considered foundational to the quality improvement (QI) process itself.3–5 These processes require iterative tests of change and rapid assessment using these data to ensure solutions are a good fit and result in the desired improvement.6
A growing proportion of primary care physicians in the United States are now employed by hospitals or larger health care systems.7,8 These hospital and health systems owned practices have tended to perform well on process and care quality measures, but not across all measures and studies.9–11 These larger organizations may provide health information technology and QI infrastructure support that is not available in smaller independent primary care practices.12–15 It is not clear whether this shift will improve the ability of those who work in these practices to easily access and use their data for improvement, nor is much known about the current ability of smaller practices to produce eCQM reports in a timely fashion.15–17
In 2015 Agency for Healthcare Research & Quality (AHRQ) launched the EvidenceNOW initiative by funding 7 regional collaboratives across the US to expand our understanding of how to build QI capacity in smaller primary care practices with a focus on improving eCQMs for cardiovascular disease (CVD) risk factors. The Healthy Hearts Northwest (H2N) study was the EvidenceNOW collaborative in Washington, Oregon, and Idaho.18,19 The purpose of this analysis is to examine the association between practice characteristics and the ability of a practice to generate timely reports on quality measures for 3 CVD risk factors: appropriate aspirin use, blood pressure control, and smoking screening/cessation. The question of primary interest is whether primary care practices with and without centralized QI support from a larger organization differ in this ability.
Methods
Subjects and Setting
H2N enrolled and randomized 209 primary care practices with fewer than 10 clinicians across Washington, Oregon, and Idaho. All practices received 15 months of practice facilitation as a unifying strategy to provide external support for improvement. Detailed information about the study is available elsewhere.18,19
Data Collection
This analysis uses data from 2 sources, a baseline practice survey completed by the office/practice manager in each practice, and eCQMs from the EHR on 3 CVD risk factors. The practice survey was completed shortly after study enrollment, and before the start of the practice facilitation support. The initial request for 12-month 2015 calendar year eCQM data for each CVD risk factor was sent by e-mail to each practice after the first visit by the practice facilitator with a link to a survey where they could enter numerator and denominator data for each eCQM. Subsequent requests were then made quarterly by e-mail for eCQM data submission that included a reminder about submitting past eCQM measures if not already submitted.
Measures
Practice characteristics collected by survey included practice size and ownership, if the practice was part of a larger organization that provided external support for QI, their autonomy to choose QI projects, their experience with producing customized reports from their EHR, and how big of a priority it is for them to improve CVD risk factor performance. All 3 CVD risk factor eCQMs extracted from the EHR in each practice were endorsed by the Centers for Medicare & Medicaid Services (CMS) in 2015:20 blood pressure control (CMS 165), appropriate aspirin use (CMS164), and tobacco use screening and cessation. (CMS 138) A practice’s ability to submit eCQM data were defined based on the date on which they first submitted valid data for at least 1 of the 3 eCQM measures, defined as nonmissing and nonzero values for both numerator and denominator. Time to initial submission was defined as the number of days between the initial study request for the practice to submit calendar year 2015 eCQM data, and the date the first valid data submission was received. First submission of valid data for any of the 3 eCQM meaures (not all 3 were required), and for any calendar quarter (data for 2015 may not have been the first data submitted) was used to define the time to first submission.
Analysis
Summary measures were used to report practices’ ability to submit eCQM data. The proportion of practices able to submit eCQM data within 30 days, 60 days, 6 months, and within 15 months of initial data request was reported overall, and by practice characteristics. Practices requiring chart review to obtain the quality metrics because they were unable to extract data from their EHR within 15 months of study enrollment were categorized as not able to submit eCQM data. The ability to submit data within 15 months (yes/no) was selected a priori as the primary outcome to assess the association between practice characteristics and practices’ ability to report eCQM data; therefore, statistical testing was limited to this outcome. Fisher’s Exact tests were used to compare the proportion of practices able to submit data within 15 months by practice characteristics. Among practices able to submit data, the mean and median time to data submission were also reported. Kaplain-Meier estimates were used to plot the cumulative incidence of data submission separately for practices with and without centralized QI support.
Results
All 209 primary care practices who were randomized returned a practice survey. Four practices were excluded from the analysis because they discontinued study participation before being asked to submit eCQM data, leaving an analytic sample of 205 practices. Practice characteristics are reported in Table 1. The majority of practices were either independently owned (45%) or were part of a health/ hospital system (39.5%). A total of 95 (46.8%) practices reported that they were part of a larger organization that provided some QI support either monthly, a few times each year or with no regular contact. The remaining 53.25% of practices were not part of a larger organization with such support.
Table 1.
Characteristics of Practices Asked to Submit Clinical Quality Measures (n = 205†)
| Characteristic | n (%) |
|---|---|
| Practice Size | |
| Solo | 38 (18.5) |
| 2 to 4 | 96 (46.8) |
| 5 or more | 71 (34.6) |
| State | |
| Washington | 87 (42.4) |
| Oregon | 95 (46.3) |
| Idaho | 23 (11.2) |
| Location | |
| Rural | 91 (44.4) |
| Urban | 114 (55.6) |
| Specialty | |
| Family medicine | 166 (81.0) |
| Internal medicine | 7 (3.4) |
| Mixed | 32 (15.6) |
| Organizational type | |
| FQHC | 22 (10.7) |
| Health/hospital system | 81 (39.5) |
| IHS/tribal | 10 (4.9) |
| Independent | 92 (44.9) |
| Part of a larger organization with centralized QI support | |
| No | 108 (53.2) |
| Yes, contact ≥ 1 time per month | 70 (34.5) |
| Yes, a few times per year | 15 (7.4) |
| Yes, infrequent or no regular contact | 10 (4.9) |
Four of the 209 randomized practices were excluded because they withdrew study participation before the baseline request for CQM data.
FQHC, Federally Qualified Health Center; IHS, inpatient hospital services; QI, quality improvement; CQM, clinical quality measure.
Two months after the first request for submission of eCQM data, 57% of practices (116 of 205) had submitted data on at least 1 CQM (Table 2). By 15 months, this increased to a total of 91% of practices (187 of 205). Among practices able to submit data, the median time from first request to when any data were submitted for any measure was 41 days (range, 0 to 436). No practice characteristics were significantly associated with the proportion of practices able to submit data within 15 months (primary outcome).
Table 2.
Time to Submission of Clinical Quality Measures by Practice Characteristic
| Able to submit CQM data | Among Practices Able to Submit CQM Data (n=187) | |||||||
|---|---|---|---|---|---|---|---|---|
| Within 30 Days | Within 60 Days | Within 6 months | Within 15 months | Time to submission (days) | ||||
| N | n (%) | n (%) | n (%) | n (%) | P-Value† | Mean (SD) | Median | |
| Overall | 205 | 61 (30) | 116 (57) | 171 (83) | 187 (91) | 74 (77) | 41 | |
| Part of a larger organization with centralized QI support* | ||||||||
| No | 108 | 41 (38) | 68 (63) | 90 (83) | 95 (88) | 0.14 | 61 (77) | 40 |
| Yes | 95 | 19 (20) | 46 (48) | 79 (83) | 90 (95) | 88 (74) | 57 | |
| Autonomy to choose QI projects* | ||||||||
| None, or a little autonomy | 40 | 11 (28) | 14 (35) | 32 (80) | 38 (95) | 0.55 | 103 (85) | 94 |
| A lot of autonomy | 64 | 13 (20) | 38 (59) | 54 (84) | 59 (92) | 79 (85) | 45 | |
| Complete autonomy | 100 | 37 (37) | 63 (63) | 84 (84) | 89 (89) | 58 (63) | 38 | |
| Practice size | ||||||||
| Solo | 38 | 16 (42) | 30 (79) | 33 (87) | 34 (89) | 0.85 | 49 (66) | 34 |
| 2 to 4 | 96 | 28 (29) | 48 (50) | 81 (84) | 87 (91) | 72 (60) | 54 | |
| 5+ | 71 | 17 (24) | 38 (54) | 57 (80) | 66 (93) | 90 (96) | 47 | |
| QI priority* | ||||||||
| Low (1 to 7) | 93 | 34 (37) | 57 (61) | 80 (86) | 84 (90) | 0.81 | 61 (61) | 39 |
| High (8 to 10) | 107 | 24 (22) | 55 (51) | 86 (80) | 98 (92) | 86 (87) | 51 | |
| Ever run a non-standard QI report* | ||||||||
| No | 119 | 37 (31) | 66 (55) | 93 (78) | 105 (88) | 0.13 | 78 (86) | 41 |
| Yes | 81 | 21 (26) | 46 (57) | 73 (90) | 77 (95) | 70 (63) | 41 | |
Missing data: QI support (n = 2); autonomy (n = 1); QI priority (n = 5); ever run a non-standard report (n = 5).
P-value reports the significance of differences in the proportion able to submit data within 15 months from the date ABCS data was requested, based on Fisher’s Exact Test.
CQM, clinical quality measure; SD, standard deviation; QI, quality improvement; ABCS, aspirin, blood pressure, cholesterol, and smoking.
Among practices able to submit data within 15 months, median time to submit data were similar by practice size, practice-reported priority to improve CVD risk factor control, or prior experience with creating nonstandard performance reports. As shown in Figure 1, the cumulative incidence plots for practices with and without central QI support cross, indicating that the relative probability of data submission differs with time. While practices without central QI support had higher data submission rates early in follow-up (submission rates 38% vs 20% at 30 days), the trends were reversed at the end of the 15-months, and there was no statistical difference in the primary outcome, the ability to submit data within 15 months (P = .14).
Figure 1.
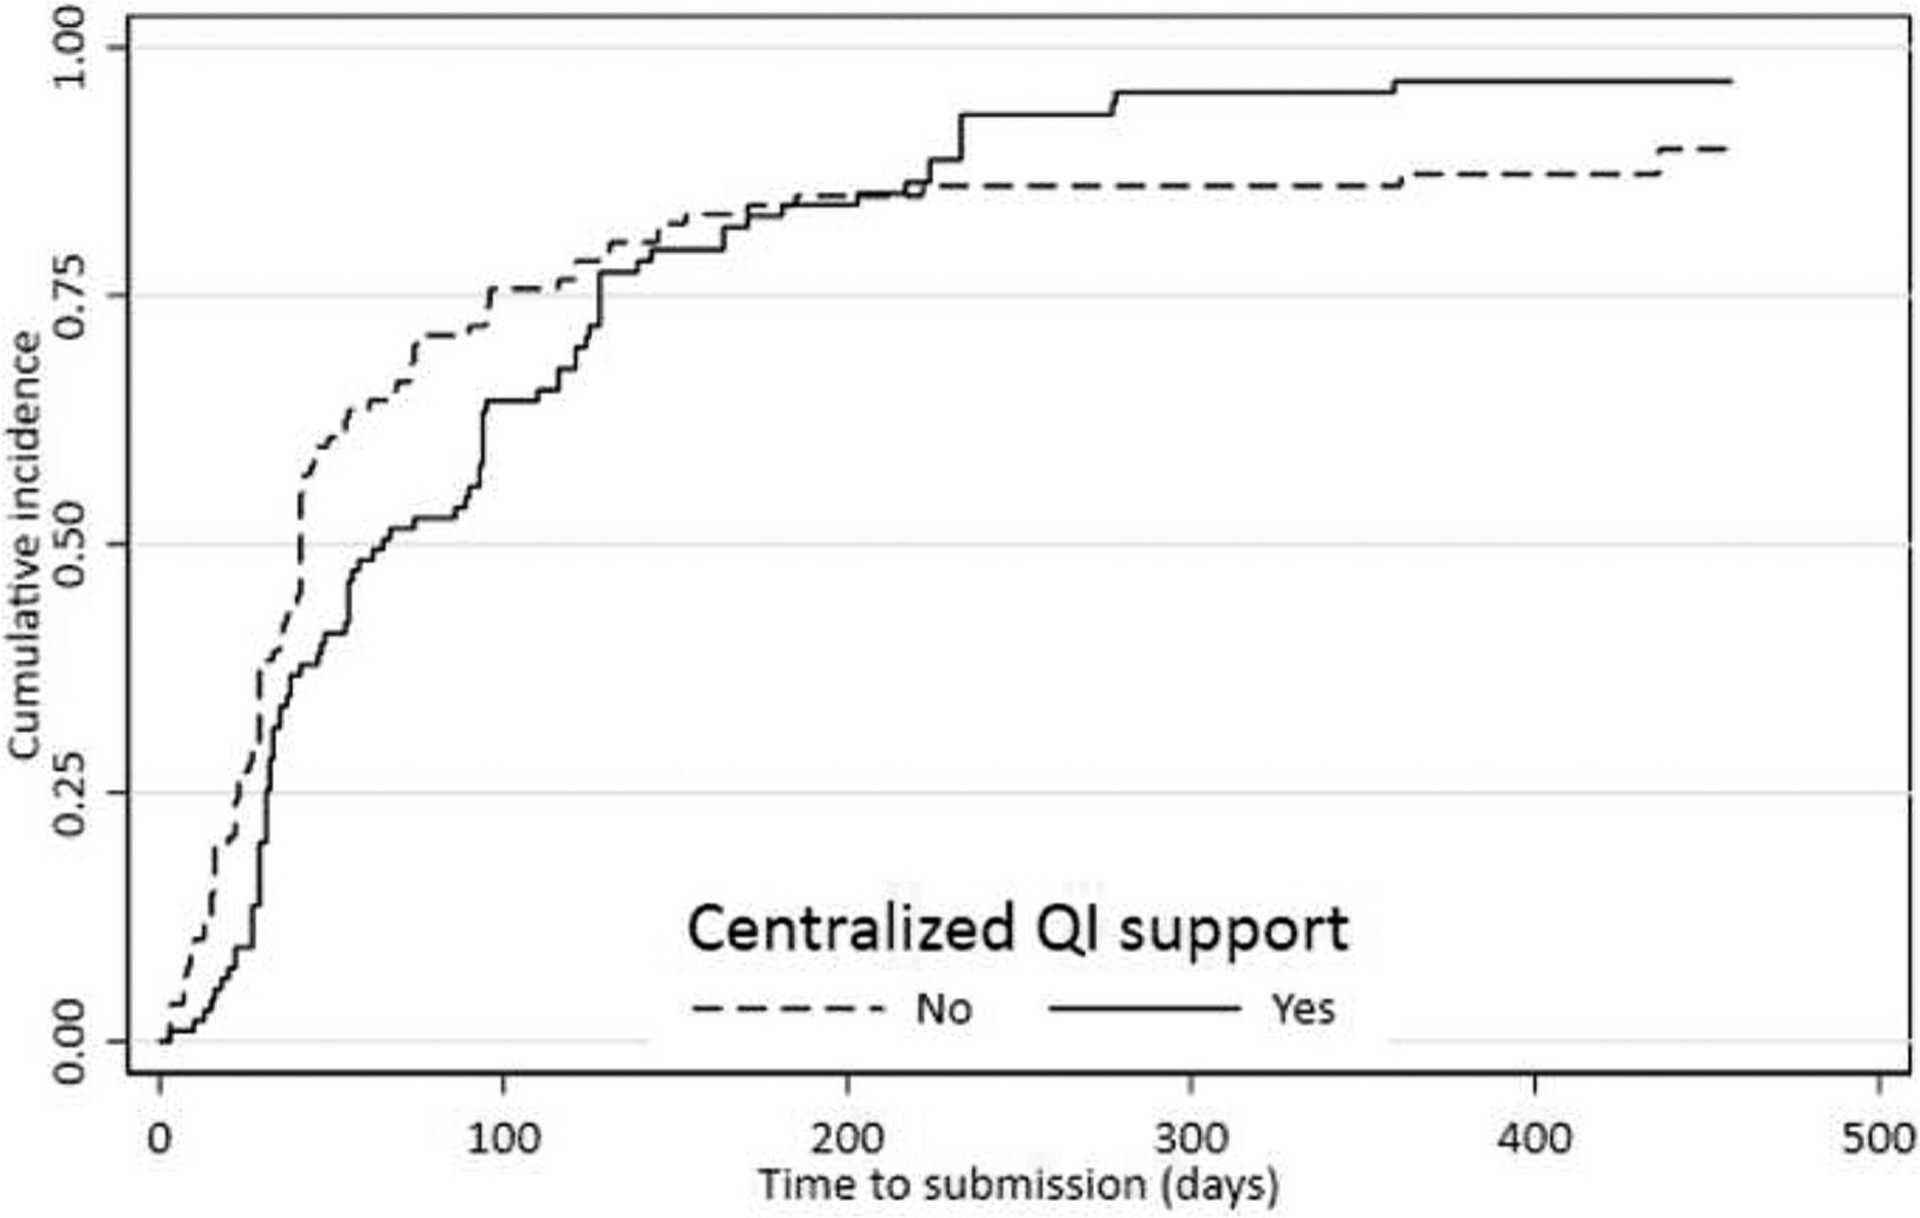
Cumulative probability of practices’ ability to submit clinical quality measure (CQM) data, with and without centralized quality improvement (QI) support.
Discussion
Although practices that were not part of a larger organization with central QI support were able to report their eCQM measures more quickly within the first 6 months of the initial request, there were no differences in rates of reporting 15 months after the initial request. In a similar fashion, practices with a solo clinician had higher eCQM submission rates at 30 days and at 60 days compared with larger practices.
These practices may be nimbler because they have more local control over health IT capabilities compared with practices owned by health care systems consistent with “the paradox of the small independent practice.”17 Practice facilitators who supported practices owned by larger organizations noted that often a queue existed for data reports within the organization, resulting in delayed eCQMs reports. A limitation of this study is a lack of data on reasons for delays in submitting eCQM reports. For example, larger organizational priorities for QI may not have aligned with improving CVD risk factors, resulting in a delay in producing the eCQM reports. Practices owned by larger organizations may had other QI initiatives underway during this time, delaying their response to our request, even though the data were readily available to them. This analysis did not address differences in a practice’s ability to report all 3 measures as opposed to just 1, or differences in response rates for different measures. It is also important to note that the ability to submit timely data to an external organization does not necessarily mean that larger organization sponsored practices are any better or worse at continuous QI.
For QI initiatives within primary care, timely reports of performance are critical for health care teams to complete the cycle of Plan-Do-Study-Act.21 Delays in their ability to obtain feedback about their performance has the potential to slow progress as teams are uncertain if recent changes had the desired effect on clinical performance.22 Further work is needed to assess the impact of these delays on improving care and outcomes for patients.
Funding:
This project was supported by Grant No. R18HS023908 from the Agency for Healthcare Research and Quality. The content is solely the responsibility of the authors and does not necessarily represent the official views of the Agency for Healthcare Research and Quality. Additional support was provided by the National Center for Advancing Translational Sciences of the National Institutes of Health under Award No. UL1 TR002319. The content is solely the responsibility of the authors and does not necessarily represent the official views of the National Institutes of Health.
We are very grateful to the clinicians and staff of the primary care practices enrolled in this ambitious study, especially those who worked with us to produce clinical quality measures from their electronic health records. This study would not be possible without the practice facilitators from Qualis/Comagine Health and the Oregon Rural Practice Research Network who devoted themselves tirelessly to outreach and support activities with these practices, especially Raja Cholan and Nicholas Colin in the Department of Medicine at the Oregon Health Sciences University.
Footnotes
Conflicting and Competing Interests: None.
Trial Registration: This trial is registered with www.clinicaltrials.gov Identifier #NCT02839382.
Ethics Approval:
Kaiser Permanente Washington Health Research Institute’s Institutional Review Board reviewed and approved this study.
To see this article online, please go to: http://jabfm.org/content/33/4/620.full.
Contributor Information
Michael L. Parchman, Kaiser Permanente of Washington Health Research Institute, Seattle WA;.
Melissa L. Anderson, Kaiser Permanente of Washington Health Research Institute, Seattle WA;.
Robert B. Penfold, Kaiser Permanente of Washington Health Research Institute, Seattle WA;.
Elena Kuo, Kaiser Permanente of Washington Health Research Institute, Seattle WA;.
David A. Dorr, Department of Medicine, Oregon Health Sciences University, Portland OR..
References
- 1.Panzer RJ, Gitomer RS, Greene WH, Webster PR, Landry KR, Riccobono CA. Increasing demands for quality measurement. JAMA 2013;310: 1971–80. [DOI] [PubMed] [Google Scholar]
- 2.Casalino LP, Gans D, Weber R, et al. US physician practices spend more than $15.4 billion annually to report quality measures. Health Aff (Millwood) 2016;35:401–6. [DOI] [PubMed] [Google Scholar]
- 3.Dorr D, Bonner LM, Cohen AN, et al. Informatics systems to promote improved care for chronic illness: a literature review. J Am Med Informat Assoc 2007;14:156–63. [DOI] [PMC free article] [PubMed] [Google Scholar]
- 4.Taylor EF, Peikes D, Genevro J, Meyers D. Creating capacity for improvement in primary care. Rockville, MD: Agency for Healthcare Research and Quality; April 2013. http://www.ahrq.gov/professionals/prevention-chronic-care/improve/capacity-building/pcmhqi1.html. Accessed July 29, 2019. [Google Scholar]
- 5.Taylor EF, Genevro J, Peikes D, Gennotti Wang W, Meyers D. Building quality improvement capacity in primary care: supports and resources. Rockville, MD: Agency for Healthcare Research & Quality; April 2013. http://www.ahrq.gov/professionals/prevention-chronic-care/improve/capacity-building/pcmhqi2.html. Accessed July 10, 2019. [Google Scholar]
- 6.Taylor MJ, McNicholas C, Nicolay C, Darzi A, Bell D, Reed JE. Systematic review of the application of the plan-do-study-act method to improve quality in healthcare. BMJ Qual Saf 2014;23:290–8. [DOI] [PMC free article] [PubMed] [Google Scholar]
- 7.McWilliams JM, Chernew ME, Zaslavsky AM, Hamed P, Landon BE. Delivery system integration and health care spending and quality for Medicare beneficiaries. JAMA Intern Med 2013;173:1447–56. [DOI] [PMC free article] [PubMed] [Google Scholar]
- 8.Kash BA, Tan D. Physician group practice trends: a comprehensive review. J Hosp Med Manage 2016;1:8. [Google Scholar]
- 9.Bishop TF, Shortell SM, Ramsay PP, Copeland KR, Casalino LP. Trends in hospital ownership of physician practices and the effect on processes to improve quality. Am J Manage Care 2016;22:172–6. [PMC free article] [PubMed] [Google Scholar]
- 10.Carlin CS, Dowd B, Feldman R. Changes in quality of health care delivery after vertical integration. Health Serv Res 2015;50:1043–68. [DOI] [PMC free article] [PubMed] [Google Scholar]
- 11.Friedberg MW, Coltin KL, Pearson SD, et al. Does affiliation of physician groups with one another produce higher quality primary care?. J Gen Intern Med 2007;22:1385–92. [DOI] [PMC free article] [PubMed] [Google Scholar]
- 12.Nutting PA, Crabtree BF, McDaniel RR. Small primary care practices face four hurdles—Including a physician-centric mind-set—In becoming medical homes. Health Aff (Millwood) 2012;31:2417–22. [DOI] [PubMed] [Google Scholar]
- 13.Arar NH, Noel PH, Leykum L, Zeber JE, Romero R, Parchman ML. Implementing quality improvement in small, autonomous primary care practices: implications for the patient-centred medical home. Qual Prim Care 2011;19:289–300. [PMC free article] [PubMed] [Google Scholar]
- 14.Holmgren AJ, Adler-Milstein J. Does electronic health record consolidation follow hospital consolidation? Health Affairs Blog. March 7, 2019 https://www.healthaffairs.org/do/10.1377/hblog20190304.998205/full/. Accessed August 20, 2019. [Google Scholar]
- 15.Liaw WR, Jetty A, Petterson SM, Peterson LE, Bazemore AW. Solo and small practices: a vital, diverse part of primary care. Ann Fam Med 2016;14:8–15. [DOI] [PMC free article] [PubMed] [Google Scholar]
- 16.O’Shea J As MACRA implementation proceeds, changes are needed. Health Affairs Blog 2019. April 21, 2017. https://www.healthaffairs.org/do/10.1377/>hblog20170421.059725/full/. Accessed August 15, 2019. [Google Scholar]
- 17.Mostashari F The paradox of size: how small, independent practices can thrive in value-based care. Ann Fam Med 2016;14:5–7. [DOI] [PMC free article] [PubMed] [Google Scholar]
- 18.Parchman ML, Fagnan LJ, Dorr DA, et al. Study protocol for “Healthy Hearts Northwest”: a 2 × 2 randomized factorial trial to build quality improvement capacity in primary care. Implement Sci 2016;11:138. [DOI] [PMC free article] [PubMed] [Google Scholar]
- 19.Parchman ML, Anderson ML, Dorr DA, et al. A randomized trial of external practice support to improve cardiovascular risk factors in primary care. Ann Fam Med 2019;17:S40–S49. [DOI] [PMC free article] [PubMed] [Google Scholar]
- 20.Department of Health and Human Services, Centers for Medicare & Medicaid Services, The office of the National Coordinator for Health Information Technology, USA.gov. Eligible professional/eligible clinician eCQMs. eCQI Resource Center 2019. https://ecqi.healthit.gov/ep-ec-ecqms. Accessed September 24, 2019. [Google Scholar]
- 21.Langley G, Nolan K, Nolan C, Provost L. The improvement guide: a practical approach to enhancing organizational performance. 2nd ed San Francisco, CA: Jossey-Bass; 2009. [Database]. [Google Scholar]
- 22.Nolan TW. Execution of strategic improvement initiatives to produce system-level results. IHI Innovation Series white paper. 2007. http://www.ihi.org/resources/Pages/IHIWhitePapers/ExecutionofStrategicImprovementInitiativesWhitePaper.aspx. Accessed August 24, 2019. [Google Scholar]