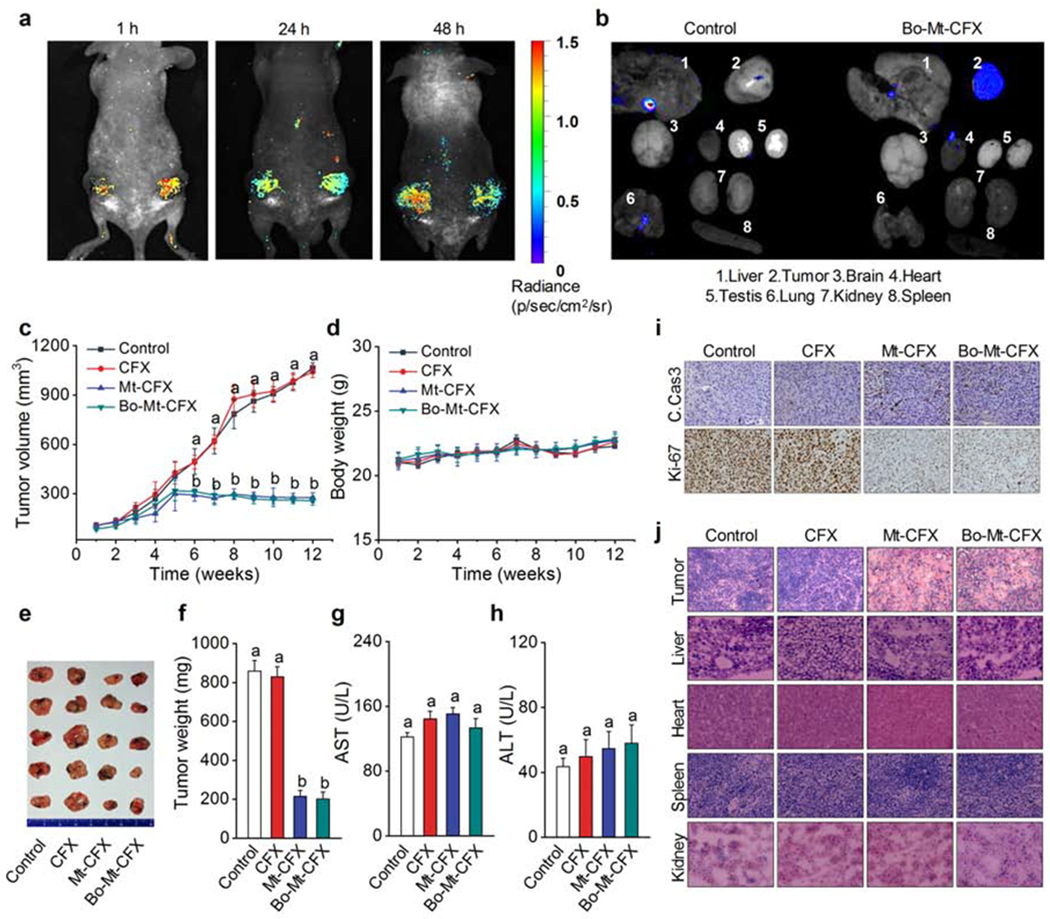
Figure 5. In vivo tumor growth reduction by Mt-CFX and Bo-Mt-CFX.

(A) In vivo images of MDA-MB-231 xenograft mouse 1 h, 24 h, and 48 h post intravenous tail vein injection of a single dose of 0.5 μmol kg−1 Bo-Mt-CFX. Excitation at 550 nm. Emission at 650 nm.
(B) Ex vivo imaging of excised tumors and organs 48 h post injection of a single dose of 0.5 μmol kg−1 Bo-Mt-CFX or vehicle only. Excitation at 550 nm. Emission at 650 nm.
(C) In vivo tumor volume determination (1/2 × length × width2) of mice treated with 0.5 μmol kg−1 CFX, Mt-CFX, Bo-Mt-CFX, or vehicle alone, once a week for 3 weeks.*
(D) Body weight of mice during the treatment regime.
(E) Excised tumors at the treatment endpoint.
(F) Excised tumor weight per treatment group.*
(G-H) Blood serum AST and ALT activity levels, as determined using a colorimetric assay.*
(I) Immunohistochemistry (cleaved caspase 3 and Ki-67) of representative tumor tissue slices of the different treatment groups.
(J) H&E staining of representative tissue slices of the different treatment groups.
Data are represented as mean ± SEM. Panels C, D, F: n = 4 mice and n =8 tumors per group, Panels G, H: n = 4. Statistical significance was determined using a one-way ANOVA test with post-hoc Bonferroni test.
*Different letters (e.g., a–d) signify data sets that are statistically different (p < 0.05).
