Abstract
Background
In March 2020, the greater New York metropolitan area became an epicenter for severe acute respiratory syndrome coronavirus 2 (SARS-CoV-2) infection. The initial evolution of case incidence has not been well characterized.
Methods
Northwell Health Laboratories tested 46 793 persons for SARS-CoV-2 from 4 March through 10 April. The primary outcome measure was a positive reverse transcription–polymerase chain reaction test for SARS-CoV-2. The secondary outcomes included patient age, sex, and race, if stated; dates the specimen was obtained and the test result; clinical practice site sources; geolocation of patient residence; and hospitalization.
Results
From 8 March through 10 April, a total of 26 735 of 46 793 persons (57.1%) tested positive for SARS-CoV-2. Males of each race were disproportionally more affected than females above age 25, with a progressive male predominance as age increased. Of the positive persons, 7292 were hospitalized directly upon presentation; an additional 882 persons tested positive in an ambulatory setting before subsequent hospitalization, a median of 4.8 days later. Total hospitalization rate was thus 8174 persons (30.6% of positive persons). There was a broad range (>10-fold) in the cumulative number of positive cases across individual zip codes following documented first caseincidence. Test positivity was greater for persons living in zip codes with lower annual household income.
Conclusions
Our data reveal that SARS-CoV-2 incidence emerged rapidly and almost simultaneously across a broad demographic population in the region. These findings support the premise that SARS-CoV-2 infection was widely distributed prior to virus testing availability.
Keywords: coronavirus disease 2019 (COVID-19), severe acute respiratory syndrome coronavirus 2 (SARS-CoV-2), socioeconomic, race, hospitalization
From 4 March to 10 April 2020, Northwell Health Laboratories identified SARS-CoV-2 in 26 735/46 793 tested persons; these data provide detailed insights into the demographics, geographic spread, and delivery of healthcare for SARS-CoV-2 in the New York area.
The severe acute respiratory syndrome coronavirus 2 (SARS-CoV-2) pandemic has presented major challenges to healthcare institutions globally. A challenge in identifying these patients is the speed at which patients can develop severe infections following exposure, and the widely varying estimates for case incidence of those infected [1]. Shortly after the first case of SARS-CoV-2 infection was identified in New York State (1 March 2020), Northwell Health, a large integrated healthcare system that serves the greater New York metropolitan area, began testing for SARS-CoV-2 viral RNA. Our first positive case was found on 8 March for a specimen collected on 4 March. Over the next 5 weeks, Northwell Health Laboratories (NHL) identified positive cases of SARS-CoV-2 in 26 735 of the 180 458 persons (14.8%) identified in New York State [2]. With these data, we sought to understand the spread of SARS-CoV-2 through the greater New York metropolitan area.
METHODS
The population for this study was tested for SARS-CoV-2 by NHL from 4 March (first specimen collection date) through 10 April 2020 (last specimen collection date). As NHL is an integrated laboratory network [3], SARS-CoV-2 testing was made available across the entire Northwell health system. NHL used 3 real-time reverse transcription–polymerase chain reaction tests: starting 7 March, a diagnostic panel modified from the US Food and Drug Administration (FDA) method by the New York State Department of Health (NYSDOH); starting 11 March, the ePlex (GenMark Diagnostics, Inc, Carlsbad, CA); and starting 17 March, the Panther Fusion System (Hologic, Inc, Marlborough, MA) automated methods. These tests were authorized for emergency use by the FDA and NYSDOH, and were validated by NHL to detect SARS-CoV-2 RNA in nasopharyngeal and oropharyngeal swabs transported in liquid media and in sputum specimens. The median time between specimen collection and the test result was 1.7 days (interquartile range [IQR] = 1.2–2.2 days).
De-identified patient data were obtained from the NHL Information System (Cerner, Inc, Kansas City, MO). These data included patient test result, age, sex, race, dates of when the specimen was obtained and the test resulted, and zip code of patient residence. Hospitalization data were obtained from the Sunrise Clinical Manager electronic health record (Allscripts, New York, NY). Geographic information was mapped using custom MATLAB code for plotting dots on a fixed map image.
Publicly available data sources used for analyses are given in the Supplementary Material. Data compilation and statistical analyses were done using spreadsheets (Excel; Microsoft Corporation Redmond, WA), R (version 3.2.2; R Foundation for Statistical Computing), SPSS 26 (IBM Corporation, Armonk, NY), MATLAB (MathWorks, Natick, MA), JMP (SAS Institute, Cary, NC) and ad hoc Perl scripts. Statistical comparisons for data in Figure 1, Supplementary Figure 1, and Supplementary Table 1 were by one-way analysis-of-variance; in Figures 2 and 3 and Supplementary Figure 3 by linear correlation and t test of log10-transformed data, and in Figures 4 and 5 by chi-square. The Northwell Health Institutional Review Board approved this as minimal-risk research using de-identified data collected for routine clinical practice and waived the requirement for informed consent.
Figure 1.
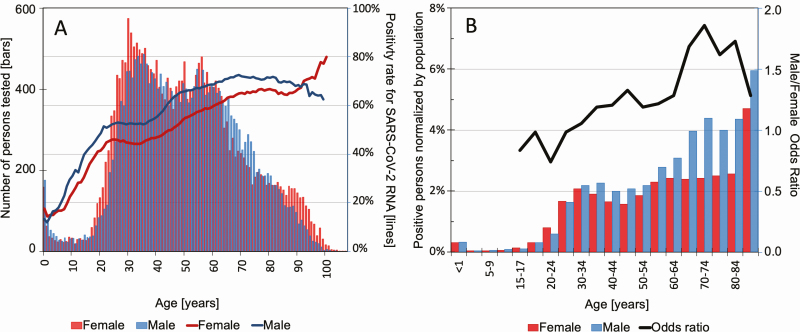
Demographics of the tested population. A, Left axis: number of persons tested by age and gender. Each bar represents 1 year of age. The bar height represents the total number of persons of the particular age who were tested by Northwell Health Laboratories, and the color represents an interspaced histogram of females (red) and males (blue). Right axis: test percentage of positivity rates, as a function of age; females (red) and males (blue). B, Percentage of persons of the same age and sex in the state of New York expected to be infected by SARS-CoV-2. Each bar represents a hemi-decile age bracket: female (red) and male (blue) are shown as separate bars. The bar height represents the percentage of New York State persons of the particular age and sex estimated to be infected with SARS-CoV-2, based on the number of positive results obtained by Northwell Health Laboratories, corrected on a per-county basis for the fraction of the total state SARS-CoV-2 testing performed by Northwell Health Laboratories, and then normalized to respective county population demographics using the 2010 census. The line represents the male to female odds ratio for each hemi-decile age bracket. The horizontal straight reference line at the value of 1.0 denotes an equal odds of men and women being infected with SARS-CoV-2. Abbreviation: SARS-CoV-2, severe acute respiratory syndrome coronavirus 2.
Figure 2.
Northwell SARS-CoV-2 testing by average household income. Each point in these plots represents a zip code. A, Logarithmic plot of the percentage of population in each zip code tested by Northwell Health Laboratories for SARS-CoV-2, as a function of average annual household income per zip code, based on 2017 US Census data. Log values are displayed for the y-axis and along the upper x-axis; actual values for annual income are shown along the lower x-axis. B, Logarithmic plot of the percentage of SARS-CoV-2–positive persons tested by Northwell Health Laboratories, as a function of zip code average annual household income. Zip codes are from the 4 counties in which Northwell Health Laboratories tested greater than 10% of the total county population tested (Queens, Nassau, Suffolk, Richmond counties), and in which at least 10 persons were tested. A total of 36 177 persons in 217 zip codes are represented. Abbreviation: SARS-CoV-2, severe acute respiratory syndrome coronavirus 2.
Figure 3.
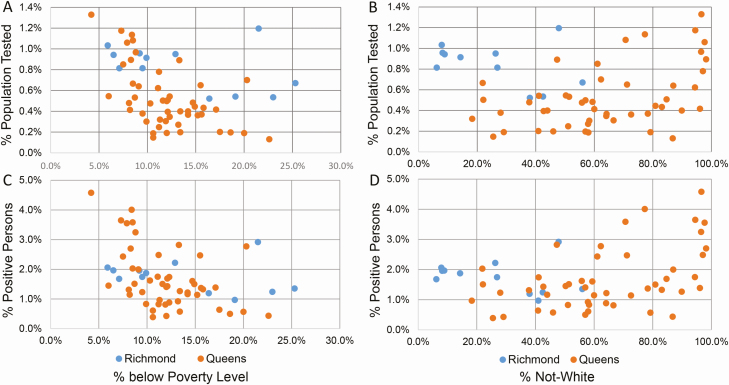
Northwell SARS-CoV-2 testing by socioeconomic factors. Each point represents a zip code. A, Linear plot of zip code percentage of population tested as a function of percentage of persons below the poverty level. B, Linear plot of zip code percentage of population tested as a function of percentage of persons not White. C, Linear plot of the zip code percentage of SARS-CoV-2–positive persons as a function of the percentage of persons below the poverty level. D, Linear plot of the zip code percentage of SARS-CoV-2–positive persons as a function of the percentage of persons who were not White. Inclusion criteria for all panels were regional counties for which Northwell Health Laboratories provided greater than 10% of SARS-CoV-2 testing and individual zip codes with at least 10 tested persons. The data represent 26.2% of all SARS-CoV-2 tests performed in Richmond County from 4 March to 10 April 2020 (4059 persons, 12 zip codes) and 21.4% of all tests performed in Queens County (9831 persons, 49 zip codes). Abbreviation: SARS-CoV-2, severe acute respiratory syndrome coronavirus 2.
Figure 4.
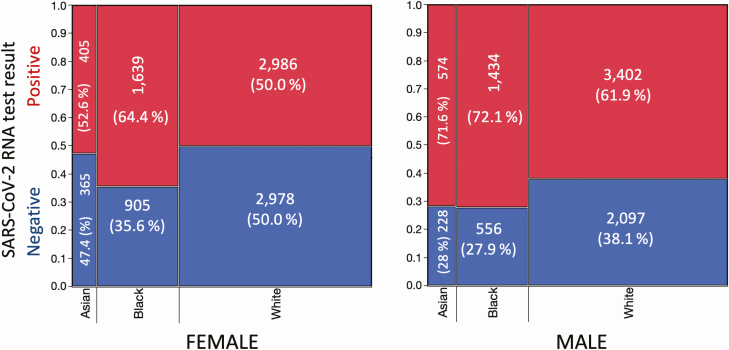
SARS-CoV-2 test results by race and gender. Mosaic plots are shown for female (left) and male (right) patients of known race, with the number of persons indicated by the width and height of the groupings; actual numbers of persons testing SARS-CoV-2 positive (red) or negative (blue) in each race/gender subgroup (%) are shown. Abbreviation: SARS-CoV-2, severe acute respiratory syndrome coronavirus 2.
Figure 5.
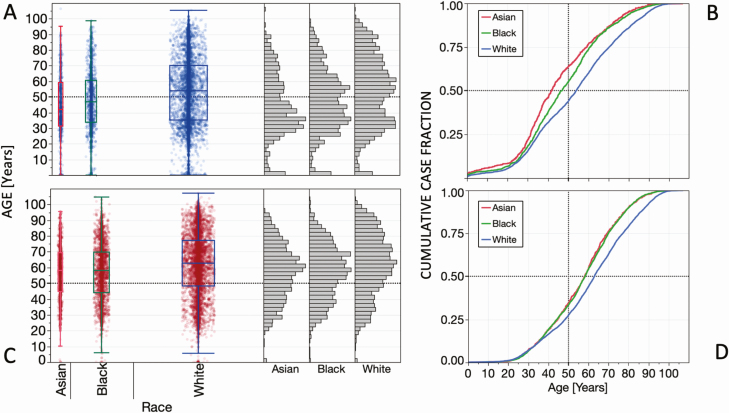
SARS-CoV-2 test results by race and age. A, Box-and-whisker plot of negative test results by age for Asian (n = 594), Black (n = 1461), and White (n = 5075) persons, with means and 95% confidence intervals shown. The separation of the vertical displays reflects the number of persons tested per racial group. The adjacent histograms show the relative age distribution of negative test results for each race. B, Cumulative case distribution by age for Asian, Black, and White persons testing negative for SARS-CoV-2. C, Box-and-whisker plot of positive test results by age for Asian (n = 979), Black (n = 3073), and White (n = 6385) persons. D, Cumulative case distribution by age for Asian, Black, and White persons testing positive for SARS-CoV-2. Abbreviation: SARS-CoV-2, severe acute respiratory syndrome coronavirus 2.
RESULTS
Geographic Distribution
From 2 March through 10 April 2020, a total of 345 838 SARS-CoV-2 tests were performed in the greater New York City region (the 5 counties of New York City plus Nassau, Suffolk, and Westchester) [2], of which 51 074 tests (14.8%) were resulted by NHL. Correcting for repeat testing on individuals, this represented 46 793 unique persons residing in 853 zip codes, 44 723 (95.6%) of whom resided in 456 of the 644 zip codes of this region. Of these 46 793 persons, Northwell testing identified 26 735 persons (57.1%) with at least 1 test positive for SARS-CoV-2. Northwell’s first positive specimen was from a patient-associated zip code in Nassau County; the test sample was obtained 4 March when the patient presented to a Northwell hospital emergency department. Within 3 days, Northwell-hospitalized patients from 5 additional zip codes in Nassau, Queens, Manhattan, Staten Island, and Westchester also were identified as being SARS-CoV-2 positive. By 10 April, SARS-CoV-2–positive patients were identified in 455 of the 456 zip codes in our service area from which persons had been tested by Northwell.
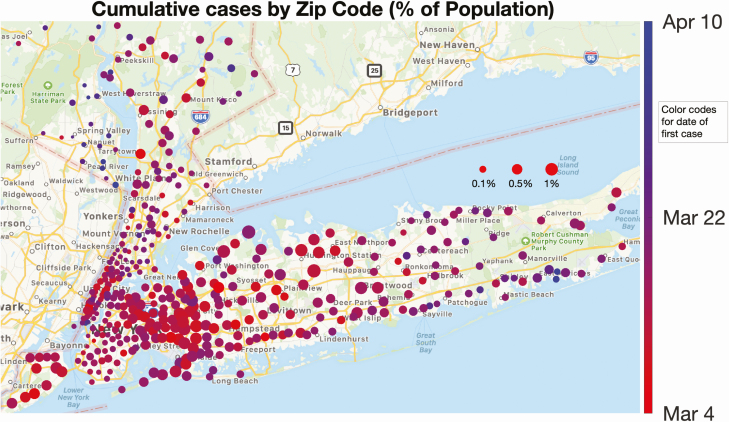
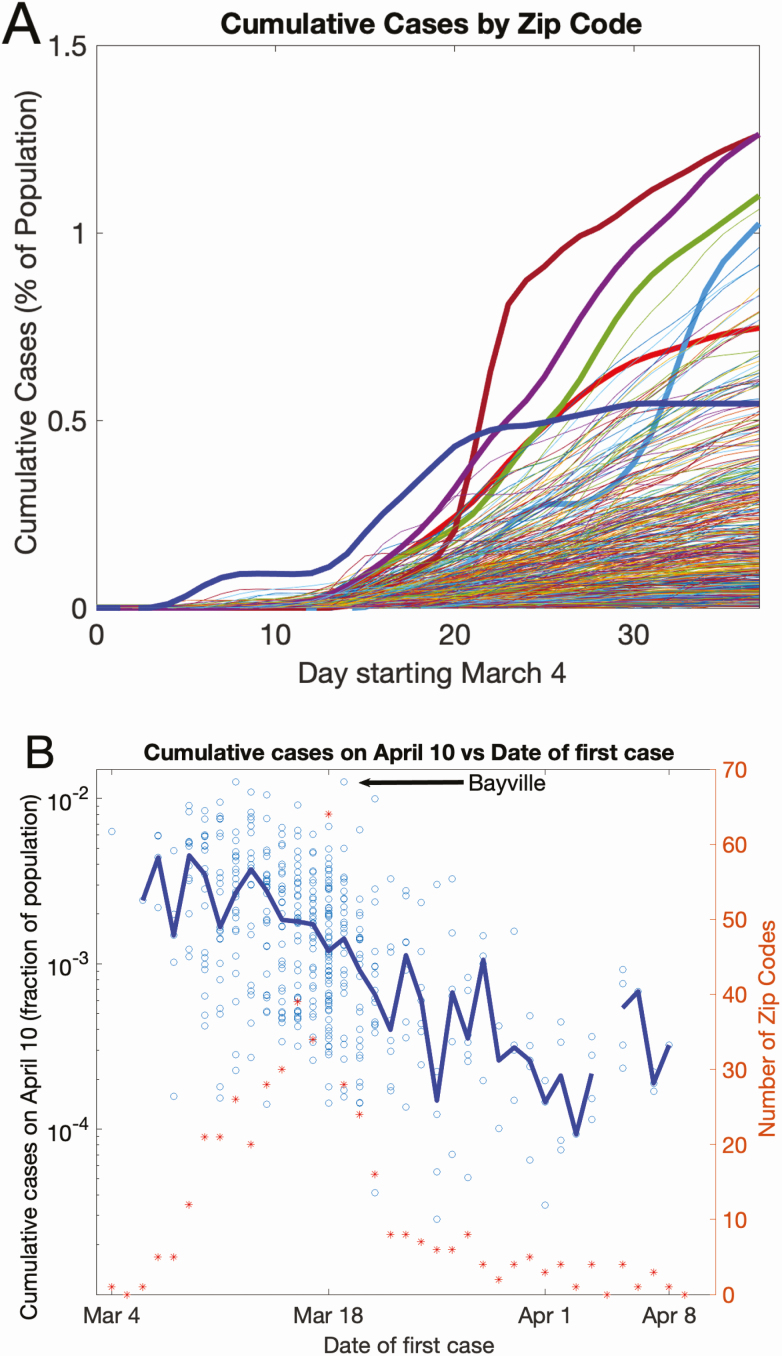
The cumulative distribution of positive patients by 10 April in individual zip code areas is shown in Figure 6 (a time-lapse chronologic display of case accumulation per zip code is available as a Supplementary Video). SARS-CoV-2 was already widespread in our geographic region during the first week of testing, based on the almost simultaneous appearance of patients with SARS-CoV-2 residing in widely dispersed zip codes. However, different zip code areas with the same starting date displayed markedly diverse case burden over the course study period, as shown by the growth of cumulative case incidence (Figure 7A). This diversity is further quantified (Figure 7B): the percentage of the population cumulatively testing positive per zip code is plotted as a function of the days elapsed after identification of the first case in its respective zip code area (each circle denotes 1 zip code). On this semi-log plot, a 10-fold range in cumulative case incidence is observed across different zip codes for a fixed appearance date of the first case. The symmetric distribution of the points around the median (blue line) on a log scale indicates a long-tailed, log-normal type distribution, with a few extreme zip codes showing large percentages affected. One data point is denoted as an example (Bayville, NY) [4].
Figure 6.
Spatial distribution of the local percentage of population infected and its progress with time. Each circle represents a New York State zip code area, and its size is proportional to the number of positive cases normalized by the population in the zip code. The color of each dot represents the first day that cases were detected (the hues range from red to blue, corresponding to the time period 4 March–10 April). The first cases appeared early in most zip codes, denoted by their predominantly red color. A dynamic representation of the growth leading to this map is available in the Supplementary Video.
Figure 7.
Variation in cumulative case incidence by zip code. A, Cumulative case incidence by zip code, as a function of calendar date. Five zip codes are highlighted in bold, to show the diversity in case accrual. B, Cumulative cases on 10 April as a function of days elapsed since detection of the first case. Each symbol represents a single zip code. The x-axis value is the calendar date the first case in a given zip code appeared. The left y-axis value is the cumulative SARS-CoV-2 case incidence, as a fraction of the population in that zip code on 10 April. A total of 501 zip code areas are represented. The blue line connects the median values of the fraction of population infected across zip codes, as a function of the date of first case incidence. The diversity in case accumulation per zip code is shown by the wide dispersion of symbols on this semi-log plot, for the fixed date of the first case in any given zip code. The red asterisks and the right y-axis denote the number of zip codes acquiring a “first case” on any given calendar day. Abbreviation: SARS-CoV-2, severe acute respiratory syndrome coronavirus 2.
Clinical Practice Site Sources
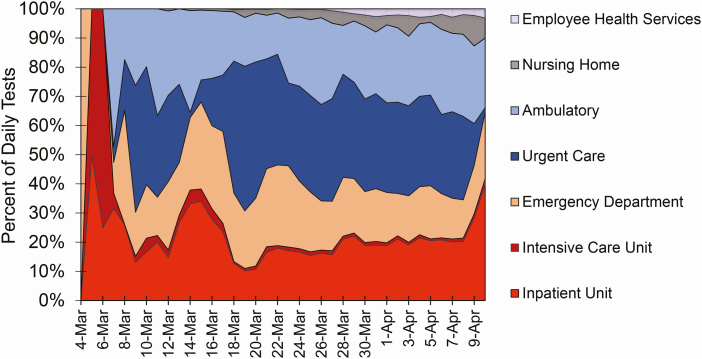
Among the 26 735 positive patients from 4 March to 10 April, 5576 (20.9%) test samples were obtained during an emergency department evaluation; 6584 (24.6%) as part of an admission-to-hospital order set, including admission to an intensive care unit; 7493 (28.0%) from urgent care centers (mostly Northwell Health GoHealth facilities); 5473 (20.5%) from other ambulatory practice locations; 1292 (4.8%) from skilled-nursing and assisted-living facilities; and 317 (1.2%) from Northwell Health Employee Health Services. The daily distribution of testing location is shown in Figure 8. At first, predominantly hospitalized patients were tested (inpatient floor or intensive care unit). As case incidence and familiarity with SARS-CoV-2 clinical presentation increased, the fraction of testing dedicated to hospitalized patients decreased to approximately 20%, while testing in emergency departments, urgent care centers, and other outpatient settings increased.
Figure 8.
Clinical site of origin for SARS-CoV-2 test specimens, as a percentage of specimens received each day by Northwell Health Laboratories. The percentage of cases for the first days of sample receipt (4–6 March 2020) are from the hospital setting (inpatient unit, intensive care unit, or emergency department). Starting 7 March, samples began to be received from urgent care and ambulatory practice settings; from nursing homes starting 12 March; and from Northwell employee health services starting 17 March. Abbreviation: SARS-CoV-2, severe acute respiratory syndrome coronavirus 2.
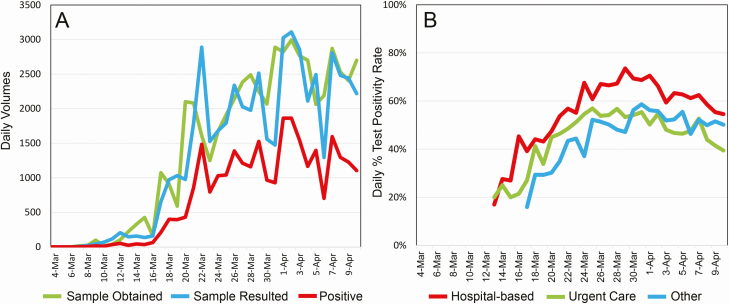
Daily Northwell SARS-CoV-2 testing volumes are shown in Figure 9A. The peak aggregate daily case incidence of SARS-CoV-2 occurred on 1 April, with 1862 positive cases. Figure 9B shows SARS-CoV-2 percentage of test positivity rates beginning on 13 March when testing volumes began to increase dramatically; peak percentage test positivity rates occurred in the last week of March. Northwell daily test percentage positivity rates substantially exceeded regional rates, particularly from 16 to 21 March, with the final cumulative percentage positive rate on 10 April being 54.5% (Northwell) versus 46.1% (service area), a ratio of 1.18 (see Supplementary Figures 1 and 2, Supplementary Table 1).
Figure 9.
Daily SARS-CoV-2 testing data. A, Test volumes, on the basis of the daily receipt of nasopharyngeal swab samples, daily resulting of tests, and daily number of positive tests. The first sample was received on 4 March, and the first tests were resulted on 7 March. B, Daily percentages of test positivity rates are shown starting 13 March, as obtained from a hospital setting (inpatient unit, intensive care unit, or emergency department), urgent care, or other (predominantly ambulatory practice sites, with a small fraction of cases from nursing homes and Northwell employee health services; see Figure 8). Abbreviation: SARS-CoV-2, severe acute respiratory syndrome coronavirus 2.
Demographics
During the study, 24 058 females and 22 610 males were tested (no sex information was available for 125 persons). The age distribution of testing by gender is given in Figure 1A. Although the age distribution of persons tested generally follows the patterns reported in the 2010 US census, persons under 35 years were markedly underrepresented (P = .021). Test positivity rates increased progressively with age (P < .0001), with males showing higher rates (P = .003), except for the earliest ages (<5 years) or the latest ages (>85 years).
We estimated the population-normalized distribution of the percentage of population affected by age and gender (Figure 1B). Cumulative Northwell SARS-CoV-2–positive cases across our service area accounted for 17% of the total cases reported in New York State. The estimated percentage of the regional population confirmed as SARS-CoV-2 positive (for females and males) was well below 1% for under age 25. For females age 25 and above, estimated case distribution rose steadily from 1.7% to 2.6% through age 84 and was 4.7% for age 85 and above. For males age 25 and above, the estimated case incidence rose from 1.6% at age 25 to 4.4% through age 84 and was 6.0% for age 85 and above. Thus, in this population-normalized distribution, males were disproportionately more affected than females above age 25 (P < .001).
We next examined the potential impact of socioeconomic factors and race. Figure 2A shows the percentage of persons tested by NHL in each zip code, as a function of zip code average annual household income; no significant relationship is evident. Figure 2B shows SARS-CoV-2 percentage test positivity versus average annual household income by zip code. From $25 000 to $800 000 per annum, there is a strong negative correlation (R2 = 0.35, P < .0001). From $125 000 to per annum, there is a slightly positive trend, which is not statistically significant. Supplementary Figure 3 shows that, while the percentage of the population tested for SARS-CoV-2 by NHL did not correlate with zip code population and population density, there was a positive correlation of zip code percentage test positivity with these variables. Supplementary Figure 4A and 4B shows that zip code average annual household income inversely correlated with zip code population and population density. However, when our testing data were normalized to the respective fraction of the New York State–reported SARS-CoV-2 testing that NHL performed (Supplementary Figure 4C–F), the correlation of percentage test positivity with zip code average annual household income was eliminated. We therefore examined the relationship of NHL testing to zip code percentage of persons below the poverty level. Figure 3A shows the relationship of percentage of the population tested by Northwell per zip code to this variable, for the 2 counties in New York City for which such data were available, and NHL testing represented greater than 20% of all SARS-CoV-2 testing performed. For Queens County but not Richmond County (Staten Island), there was a significant negative correlation between percentage of testing versus percentage of the poverty level (R2 = 0.34, P < .02). Figure 3C shows the percentage of persons testing positive by Northwell for SARS-CoV-2 as a function of percentage of the poverty level. Again, for Queens, there was a negative trend in the percentage testing positive, but it did not reach significance (Figure 3C) (R2 = 0.26, P = .07).
Collectively, these economic data suggest that persons from lower income, higher population density zip codes had access to NHL-based SARS-CoV-2 testing that was comparable to the access of persons from higher income, lower population zip codes, but exhibited a higher percentage of SARS-CoV-2 test positivity rates. However, our population sampling from these respective zip codes may have differed from the overall regional SARS-CoV-2 testing as reported by New York State. This premise is supported by the higher percentage of test positivity rates experienced by NHL, particularly during the latter half of March. This may have resulted from differential presentation of higher-acuity patients from lower income zip codes to Northwell during the early phase of the pandemic, and hence differential sampling of the regional population. We cannot exclude statistical sampling variability as a confounding variable.
Figure 3B and 3D shows the relationship of percentage of the population tested by NHL and percentage test positivity, respectively, as a function of the percentage of not-White population per zip code. Statistically significant relationships are not identified, although Queens appears to reveal positive trends (Figure 3B: R2 = 0.13, P = .39; Figure 3D: R2 = 0.15, P = .31). Looking then at our data specifically, information on “White,” “Black,” or “Asian” racial status was available for 17 574 (37.6%) of the 46 793 persons tested by NHL, with only 244 patients (0.5%) reporting “Hispanic” or “Indian,” and unknown racial status for the remainder. Race information was patient-reported for less than 30% of persons below age 40 years, progressively rising to approximately 65% for the older age groups (see Supplementary Figure 5). Figure 4 shows test positivity by gender and race. For females, Asian and White test positivity rates are similar, and less than Black females. For males, Asian and Black test positivity rates are similar, and greater than White males. In aggregate, test positivity was highest in Blacks, followed by Asians and Whites (P < .0001). The respective sex differences in test positivity between the 3 racial groups also were statistically significant (P < .0001).
The relationships of test results, age, and race are further shown in Figure 5. The mean age (±SEM) of test-negative persons was 44.4 ± 0.9 years for Asians, 47.5 ± 0.6 years for Blacks, and 53.1 ± 0.3 years for Whites. The mean age (±SEM) of test-positive persons was 56.9 ± 0.6 years for Asians, 57.2 ± 0.3 years for Blacks, and 61.8 ± 0.2 years for Whites. Thus, test-positive persons were older by several years for all 3 races (P < .0001). Supplementary Tables 1 and 2 provide additional information about race, gender, age, and SARS-CoV-2 test results.
Hospitalizations
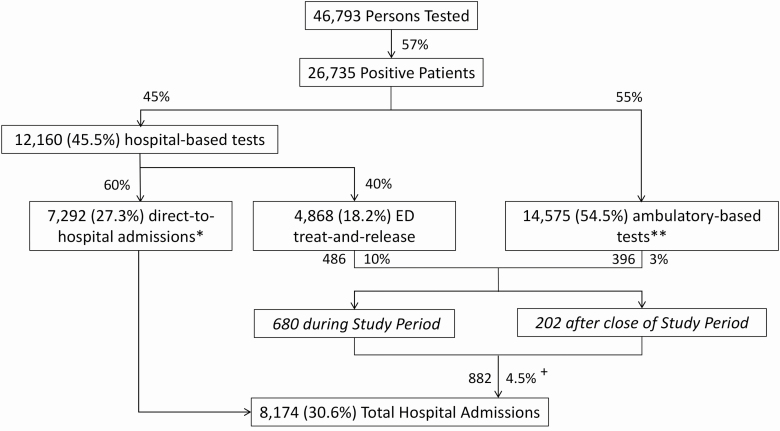
Figure 10 shows the testing locations and patient disposition for our study population, with subsequent hospitalizations monitored through 16 May 2020. A total of 8174 (30.6%) of the 26 735 SARS-CoV-2–positive patients were admitted to monitored Northwell hospitals, 7292 of whom were admitted directly upon presentation and 882 from outpatient statusThe latter group represents 4.5% of all ambulatory patients who tested positive for SARS-CoV-2. The median time between collection of their first SARS-CoV-2–positive test sample and their hospitalization was 4.8 days (IQR = 2.5–8.2; 95th percentile = 30.7 days). Notably, 486 (10%) of the patients tested in a hospital-based emergency department and released as ambulatory patients were ultimately admitted to the hospital. Conversely, 396 (3%) of the 14 575 SARS-CoV-2–positive patients who had been tested in an ambulatory setting were subsequently admitted to the hospital.
Figure 10.
SARS-CoV-2 testing locations and disposition of SARS-CoV-2–positive patients. The disposition of the 26 735 patients testing positive for SARS-CoV-2 is shown, both on the basis of the location their test sample was obtained and whether they were immediately admitted to the hospital, or admitted after being found to be positive as outpatients. Subsequent hospitalizations of SARS-CoV-2 outpatients were monitored through 16 May 2020. Percentage values given within the boxes are the percentage of 26 735 positive patients. Percentage values given next to the arrows represent the subfraction of the immediately prior box, with the exception of the 4.5%, which represents the proportion of all SARS-CoV-2–positive outpatients subsequently admitted to the hospital (882 divided by [4868 ED treat-and-release plus 14 575 ambulatory-based, equals 19 443 patients]). *ED Test Order (708) or Admission Order Set (6584). **Predominantly urgent care or ambulatory practice sites. +Median time-to-admission: 4.8 days. Abbreviations: ED, emergency department; SARS-CoV-2, severe acute respiratory syndrome coronavirus 2.
DISCUSSION
These results indicate that SARS-CoV-2 infection was already geographically widespread in the greater New York City region when testing began in early March 2020 [5], a premise supported by sequencing of viral genomes obtained from the New York area [6] and by modeling of the pandemic outbreak [7]. Given literature estimates of serial intervals between infections (4 to 6 days [1, 8]) and R0 values of 2.6 to 3.2 during the exponential period of disease outbreak [9], it is unlikely that 6 hospitalized cases from 5 geographically dispersed zip codes over the next 2 days could be explained by secondary infections from the first 4th March case, or from exposure to the first documented case in the New York City area on 1 March in Westchester County [10]. It is more likely that the initially observed cases in our study originate from multiple infection sources already present across the geographical area when testing began [7]. While the initial patients tested by NHL had already been admitted to the hospital for respiratory illness, the rapid increase in SARS-CoV-2 testing from emergency departments, urgent care centers, and ambulatory practice sites reflects the realization that patients presenting with respiratory illness were likely to have this illness [11]. As reported elsewhere, males were more likely to have a positive test, and the percentage of test positivity rates increased markedly with age for both males and females [12].
Our data reveal large spatial heterogeneity in disease progression across the greater New York metropolitan area, in keeping with the geographic diversity found in countries across the globe [13, 14]. We observed that current epidemiological models for contagion (eg, [15]) largely stratify by demographics, infection status, and location at the county level, while micro-local geography has not been included. Our observations indicate that, for accurate modeling of the progression of a pandemic through a geographic region, long-tailed spatial heterogeneity at a small scale will likely be important to incorporate.
For this entire study population of 26 735 patients testing positive for SARS-CoV-2, a total of 8174 persons (30.6%) were admitted to the hospital. This is comparable to hospitalization rates reported by the Centers for Disease Control and Prevention for cases of SARS-CoV-2 disease, for which case hospitalization statistics are known (6354 of 24 925 cases; 25.5% [16]). Our study provides the additional information that ambulatory patients testing positive for SARS-CoV-2 (either tested and released from emergency departments or otherwise tested at an ambulatory location) remain at risk for subsequent hospitalization. Our study constitutes a minimal estimate of outpatient hospitalization rates, since we did not include patients who might have been admitted to other hospitals.
The relationship of coronavirus disease 2019 (COVID-19) in the United States with socioeconomic determinants of disease is under intense investigation [17, 18]. In an analysis of COVID-19 case positivity in 5 major US municipalities including New York City [19], significant positive correlations were found between zip code percentage of SARS-CoV-2–positive rates and zip code population density, percentage of persons who were not White, and percentage of persons above age 65. Recognizing that a high proportion of SARS-CoV-2–infected individuals who die have comorbid conditions [16], the strong negative correlation of these comorbidities (obesity, diabetes, hypertension, kidney disease, chronic obstructive pulmonary disease) with median household income by US Census tracts is striking when illustrated graphically [20]. Our finding of a strong negative correlation between persons testing positive for SARS-CoV-2 and average household income by zip code for the range of $25 000 to $125 000 per annum provides further supporting evidence for the importance of these socioeconomic factors.
Due to incompleteness in our patient-level data on racial status, care must be taken in drawing conclusions about the impact of race on SARS-CoV-2 burden in our regional community, particularly given the absence of information on Latino/Hispanic persons. For the 37.7% of persons tested who did report their race (almost all as Asian, Black, or White), Blacks had the highest aggregate percentage of test positivity rates. The male predominance of test positivity was true for all 3 races, but was most pronounced for Blacks. For both genders and for all 3 races, the age distribution of persons who tested positive was significantly older than those who tested negative. We note that reporting of SARS-CoV-2 patient race and ethnicity is now required [21].
Limitations
The information reported here only includes the results from 1 integrated laboratory network serving the parent health system, and does not include other laboratory results, home tests, or other regional testing that were conducted on study subjects during the study period. The number of SARS-CoV-2 tests performed during these initial weeks was a function of the progressively increasing test capacity at NHL from 8 March 8–10 April 2020, as limited by the availability of reagents and supplies for the performance of these tests, and may have influenced the ability to detect cases in the region. We were not using zip codes for areal analysis, seeking instead to use zip codes as a mechanism to explore the chronologic timing of micro-local geographic heterogeneity. However, these results may be limited in their generalizability, because of restricted sample size and the potential selection bias that zip code grouping can introduce into geo-epidemiologic analyses [22]. Reliance on the 2010 census may also introduce inaccuracy in estimates of population cumulative case incidence, to the extent that the regional population has changed in the ensuing 10 years. Reliance on publicly available 2017 data from the US Internal Revenue Service and from the 2010 census permits correlative statements only to be made about the relationship of SARS-CoV-2 cumulative case incidence and geolocalized socioeconomic and racial factors. Last, the incompleteness of our patient-level data on racial status limits our ability to make statements about the impact of race on SARS-CoV-2 case incidence.
Conclusions
In early March, positive SARS-CoV-2 cases were identified simultaneously across the region, with higher incidences in men and older persons. Our geographic analysis supports the hypothesis that SARS-CoV-2 infection was widely distributed in the greater New York City region when virus testing became available in early March. Test percentage positivity rates were higher in patients from zip codes with a higher population density and lower average annual household income. Our data emphasize the importance of detailed chronologic, geospatial, and demographic analysis of regional populations as part of understanding the evolution of SARS-CoV-2 as a pandemic event.
Supplementary Data
Supplementary materials are available at Clinical Infectious Diseases online. Consisting of data provided by the authors to benefit the reader, the posted materials are not copyedited and are the sole responsibility of the authors, so questions or comments should be addressed to the corresponding author.
Notes
Acknowledgments. The authors acknowledge and honor all of their Northwell team members who consistently put themselves in harm’s way during the COVID-19 pandemic. This article is dedicated to them, as their vital contribution to knowledge about COVID-19 and sacrifices on the behalf of patients made it possible. The data that support the findings of this study are available on request from COVID19@northwell.edu. The data are not publicly available due to restrictions, as they could compromise the privacy of research participants.
Disclaimer. The views expressed in this paper are those of the authors and do not represent the views of the National Institutes of Health, the US Department of Health and Human Services, or any other government entity.
Financial support. This work was supported by the National Institute on Aging of the National Institutes of Health (grant number R24AG064191) and the National Library of Medicine of the National Institutes of Health (grant number R01LM012836).
Potential conflicts of interest. G. J. B. reports an honorarium for an education seminar from Hologic, Inc, outside the submitted work. K. W. D. is a member of the US Preventive Services Task Force. All other authors report no potential conflicts. All authors have submitted the ICMJE Form for Disclosure of Potential Conflicts of Interest. Conflicts that the editors consider relevant to the content of the manuscript have been disclosed.
References
- 1. Bi Q, Wu Y, Mei S, et al. Epidemiology and transmission of COVID-19 in Shenzhen China: analysis of 391 cases and 1286 of their close contacts. Lancet Infect Dis 2020. doi: 10.1016/S1473-3099(30)30287-5. Epub 27 April 2020. [DOI] [PMC free article] [PubMed] [Google Scholar]
- 2. New York State New York State statewide COVID-19 testing. Available at: https://health.data.ny.gov/Health/New-York-State-Statewide-COVID-19-Testing/xdss-u53e. Accessed 14 June 2020.
- 3. Jensen KJ, Stallone R, Breining D, et al. Northwell Health Laboratories: the 10 year outcomes after deciding to keep the lab. Arch Pathol Lab Med 2019; 143:1517–30. [DOI] [PubMed] [Google Scholar]
- 4. Hakim D. “It’s hit our front door”: homes for the disabled see a surge of COVID-19. The New York Times New: York: The New York Times Company; 2020. 9 April, Section A:1. [Google Scholar]
- 5. Rosenberg ES, Dufort EM, Blog DS, et al. COVID-19 testing, epidemic features, hospital outcomes, and household prevalence, New York State—March 2020. Clin Infect Dis 2020. May 31; ciaa684. doi: 10.1093/cid/ciaa684. Online ahead of print. [DOI] [PMC free article] [PubMed] [Google Scholar]
- 6. Maurano MT, Ramaswami S, Westby G, et al. Sequencing identifies multiple, early introductions of SARS-CoV2 to New York City Region. medRxiv [Preprint]. Published online 2020. [DOI] [PMC free article] [PubMed] [Google Scholar]
- 7. Gonzalez-Reiche AS, Hernandez MM, Sullivan MJ, et al. Introductions and early spread of SARS-CoV-2 in the New York City area. Science. 2020. 10.1126/science.abc1917 [DOI] [PMC free article] [PubMed] [Google Scholar]
- 8. Du Z, Xu X, Wu Y, et al. Serial Interval of COVID-19 among publicly reported confirmed cases. Emerg Infect Dis 2020; 26:1341–3. [DOI] [PMC free article] [PubMed] [Google Scholar]
- 9. Zhuang Z, Zhao S, Lin Q, et al. Preliminary estimates of the reproduction number of the coronavirus disease (COVID-19) outbreak in Republic of Korea and Italy by 5 March 2020. Int J Infect Dis 2020; 95:308–10. [DOI] [PMC free article] [PubMed] [Google Scholar]
- 10. Mahbubani R, Mosher D “In search of the apex and the other side of the mountain”: the coronavirus has killed more than 4100 New Yorkers in just over a month, and the worst is still to come. Business Insider; 2020. Available at: https://www.businessinsider.com/new-york-coronavirus-crisis-1-month-cases-surge-apex-2020–4. Accessed 22 June 2020. [Google Scholar]
- 11. Richardson S, Hirsch JS, Narasimhan M, et al. Presenting characteristics, comorbidities, and outcomes among 5700 patients hospitalized with COVID-19 in the New York City Area. JAMA 2020; 323:2052–9. [DOI] [PMC free article] [PubMed] [Google Scholar]
- 12. Promislow DEL. A geroscience perspective on COVID-19 mortality. J Gerontol A Biol Sci Med Sci 2020. Apr 17:glaa094. doi: 10.1093/gerona/claa094. Online ahead of print. [DOI] [PMC free article] [PubMed] [Google Scholar]
- 13. Du Z, Wang L, Cauchemez S, et al. Risk for transportation of coronavirus disease from Wuhan to other cities in China. Emerg Infect Dis 2020; 26:1049–52. [DOI] [PMC free article] [PubMed] [Google Scholar]
- 14. Nextstrain 2020; Genomic epidemiology of novel coronavirus—global subsampling. Available at: https://nextstrain.org/ncov. Accessed 29 April 2020.
- 15. Ferguson NM, Laydon D, Nedjati-Gilani G, et al. Report 9: impact of non-pharmaceutical interventions (NPIs) to reduce COVID-19 mortality and healthcare demand. London: Imperial College; 2020. [DOI] [PMC free article] [PubMed] [Google Scholar]
- 16. CDC Covid-Response Team. Preliminary estimates of the prevalence of selected underlying health conditions among patients with coronavirus disease 2019—United States, February 12–March 28, 2020. MMWR Morb Mortal Wkly Rep 2020; 69:382–6. [DOI] [PMC free article] [PubMed] [Google Scholar]
- 17. Greene SK, Levin-Rector A, Hadler JL, Fine AD. Disparities in reportable communicable disease incidence by census tract-level poverty, New York City, 2006-2013. Am J Public Health 2015; 105:e27–34. [DOI] [PMC free article] [PubMed] [Google Scholar]
- 18. Lee DC, Yi SS, Athens JK, Vinson AJ, Wall SP, Ravenell JE. Using geospatial analysis and emergency claims data to improve minority health surveillance. J Racial Ethn Health Disparities 2018; 5:712–20. [DOI] [PMC free article] [PubMed] [Google Scholar]
- 19. Guha A, Bonsu JM, Dey AK, Addison D. Community and socioeconomic factors associated with COVID-19 in the United States: zip code level cross sectional analysis. medRxiv [Preprint]. 22 April 2020. doi: 10.1101/2020.04.19/20071944 [DOI] [Google Scholar]
- 20. Serkez Y. Who is most likely to die from coronavirus? New York Times, 4 June 2020. Available at: https://www.nytimes.com/interactive/2020/06/04/opinion/coronavirus-health-race-inequality.html. Accessed 5 June 2020. [Google Scholar]
- 21. US Department of Health and Human Services. HHS announces new laboratory data reporting guidance for COVID-19 testing, 4 June, 2020. Available at: https://www.hhs.gov/about/news/2020/06/04/hhs-announces-new-laboratory-data-reporting-guidence-for-covid-19-testing.html. Embedded link to: COVID-19 pandemic response, laboratory data reporting: CARES Act section 18115 Available at: https://www.hhs.gov/sites/default/files/covid-19-laboratory-data-reporting-guidance.pdf. Accessed 21 June 2020.
- 22. Grubesic TH, Matisziw TC. On the use of ZIP codes and ZIP code tabulation areas (ZCTAs) for the spatial analysis of epidemiological data. Int J Health Geogr 2006; 5:58. [DOI] [PMC free article] [PubMed] [Google Scholar]
Associated Data
This section collects any data citations, data availability statements, or supplementary materials included in this article.


