INTRODUCTORY PARAGRAPH
The micronutrient selenium is incorporated via the selenocysteine biosynthesis pathway into the rare amino acid selenocysteine, which is required in selenoproteins such as glutathione peroxidases and thioredoxin reductases1,2. Here we show that SEPHS2, an enzyme in the selenocysteine biosynthesis pathway, is essential for survival of cancer but not normal cells. SEPHS2 is required in cancer cells to detoxify selenide, an intermediate that is formed during selenocysteine biosynthesis. Breast and other cancer cells are selenophilic due to a secondary function of the cystine/glutamate antiporter SLC7A11 in promoting selenium uptake and selenocysteine biosynthesis, which by allowing production of selenoproteins such as GPX4, protects cells against ferroptosis. However, this activity also becomes a liability for cancer cells as selenide is poisonous and must be processed by SEPHS2. Accordingly, we find that SEPHS2 protein levels are elevated in human breast cancer patient samples and loss of SEPHS2 impairs growth of orthotopic mammary tumor xenografts in mice. Collectively, our results identify a vulnerability for cancer cells and define the role of selenium metabolism in cancer.
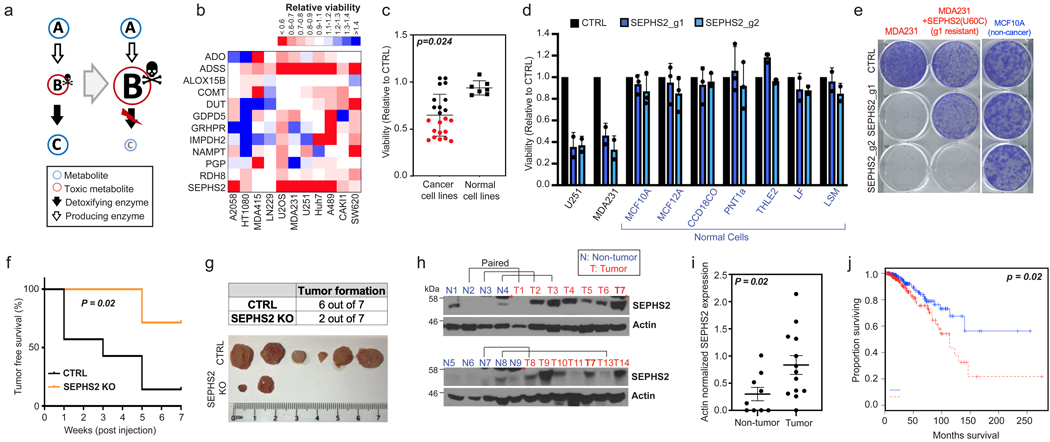
Altered metabolism is a hallmark of cancer3, and enzymes that produce metabolites required by cancer cells are attractive targets for therapy. However, targeting these enzymes may have limited efficacy when the same metabolites are available in the tumor environment, or can be produced through alternative routes4. As an alternative therapeutic approach, we set to identify metabolic enzymes that may be required in cancer cells to prevent the buildup of toxic metabolites (Fig. 1a). To first identify endogenously produced toxic metabolites, we cross-examined the metabolites in the human metabolic network with toxicological data from the NIH Toxicology Data Network (TOXNET)5. The enzymes that use these toxic metabolites as substrates according to the Kyoto Encyclopedia of Genes and Genomes (KEGG)6 were designated as putative detoxifying enzymes, and a panel of these were examined for their role in cell viability (Extended Data Fig. 1).
Figure 1. Identification of SEPHS2 as an enzyme that is selectively essential to cancer cells and is a potential therapeutic target.
(a) Toxic metabolite poisoning strategy. If B is a toxic metabolite, and the downstream (detoxifying) enzyme is disrupted, toxic accumulation of B rather than the loss of C may cause toxicity. (b) Heat map representing the impact of KO of each putative detoxifying enzyme (rows) on viability (measured as described in methods) of different cancer lines (columns). Values are relative to the same cells expressing nontargeting guide (= 1.0); red indicates a decrease and blue indicates an increase in viability. Detoxifying enzyme information is in Extended Data Figure 1. (c) Dot plot of effect of SEPHS2 KO on viability of 22 cancer cell lines and 7 noncancer (nontransformed and primary) cell lines of varying tissue origin, each dot representing one cell line. Values are relative to the same cells expressing nontargeting guide (= 1.0). Detailed information on cell lines and viability data for b and c are shown in Table S2. (d) Viabilities of noncancer lines following KO with guides against SEPHS2 (blue bars) for 9 days. Values are relative to the same cell lines expressing nontargeting guide (black bars) (=1.0). SEPHS2 KO efficiency for each line is shown in Extended Data Figure 9. (e) Crystal violet staining showing colony forming ability of MDAMB231 cells, MDAMB231 cells overexpressing guide1-resistant SEPHS2_U60C, and MCF10A cells, following SEPHS2 KO via guide 1 and guide 2. (f) Kaplan-Meier plot of tumor-free survival for mice orthotopically injected with SEPHS2 KO or CTRL KO MDAMB231 cells. n=7 mice for each condition. (g) Tumor formation data and ex vivo images of the tumors at endpoint. (h) SEPHS2 immunoblots from patient breast cancer tissue and normal breast tissues. Paired samples from the same patient are indicated. Red asterisk indicates a nonspecific band present in mammary tissue. (i) Quantification of SEPHS2 protein band intensities from h, normalized to that of actin; each dot represents one sample from h. (j) Overall survival estimates of human breast carcinoma patients from TCGA database based on SEPHS2 expression, SEPHS2 Low n=180 and SEPHS2 High n=191. For d, each point is an average from biological triplicates from an independent set; For c,d,i,; error bars are S.E. p values are calculated using student’s two-tailed t test.
CRISPR/Cas9 based gene disruption7 of several of these enzymes impaired cell viability in one or more of the cell lines tested (Fig. 1b). Loss of SEPHS2 was particularly detrimental, causing over 40% loss of viability in six of the 11 cell lines tested, including the breast cancer line MDAMB231 and the glioma line U251 (Extended Data Fig. 2a). We designated SEPHS2 as a candidate detoxifier because its annotated substrate is selenide (H2Se), a compound which has been reported to be toxic in accidental industrial or laboratory exposure cases8,9. Expanding our testing to additional cancer lines and to nontransformed cells, we found that SEPHS2 knockout (KO) is toxic to 12 out of 22 cancer cell lines but none of the 7 normal cell lines tested (Fig. 1c and Table S2). SEPHS2 KO in cancer cells induced loss of cell proliferation (Extended Data Fig. 2a), loss of colony-forming capacity (Fig. 1e), and cell death (Extended Data Figs. 2b,3a-d). Notably, loss of SEPHS2 was nontoxic to all normal (non-transformed immortalized, or primary) lines that we tested, such as the mammary epithelial lines MCF10A and MCF12A, as well as primary lung and colon fibroblasts (Fig. 1d), despite efficient KO (Extended Data Fig. 9a). Furthermore, MCF10CA1h cells, which are HRAS transformed, phenotypically malignant versions of MCF10A cells10, are sensitive to SEPHS2 KO (Extended Data Fig. 2c and 9a), providing an isogenic model for SEPHS2 dependency in transformation and malignant progression. Importantly, overexpression of a mutant form of SEPHS2 (SEPHS2_U60C) that is resistant to one of the guide RNAs (g1) rescued cells from the toxic effects of SEPHS2 KO from the corresponding guide demonstrating that the observed toxicity was not due to off target effects of CRISPR (Fig. 1e, Extended Data Fig. 2d,e). Furthermore, we verified that SEPHS1 does not carry out an analogous function to SEPHS2 (Extended Data Fig 2i,j), as previously indicated11. Thus, SEPHS2 is an enzyme that is essential for survival in many cancer cells but is surprisingly dispensable in normal cells.
To validate these findings in vivo, we disrupted SEPHS2 in an orthotopic xenograft model for breast carcinoma. Loss of SEPHS2 resulted in a significant improvement in tumor-free survival of the host (Fig. 1f), which appeared to be due to a combination of reduced tumor formation (Fig. 1g) and average tumor weight and volume (Extended Data Fig. 2f,g). The few SEPHS2 KO tumors that did form showed varying expression of SEPHS2 protein levels, suggesting both an expansion of cells that escaped KO, and adaptation of KO cells to allow survival (Extended Data Fig 2h). Meta-analyses of SEPHS2 gene expression in cancer and normal tissues revealed that SEPHS2 is overexpressed at mRNA level across many types of tumors relative to their normal tissue counterparts, including breast cancer (Extended Data Fig. 4a-c). SEPHS2 protein was also significantly upregulated in human breast cancer patient tissues compared to normal breast tissue (Fig. 1h,i). Significantly, SEPHS2 expression was associated with poor survival across breast cancer patients (Fig. 1j). These results demonstrate that SEPHS2 is an enzyme that is both overexpressed in and required for the survival of breast cancer cells. Collectively these findings indicate SEPHS2 to be a highly attractive target for cancer therapy, which may be druggable, as SEPHS2 is a metabolic enzyme with hydrophobic substrate pockets12.
SEPHS2 is required for production of selenoproteins, a group of 25 proteins containing selenocysteine residues which include antioxidant enzymes such as GPX4 and TXNRD11,2,11. Thus, it was surprising that SEPHS2 was not essential for survival of normal cells. SEPHS2 phosphorylates selenide to form selenophosphate, which serves as the selenium donor for the biosynthesis of selenocysteinyl-tRNA by phosphoryl-tRNA kinase (PSTK) and O-phosphoserine tRNA-selenocysteine tRNA synthase (SEPSECS) (Fig. 2a). Disruption of any of these enzymes resulted in a dramatic decrease in selenoprotein levels (Fig. 2b), including that of SEPHS2 itself as it is also a selenoprotein. Strikingly, the nontransformed MCF10A cells subjected to SEPHS2 KO maintained their growth rate across 28 days, despite having lost SEPHS2 and the capacity to express selenoproteins (Fig. 2c,d). However, SEPHS2 KO in MDAMB231 cancer cells exerted a severe reduction in growth rate that ultimately recovered around day 20 (Fig. 2c). SEPHS2 and several selenoproteins were initially depleted in the population but then recovered between days 16 to 20 (Fig. 2d). This indicated that SEPHS2 KO cells were strongly selected against and died out, with the population being replaced by wild type cells which escaped CRISPR KO. Collectively, these results indicate that normal cells require neither SEPHS2 nor selenoprotein production for their survival and proliferation under basal conditions.
Figure 2. SEPHS2 is dispensable to nontransformed cells despite being required to produce selenoproteins.
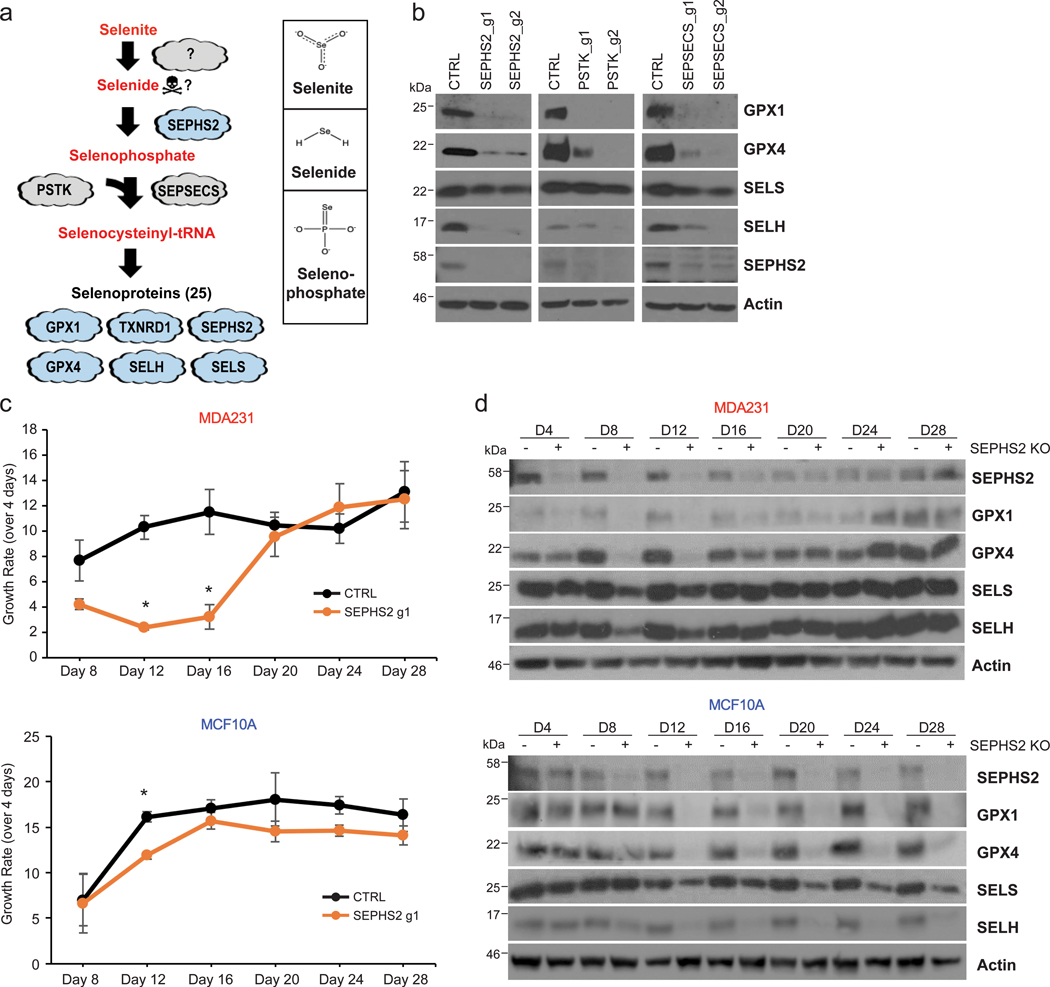
(a) Diagram of selenocysteine biosynthesis pathway and chemical structure of selenite, selenide and selenophosphate. (b) Immunoblots of selenoprotein expression in MDAMB231 cells subjected to (CRISPR/Cas9-induced) KO with guides against the selenocysteine biosynthesis pathway enzymes SEPHS2, PSTK, SEPSECS, or control guides for 11 days. (c) Long-term monitoring of growth rates of MDAMB231 cells and MCF10A cells subjected to (CRISPR/Cas9-induced) KO with guides against SEPHS2 or CTRL, over the course of 28 days. Each point represents the fold change of growth over the previous 4 days. (d) Immunoblots of selenoproteins of MDAMB231 and MCF10A cells taken at each timepoint from Figure 2c. For c, n=3 biological replicates; error bars are S.E. For all panels, *p<0.05 (student’s two tailed t test).
As selenoprotein production by SEPHS2 per se was not essential for cell survival, we considered the hypothesis that cancer cells may have a selenium detoxification demand that normal cells do not have. Interestingly, in the 1960s it was observed that radioactive selenite (SeO32-), a common dietary form of selenium, has preferential accumulation in tumors, and this was briefly explored as a tumor labeling strategy13,14. Therefore, we examined whether we could recapitulate this selenium uptake in cancer cell lines, as this may determine the requirement for detoxification. As excessive selenite is toxic to cells15, we carried out a focused CRISPR screen to identify genes required for selenium import, assuming that knockout of genes necessary for either selenite import or selenide production would prevent selenite toxicity. The 21 candidate genes were selected based on literature search and on homology from selenium transporters in other species (Extended Data Fig. 5a). Knockout of SLC7A11 and SLC3A2, the two components of the xCT cystine/glutamate antiporter16,17, rescued against selenite sensitivity (Fig. 3a, Extended Data Fig. 5b,c), and SLC7A11 KO prevented selenium accumulation in cells treated with selenite (Fig. 3b). In examining a panel of breast cancer and nontransformed lines, we found that cells that express elevated levels of SLC7A11 take up more selenium (i.e. are ‘selenophilic’) in comparison to normal and cancer cells with little or no SLC7A11 (Fig. 3c,d). Thus, SLC7A11 is required for selenium import and for the toxic effects of selenite in cancer cells.
Figure 3. SLC7A11-mediated reduction of selenite is the initial step of the selenocysteine biosynthesis pathway in cancer cells, and protects against ferroptosis.
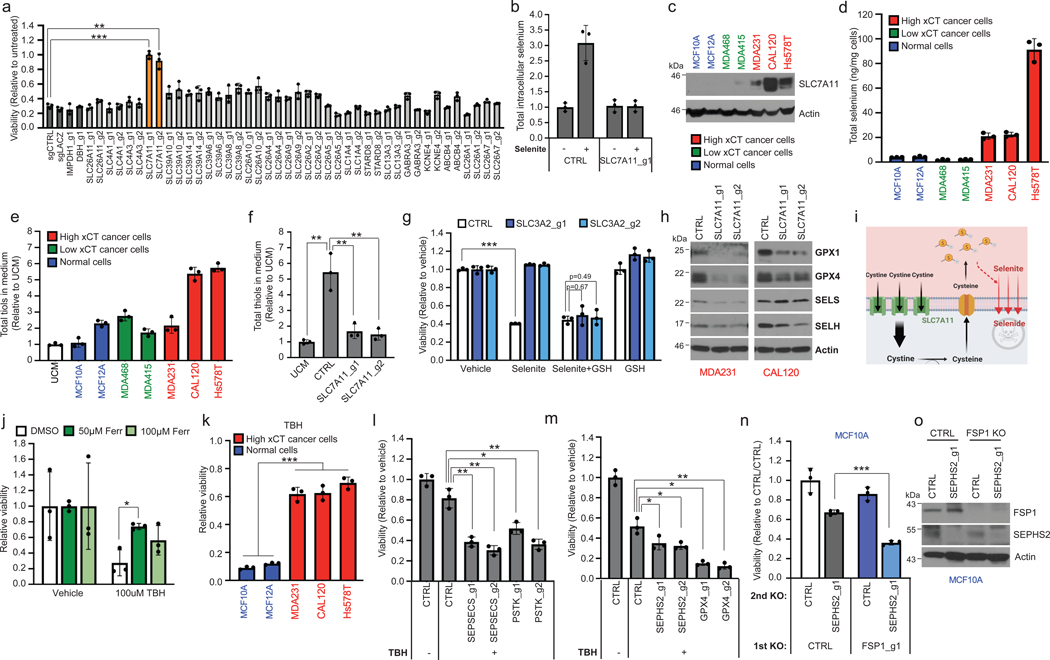
(a) Viability of U251 cells subjected to KO with guides against various control genes (dark gray bars) or against candidate selenium transporters, then 48h treatment with 12 μM sodium selenite. Values are relative to the same KO cells treated with vehicle (=1.0). (b) Selenium uptake in U251 cells either with or without SLC7A11 depletion. Total intracellular selenium was quantified following 12 μM selenite supplementation of for 2 hr in U251 cells. Values are relative to CTRL treated with vehicle (=1.0). (c) Immunoblots of SLC7A11 in a panel of breast cancer and normal breast lines. Non-cancer lines are in blue, low SLC7A11 expressing cancer lines are in green, and high SLC7A11 expressing cancer lines in red here and in subsequent histograms. (d) Selenium uptake in the same panel of lines. Total intracellular selenium levels were measured following treatment with 12 μM selenite for 2 hr. (e) Total thiol quantification of 24hr conditioned media from the panel. Each value was normalized to that of unconditioned media (UCM) for every thiol quantification assay. (f) Viability of control and SLC3A2 KO MDAMB231 cells treated with vehicle, 12 μM sodium selenite, and/or 75 μM reduced L-glutathione for 72 hr. Values are relative to the same cells treated with vehicle (=1.0). (g) Total thiol quantification of 24 hr conditioned media from CTRL KO and SLC7A11 KO MDAMB231 cells. (h) Immunoblots of selenoproteins in triple negative breast cancer cells subjected to KO with guides against SLC7A11 for 11 days. (i) Graphical summary of Figure 3. (j) Viability of MDA231 cells pretreated with ferrostatin for 3 hr and then treated with vehicle or 100μM TBH for 48 hr. Values are relative to the same cells treated with vehicle (=1.0). (k) Viability of selenophilic cancer cell lines (red) and nonselenophilic normal lines (blue) treated with 100μM TBH for 24 hr. Values are relative to the same cells treated with vehicle (=1.0). (l) Viability of MDA231 cells subjected to KO with guides against SEPSECS or PSTK for 5 days then treated with vehicle or 50μM TBH for 6 hr. Values are relative to the same cells treated with vehicle (=1.0). (m) Viability of MDA231 cells subjected to KO with guides against SEPHS2 or GPX4 for 5 days and then treated with vehicle or 250μM TBH for 24 hr. Values are relative to the same cells treated with vehicle (=1.0). (n) Viability of MCF10A cells subjected to sequential gene KO as shown. Values are relative to the cells subjected to CTRL KO then subjected to CTRL KO (=1.0). (o) Immunoblots of FSP1 and SEPHS2 from n. FSP1 expression did not significantly differ between SEPHS2 sensitive lines and insensitive lines (Extended Data Figs 6e). For a, d-g and j-n, n=3 biological replicates; for b, n=3 technical replicates; error bars are S.D. For d and e, while trends can be seen, statistical comparisons were not carried out due to variability between cell lines. For all panels, the measure of center is mean. For all panels, *p<0.05, **p<0.01, and ***p<0.001 (student’s two-tailed t test).
It was shown that import of cystine by xCT results in its intracellular reduction to cysteine and subsequent export, which increases extracellular reduction potential in the form of reduced thiol groups from cysteine, which may be involved in selenium uptake18. Indeed, selenophilic cells had increased extracellular thiols (Fig. 3e), which was dependent on xCT (Fig. 3f, Extended Data Fig. 5d,e). xCT allows selenium uptake via extracellular reduction of selenite, rather than acting as its physical transporter, as providing extracellular thiols by adding glutathione to media sensitized cells to selenite toxicity even in the absence of functional xCT (Fig. 3g). We hypothesized that the reduction of selenite to selenide through this mechanism is sufficient for selenium import, as selenide is highly volatile. The reduction of selenite is key to its toxicity, as we can completely prevent or induce toxicity by modulating extracellular thiol levels (Fig. 3a,g). Disruption of SLC7A11 resulted in reduced selenoprotein expression (Fig. 3h), demonstrating its role in promoting selenoprotein production. Collectively, these results indicate the following model for SLC7A11 (Fig 3i): the elevated expression of SLC7A11 in selenophilic cancer cells results in increased cystine import, reduction of cystine to cysteine in the cell, and export via an undetermined exporter. This results in the extracellular accumulation of thiols (from cysteine) which can reduce selenite to volatile selenide and induce both its import into the cell, and cellular toxicity. It is known that upregulation of SLC7A11 results in increased glutathione production via cystine import in cancer19. The moonlighting role of SLC7A11/xCT in allowing selenium uptake and selenocysteine biosynthesis provides an elegant mechanism for the coordination of increased glutathione production with increased production of selenoprotein enzymes (GPXs) that utilize them. Furthermore, this mechanism explains the decades-old observation of increased selenium uptake in cancer cells13,14 and suggests a role for selenium uptake in cancer cell biology, particularly involving the selenoproteins that are produced as a result. SLC7A11 is regulated by crucial cancer genes such as p5320, and we speculate that these canonical cancer pathways may thus affect selenocysteine biosynthesis.
Selenoproteins such as GPX4 has been implicated in protecting cancer cells against various insults such as ferroptosis or chemotherapeutic drugs21,22, so we examined whether selenophilicity is associated with increased resistance to such insults. We found that the selenophilic breast cancer cells had increased resistance against the ferroptosis-inducing prooxidant tert-butyl hydroperoxide (TBH), as well as against nutrient starvation and hypoxia, in contrast to the nonselenophilic normal cells (Figure 3j,k and Extended Data Fig. 6a,b). We did not note any association of SEPHS2 or GPX4 expression with any tumor environmental features (Extended Data 7a-f) nor with hypoxia in culture (Extended Data Fig. 7g). Knockout of SEPHS2 or GPX4 did not sensitize the selenophilic cancer cells to hypoxia or nutrient starvation, suggesting that other mechanisms downstream of SLC7A11 are involved in their protection against these insults (Extended Data Fig. 6c,d).
In contrast, disruption of selenocysteine biosynthesis via SEPHS2, PSTK or SEPSECS KO, or KO of GPX4 itself, sensitized them against TBH (Figure 3i,m), suggesting a role for the selenocysteine biosynthesis pathway in protecting cancer cells against ferroptotic insults in selenophilic cancer cells. Furthermore, the cell death induced by SEPHS2 KO was partially rescued by ferroptosis inhibitors ferrostatin and liproxatin, suggesting that loss of GPX4 and sensitization to ferroptosis may facilitate the toxicity of SEPHS2 KO (Extended Data Fig 3e). Recently, FSP1 was identified as an endogenous inhibitor of ferroptosis23,24. Knockout of FSP1 in the MCF10A cells, which were normally resistant SEPHS2 KO toxicity, rendered them sensitive (Figure 3n,o). The function of FSP1 explains how these cells can tolerate SEPHS2 KO, even though it results in loss of GPX4. Collectively these results indicate that selenocysteine pathway upregulation is advantageous to cancer cells against ferroptosis, while its loss is tolerable to nontransformed cells due to the presence of antiferroptotic mechanisms. Furthermore, the toxicity of SEPHS2 KO in cancer cells is facilitated by their hypersensitization to ferroptosis.
While SLC7A11-driven selenophilicity provides an protective advantage against ferroptosis through selenoprotein (GPX4) production, we hypothesized that it will also introduce a requirement to detoxify selenium, in particular the pathway intermediate selenide. Illustrating this double-edged aspect of selenium, increasing doses of selenite supplementation in the selenophilic MDA231 cells resulted in a dose dependent increase in GPX4 levels (Extended Data Fig. 8a). However, at higher doses GPX4 expression plateaued, along with the formation of reactive oxygen species (ROS), which is a predicted product of selenide in aqueous solutions25. Furthermore, overexpression of catalase (CAT), which decomposes one form of ROS (H2O2), partially rescued SEPHS2 toxicity (Extended Data Fig. 8c-e). These results suggest that SEPHS2 and selenocysteine biosynthesis pathway sequesters free intracellular selenium (such as in the form of selenide) to form beneficial selenoproteins, but beyond a threshold, the free intracellular selenium not incorporated into selenoprotein can harm cells via ROS formation. Further supporting this notion, selenium delivered via selenocysteine-containing peptide26, while similarly inducing GPX4 expression, did not induce ROS formation (Extended Data Fig. 8a,b).
To directly examine whether SLC7A11 makes cells dependent on SEPHS2, we preemptively knocked out or pharmacologically inhibited SLC7A11 prior to SEPHS2 KO (Fig. 4a and Extended Data Fig. 5f-h). We found that not only could cells tolerate SLC7A11 loss, but also this fully prevented the toxicity of subsequent SEPHS2 KO, demonstrating that SLC7A11 directly causes a dependency on SEPHS2, and indicating a gain-of-function mode of toxicity.
Figure 4. Essentiality of SEPHS2 in cancer cells is due to its role as a selenide detoxifying enzyme.
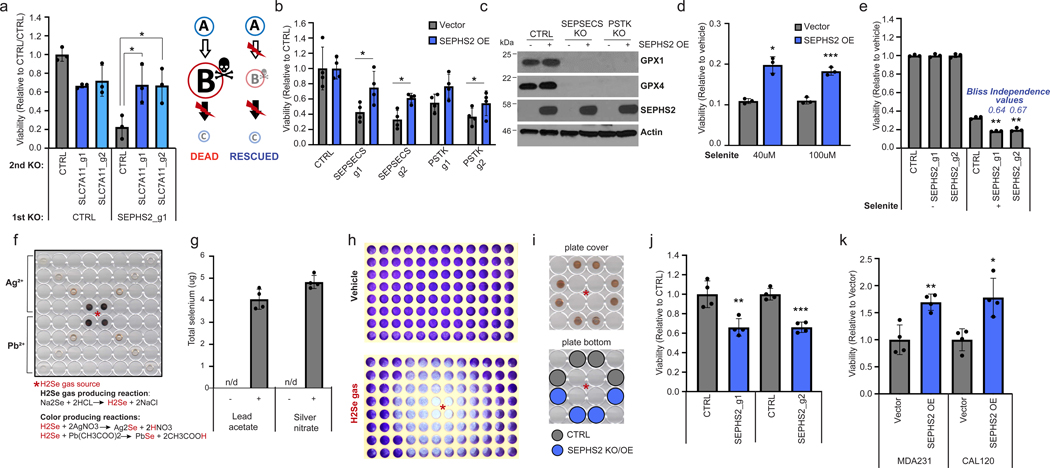
(a) Viability of MDAMB231 cells subjected to sequential gene KO as shown, demonstrating that preemptive loss of SLC7A11 renders SEPHS2 dispensable. Values were normalized to the cells subjected to CTRL KO and then subjected to CTRL KO (=1.0). (b) Viability of U251 cells overexpressing blank vector or SEPHS2_U60C and subjected to KO with guides against SEPSECS or PSTK for 11 days. (c) Immunoblot of selenoproteins in U251 cells overexpressing blank vector or SEPHS2_U60C and subjected to KO with guides against SEPSECS or PSTK for 11 days. (d) Viability of U251 cells overexpressing blank vector or SEPHS2_U60C and treated with sodium selenite for 48 hr. Values are relative to the same cells treated with vehicle (=1.0). (e) Viability of U251 cells subjected to KO with guides against SEPHS2 or CTRL and then treated with 12 μM sodium selenite for 72 hr. (f) Scanned image of the polystyrene microplate cover spotted with silver nitrate or lead acetate embedded PVP, used as a non-contact selenide gas indicator, after selenide gas exposure for one min. (g) Selenium quantification, measured by ICP-MS, of the silver nitrate and lead acetate embedded PVP spots demonstrating the capture of volatile selenide. 4 spots equidistant from the selenide source were measured. (h) Scanned image of crystal violet staining of remaining MDAMB231 cells following vehicle or selenide gas exposures for 24 hr. For f and h, asterisk indicates the location of selenide gas production. (i) Experimental layout for comparing sensitivity to selenide gas, via equidistant cell plating. Similar browning of silver nitrate/PVP spots indicate similar exposure levels to selenide gas. (j) Viability of SEPHS2 KO or control MDAMB231 cells under selenide gas exposures for 24 hr. Values were normalized to the viability of non-targeting sgRNA transduced cells (=1.0). (k) Cell viability of MDAMB231 cells overexpressing SEPHS_U60C or blank vector which under selenide gas exposure for 48 hr. Values were normalized to the viability of empty vector transduced cells (=1.0). For a,b and d,e n=3 biological replicates, for j,k n = 4 biological replicates, for g, n=4 technical replicates; error bars are S.D. For all panels, the measure of center is mean. For panels a and c-k, *p<0.05, **p<0.01, and ***p<0.001 (student’s two tailed t test). For b, *p<0.05 (student’s two tailed, paired t test).
To further determine whether SEPHS2 has a function that is independent of its role in selenoprotein synthesis, we took advantage of the fact that KO of the other selenocysteine biosynthesis components PSTK or SEPSECS can also eliminate selenoprotein production including that of SEPHS2. We constructed a mutant SEPHS2 (SEPHS2_U60C) with a selenocysteine to cysteine mutation that is predicted to decrease but not eliminate catalytic activity27, while allowing it to be expressed even when selenocysteine biosynthesis is halted due to SEPSECS or PSTK KO. We demonstrated that this enzyme is functional, as it rescued SEPHS2 KO in our earlier experiment (Fig. 1e). Expression of this construct was found to rescue the toxicity of SEPSECS or PSTK KO despite inability to express any other selenoprotein (Fig. 4b,c), which demonstrates that 1) SEPSECS/PSTK KO is toxic because of the loss of SEPHS2 that they cause, and 2) SEPHS2 impacts viability even when all selenoprotein biosynthesis has ceased. The rescue was not complete, indicating that loss of other selenoprotein(s) such as GPX427 may have partially contributed to the toxicity. Collectively, these data demonstrate that SEPHS2 is required in cancer cells for another reason than for producing selenoproteins.
We next examined whether SEPHS2 is required in cancer cells to detoxify the selenide produced during the selenocysteine biosynthesis pathway. Supporting this model, overexpression of SEPHS2 protected cancer cells against the toxicity of selenite, whereas loss of SEPHS2 created a synergistic effect with selenite (Fig. 4d, e). As selenide is volatile and cannot be detected by conventional LC-MS methods28,29 nor treated as a conventional toxic drug, we had to develop a system for treating selenide to cells in a controlled manner, as well as a method for directly detecting selenide. First, we dissolved sodium selenide (Na2Se) in an acidic (3.7% HCl) solution, which is predicted to produce selenide (H2Se) via replacement reaction (Fig. 4f). To detect whether selenide gas was produced, we embedded silver nitrate or lead acetate, which have been shown to react with selenide in aqueous solution to produce dark brown metal-selenium compounds30, into polyvinylpirolidone (PVP) as an immobilizing matrix, and these spots were placed on the lid of 96-wells at varying distances from the gas producing compartment. A color change was observed that directly correlated with distance, suggesting the capture of volatile selenide in these spots (Fig. 4f and Extended Data Fig. 10f). Importantly, inductively-coupled plasma mass spectrometry (ICP-MS) of these spots indicated the robust presence of selenium, verifying that we are capturing volatile selenide gas (Fig. 4g). When this reaction was conducted in the middle compartment of a 96-well plate confluent in each well with MDAMB231 cells, we observed toxicity that followed a radial pattern emanating from the gas source, with toxicity correlating with proximity (Fig. 4h and Extended Data Fig. 10g). Using this treatment system, we directly tested the effects of disrupting or overexpressing SEPHS2 on cells plated at equal distances from the selenide gas source (Fig. 4i). Disruption of SEPHS2 sensitized (Fig. 4j), and overexpression of SEPHS2 protected (Fig. 4k), cancer cells against selenide. Therefore, these results clearly demonstrate that SEPHS2 has a selenide detoxification function.
In summary, we have shown how selenium uptake and selenocysteine biosynthesis is aberrantly activated in a subset of cancer cells due to SLC7A11/xCT, and how this necessitates selenide detoxification by SEPHS2. The identification of ‘selenophilic’ subsets of cancer cells has important implications in cancer biology for future investigative efforts to address, as selenium uptake drives the expression of selenoproteins implicated in processes such as ferroptosis, drug resistance, and ER stress1,21,22. While upregulation of selenoprotein production via the SLC7A11/SEPHS2 axis is likely to impact various aspects of cancer biology, we demonstrate that the most urgent requirement in these cancer cells is the detoxification of selenide, an endogenously produced metabolite that shows high volatility and toxicity. Indeed, our functional demonstration of selenide as the toxic intermediate of selenocysteine biosynthesis explains the longstanding paradox of how selenium, an essential micronutrient, can also be toxic and anticarcinogenic. Targeting the selenide detoxifier SEPHS2 allows us to kill cancer cells with efficacy and precise selectivity, serving as a blueprint for future studies to exploit other toxic metabolite containing pathways.
METHODS
Materials Used
Details for all chemicals, DNA constructs, antibodies, and other materials are provided in Table S3. Details for all cell lines are provided in Supplementary Table S2. Information and requests for reagents and resources should be directed to and will be fulfilled by the Corresponding Author, Dohoon Kim (dohoon.kim@umassmed.edu).
Cell lines and cell culture
All cell lines were cultured at 37°C under 5% CO2 and atmospheric oxygen. The cell lines used in this paper are listed in Supplementary Table S2 with information of their media and source. Short tandem repeat (STR) – based cell line verification information is also provided in Supplementary Table S2. In certain instances, in the figures due to space constraints MDAMB231 and MDAMB415 are abbreviated as MDA231 and MDA415, respectively.
Molecular cloning of expression constructs
SEPHS2 was PCR amplified from cDNA produced from WM115 cells, using primers containing BamH1 and NOT1 sites for forward and reverse primers, respectively. The verified amplicon sequence corresponded exactly to the published consensus sequence for SEPHS2 (CDS ID: CCDS42150.1). The amplicon was cloned into pLV-EF1α-IRES-Blast vector. SEPHS2_U60C was constructed with a region (bp 180 A>C for U60C and bp 616 to 638 GGAGGGACGGCAGTGACCGGTGG >GGAGGGACCGCCGTTACTGGTGG for SEPHS2 CRISPR guide 1 resistance) mutated by site-directed mutagenesis for CRISPR resistant SEPHS2_U60C. Wild type SEPHS2 has a UGA codon (amino acid position 60) which acts to encode selenocysteine due to the presence of a stem-loop structure in the 3’UTR called the selenocysteine insertion sequence (SECIS). In our SEPHS2_U60C construct, the codon is mutated to cysteine and the SECIS removed to allow expression independently of selenocysteinyl-tRNA availability, and 4 silent mutations are present in the guide recognition site for SEPHS2_g1. All primer sequences are described in the Key source table.
Lentivirus production and CRISPR/Cas9-mediated genome editing in cell lines
Optimal guide RNA sequences were obtained from a published guide sequence library31. Pseudotyped lentivirus was produced by co-transfecting pLentiCRISPR v2 containing guide sequences of interest7 with the VSV-G envelope plasmid and the Delta-Vpr packaging plasmids into HEK293T cells using X-tremeGENE 9 Transfection Reagent (Roche). Lentivirus-containing supernatant was collected at 24 hr after fresh media replacement. The virus was directly used without concentration. Target cells were infected with freeze and thawed viral supernatant in the presence of 10 μg/ml polybrene for 24hr and then replaced in media with puromycin (typically at 1 μg/ml) or blasticidin (typically, 20 μg/ml) to select for transduced cells. All guide sequences are listed in Supplementary Table S1. The titer for each virus was determined, and cells were infected at sub-one multiplicity of infection to prevent nonspecific toxicity that can occur from superinfection leading to excessive expression of Cas9 and guide.
Determining relative cell viability following CRISPR/Cas9 KO
Varying numbers of cells for each cell line (between 1,000 and 5,000 cells per well in each 96 well) were plated, and 1 day after plating, cells were infected with lentivirus and polybrene. As each cell line has different growth rates, infectivity to pseudotyped lentivirus, and sensitivity to puromycin, each of these parameters had to be optimized for each cell line. Briefly, the goal was to adjust the starting number of cells and the amount of virus for each cell line, so that after 3 days of puromycin selection, roughly 100–200 infected cells survived selection and were visible in the well. This low number ensured a low multiplicity of infection, and that cells were not reach confluency before the end of the experiment, which would introduce noise.
For each CRISPR guide / cell line combination, and measured cell viability (using CellTiterGlo) at two points post infection and selection (Day 5 and Day 9). For each combination, the relative growth as measured by fold change increase of CellTiterGlo signal between these two timepoints was calculated and compared to the growth rate of that cell line transduced with nontargeting (CTRL) guide. For example, if U2OS cells grew 5.0-fold under CTRL guide between Day 4 and Day 9, whereas U2OS cells grew 2.5-fold under a guide X, then guide X would have a relative viability score of 0.5. This system allowed us to precisely control for both the different growth rates and infectivity of different cell lines, as well as variabilities in starting number of infected cells which arise even with titered virus. In this manner, the effects of KO for each of the 12 candidate detoxifying enzymes, 3 guides each, were determined across 11 different cells lines for the initial analyses (Fig. 1b). As we expanded to examine SEPHS2 KO effect in more cell lines (Fig. 1c), we utilized two guides (SEPHS2_g1 and SEPHS_g2). The individual guides are averaged to represent SEPHS2 effect.
Long term growth monitoring of MDAMB231 and MCF10A CRISPR/Cas9 knockout lines
MDAMB231 and MCF10A cells were infected with lentivirus to transduce CRISPR/Cas9 with guides against CTRL or SEPHS2 (guide 1), each in 10 cm dish format. The day after infection as counted as day 1. Every 4 days, cell counts were obtained and recorded, and 500,000 cells were replated onto a new 10 cm dish, to have sufficient cells to continue the experiment allow monitoring the growth rate of these 500,000 cells over the next 4 days. Leftover cells not replated were lysed for Western blot analyses as shown in Fig. 2d. This step was repeated every 4 days to continually monitor the growth rate of each cell line.
Colony formation assay
MDAMB231 cells expressing SEPHS2_U60C or blank vector, and MCF10A cells were infected with SEPHS2 KO or CTRL virus. After 6 days of selection, the cells were seeded at a density of 2,000 MDAMB231 cells or 500 MCF10A cells per well in 6-well plates with 2ml media, MCF10A cells being plated at lower density due to their higher proliferation rate. 500ul of media was added in each well every 4 days without media change. Nine days after the initial cell seeding, cells were washed with PBS, and stained for 1 hr with 0.5% crystal violet in 25% methanol/75% PBS solution. Plates were then washed twice with PBS to remove excess dye and scanned.
Western blot analysis
Briefly, cells were quickly washed with cold PBS and lysed in cold RIPA lysis buffer freshly supplemented with protease inhibitor (Roche). Supernatant was collected after centrifugation at 13,000g at 4°C for 10 min. Protein concentration was determined by Bradford assay. Proteins were denatured in 6X Laemmli buffer (Boston bioproducts) and boiled at 90°C for 5 min. We found that not boiling the sample was required for SLC7A11 detection. Equal amounts of total protein (typically, 15–25 μg based on experiment) were loaded per lane on a polyacrylamide gel and analyzed by standard immunoblotting. Primary antibody dilutions are provided in the Reporting Summary. Immunoblot signals were detected by ECL, Pico or diluted Femto substrate (Pierce).
Cell viability assay
Cell viability was measured by CellTiter-Glo Luminescent Assay (Promega) using a Beckman Coulter DTX880 Multimode plate reader. Luminescence capture was set at 1.0 sec. Crystal violet staining was performed to visualize surviving cells following hydrogen selenide gas exposures in 96 well plate (Fig. 4h). Briefly, 8000 cells were plated in two 96 well plates. Next day, hydrogen selenide gas producing reaction mixture was placed in the center of the plate, and the plate was tightly sealed in the plastic bag. The plate sealed in the plastic bag was placed in the CO2 incubator. After 24hr incubation, cells were washed with PBS, and stained for 1 hr with 0.5% crystal violet in 25% methanol/75% PBS solution. Plates were then washed twice with PBS to remove excessive dye and scanned.
Medium thiol quantification
Cells were washed once with phenol red free growth media and then 10,000 cells were plated with the 100 μl of phenol red free growth media in a 96 well plate. 100 μl of conditioned media were collected and directly mixed with 50 μl of 10 mM DTNB (5,5’-dithiobis-(2-nitrobenzoic acid)) dissolved in DMSO after 24 hr conditioning. Absorbance at 450 nm was measured spectrophotometrically in 5 min (DTX880, Beckman Coulter). The remaining cells in the same plate were subjected to CellTiter-Glo assay for normalization. Absorbance value of the blank was subtracted as background, and values were normalized total viable cells as determined by CellTiterGlo. Due to the masking effect of phenol red on DTNB absorbance, created by reacting with thiols, phenol red free media was used for all thiol quantifications.
Production of selenide
Selenide gas was formed by mixing sodium selenide at a final 50 mM concentration, into 3.7% hydrochloric acid solution. Because selenide gas is volatile, 100 μl of the mixture was added into the center of 96 well plate immediately after mixing the sodium selenide with hydrochloride. Immediately following this, the plate was tightly sealed into the plastic bag. All procedures were performed in the safety hood because of the toxic and volatile nature of selenide that was produced.
Selenide detection
PVP (5% w/v) solution was mixed with 1 M silver nitrate or lead acetate at a ratio of 9:1, yielding final concentrations of 100 mM of silver nitrate or lead acetate, and 4.5% PVP. Reagents were prepared fresh for each experiment. The solutions were mixed well by pipetting. Next, 15 μl of metal/PVP mixture were carefully spotted on the inside of a 96 well plate cover. The cover was dried at room temperature for at least 1 hr to form a coating membrane. This cover containing the ‘detector spots’ is placed above wells in which selenide gas is produced in the center, and upon immediate reaction with the selenide gas formed silver selenide or lead selenide, which are brown in color compared to the clear original spot. Spots were developed for up to one min. The plate was imaged, and the spots were subjected to acid digestion for further ICP-MS analysis.
Total selenium measurement by ICP-MS analysis
Cells were plated into 15 cm dishes, media changed at 75% confluency and treated with 12 μM selenite 24 hr after media change. Cells were harvested 2 hr after selenite treatment, washed 3 times in cold PBS, and weighed to a total cellular mass of 80–100 mg. The cell pellets were treated with 500 μl 1:1 H2O2/HNO3 and allowed to stand for 12 hr at room temperature with periodic venting. The samples were then sonicated at 35 kHz and 40°C for 1 hr with periodic venting. The contents of the Eppendorf tube were transferred to a glass digestion tube with ASTM type I water (2 × 1 mL). The tubes were sealed and heated at 140°C for 2 hr, cooled and diluted to 5 mL with ASTM type I water for analysis.
All analyses were carried out with an Agilent 7500A ICP-MS system fitted with a standard concentric nebulizer, a Peltier-cooled double-pass Scott-type spray chamber, a torch shield and standard Ni interface cones. The peri-pump was set to deliver 10 g/L yttrium as an internal standard and masses at 77–78, 82, 83, and 89 were scanned using a spectrum analysis with 20 points per mass, with 3 repetitions. Interference correction was conducted on the mass at 82 amu using standard environmental correction for bromine (82 = 82–83). Following each analytical sample, the probe sample introduction system was rinsed with 10% nitric acid for 1 min to minimize carryover. Calibration curves were prepared utilizing standard solutions of Se (Ultra Scientific) and QC samples using a multi-element standard from Environmental Express. In addition, mock samples were prepared for each calibration level and subjected to the sample preparation described previously to assure adequate recovery. In all cases the recoveries were 100 ± 10% (data not shown). The calibration solutions were analyzed without background subtraction using the 89 internal standard peak. In all cases the linear regression afforded a r ≥ 0.996. The relative concentrations based on the use of the 77 and 82 isotopes were examined and found to agree within ± 10%, so the average concentration was reported.
Selenium uptake measurement by fluorometric assay
Total selenium content was measured via fluorometric assay32. Cells were plated into 10 cm dishes, media changed at 75% confluency and treated with vehicle or 12 μM selenite 24 hr after media change. Cells were harvested 2 hr after selenite treatment, washed 3 times in cold PBS, and counted to 5 million then resuspended in 100 μl MiliQ H2O and added to borosilicate glass tubes. Then 500 μl of a 4:1 mixture of HNO3 and HClO4 was added to the glass tube and incubated on a heat block overnight at 130°C. 500 μl of HCl was then added and incubated at 130°C for 1 hr. Tubes were removed to and allowed to cool to RT before adding 2 mL of 2.5 mM ETDA, 500 μl of 6.3 mM 2,3-diaminonapthalene-HCl in ultrapure water, and 1 ml of cyclohexane. Tubes were capped and incubated for 30 min at 60°C. Samples were placed in a shaker for 5 min, and then 150 μl of the upper phase was aliquoted in technical triplicate into a 96 well plate. The plate was read for fluorescence emission on a DTX880, Beckman Coulter plate reader with λexcitation at 360 nm and λemission at 528 nm. Values for selenite supplemented cells were normalized to basal intracellular selenium values, giving a relative selenium uptake measurement.
Orthotopic xenograft studies
8-week-old female wild type nude athymic nu-/nu- mice were purchased from Charles River Laboratories and raised in an animal facility at University of Massachusetts Medical School (UMMS). Littermate controls were not used. To compare tumor growth between control and SEPHS2 KO cell lines in vivo, 10 days after viral transduction, the cells (1 X 10⁶) were resuspended in 1X PBS with Matrigel basement membrane matrix at a 1:1 ratio (total volume, 35 μl) and subcutaneously injected into the area between the upper right 2nd and 3rd mammary fact pads of nude mice. Tumor sizes were measured using the Vernier caliper, and volumes were determined according to the formula 4/3π[(LxWxD)/2], where L is the measurement parallel to the midline of the supine animal and W is perpendicular to the midline, and D is the distance from chest to the top of the tumor. Mice were sacrificed 7 weeks after injection and the solid tumors isolated. Mouse orthotopic xenografts were set up with 7 mice per cohort as we have previously obtained statistically significant results with this number of mice using this cell line model in previous experiments that projected a >50% difference in cell viability. Mice were randomly assigned to be injected with SEPHS2 KO MDAMB231 cells or CTRL KO MDAMB231 cells. The researchers carrying out injection and tumor measurements were blinded to which group were which (SEPHS2 KO vs CTRL KO tumors). Our experiments comply with all ethical regulations and have been approved by the Institute Animal Care and Use Committee (IACUC) of University of Massachusetts Medical School.
Processing of human patient breast tissues for SEPHS2 protein quantification
All human breast cancer samples and normal breast tissue were obtained with informed consent from the University of Massachusetts Medical School Biorepository and Tissue Bank using procedures conducted under an Institutional Review Board (IRB)-approved protocol. After surgical removal, fresh tumors and normal tissues were partly snap-frozen in liquid nitrogen immediately and stored at −80°C. The frozen section was homogenized in RIPA buffer with complete protease inhibitor cocktail, and then centrifuged at 13000 g, 4°C for 10 min. Then SDS-PAGE was performed as described in the Western blotting section. A strong non-specific band appearing in breast tissues required that a 10% gel and long electrophoresis be used for separating SEPHS2 protein from the non-specific band (labeled with asterisk in Fig. 1h). Protein levels of SEPHS2 and actin were quantified by using Image J program. Scanned films were inverted and the intensity of each band was measured, and then the background value was subtracted. The intensity value of SEPHS2 protein band for each sample was normalized to its intensity value of actin protein.
Survival analysis
Kaplan-Meier curves was used to analyze the tumor-free survival and for mouse experiment and overall survival of human patients. R survival package33,34 was used to generate Kaplan-Meier survival plots and compare the survival distributions of patients with low SEPHS2 and those with high SEPHS2. The survival data ‘brca_tcga_pub2015_all35 was downloaded from cBioportal36. Patients were divided into ‘High’ and ‘Low’ groups based on their SEPHS2 expression level (top 25% or bottom 25% in the cohort).
Quantification and statistical analysis
Tumor-free survival in mouse was compared between CTRL and SEPHS2 KO groups using the Kaplan–Meier method, and significant differences in curves was assessed using the log-rank test. Results of the viability assay and Ellman’s test and total selenium measurement were analyzed using student’s two tailed t test. Values of p < 0.05 were considered statistically significant, and data marked with a one (*), two (**) or three (***) asterisks indicate p values of < 0.05, < 0.01 and < 0.001, respectively.
Transporter CRISPR Screen
We infected U251 cells with 2 CRISPR guides for each transporter target. Cells were replated in 12 μM selenite media after full selection of the CRISPR guides, typically 5 days. We measured cell viability (using CellTiter-Glo) at three points post selenite treatment- 24, 48, and 72 hr. For each guide, the relative growth as measured by fold change increase of CellTiter-Glo signal between selenite treated and untreated control.
Double knockout rescue assay
MDAMB231 cells were infected with pLentiCRISPR V2-based lentivirus to deliver the first knockout (CTRL, SLC7A11_g1, SLC7A11_g2) and selected with puromycin. Cells were secondarily infected with pMD154 lentivirus to allow expression of the second gRNAs (CTRL or SEPHS2_g1) 6–7 days after initial infection, and subsequently selected with 500 μg/ml hygromycin. These cells were selected for 5 days before being plated in triplicate in 96 well format, with 200 cells per well, with duplicate plates. One plate was assayed for viability after overnight incubation, and the second plate was read after 5 days of growth to determine relative growth rate of double knockout cells in comparison to controls.
Immunohistochemistry
Immunohistochemical detection of CD31, Ki67, CA9 and GPX4 in serial tumor samples was performed using formalin-fixed and paraffin-embedded tissue sections. After deparaffinization in xylene for 20 min, rehydrated tissue sections were subjected to antigen retrieval by boiling in Borg Decloaker solution (Biocare Medical) for 5 min. Slides were blocked with 5% horse serum and then incubated with antibodies for 1 h at room temperature. After incubation, biotinylated secondary antibodies plus streptavidin were used to stain the samples, DAB chromogen as substrate, and hematoxylin solution for nuclear counterstaining. The section samples were imaged by QCapture Suite 2.98.2.
Immunocytochemistry
Cell were seeded on cover slips coated with poly-D-lysine and collagen, fixed with 4% paraformaldehyde in PBS, permeabilized by incubation with 0.1% Triton X-100 in PBS, and subsequently blocked with 1% BSA in PBS for 1 h. To quantify the level of cleaved ecaspase 3 expressing cells, the cells were incubated with a rabbit anti- Cleaved Caspase-3 (Asp175) (Cell signaling, 9664) in the cold room overnight. The cells were washed with PBS for three times and incubated with anti-rabbit Alexa Fluor 488 (Invitrogen) for 1 h at room temperature in the dark. The cells were subsequently washed with PBS, and mounted with Gold antifade reagent with DAPI (Invitrogen, P36935).
RNAscope in Situ Hybridization (ISH)
For SEPHS2 mRNA staining, fluorescent RNAscope ISH was performed on the paraffin-embedded serial tumor sections using the RNAscope protocol (Advanced Cell Diagnostics [ACD], RNAscope Multiplex Fluorescent Reagent Kit v2 Assay User Manual, document number; 323100-USM) and all reagents were provided by RNAscope fluorescent reagent kit (Table S3). After deparaffinization in xylene for 20 min and rehydration with serial 100%, 95% and 70% ethanol for 5 min each, tissue sections were treated with hydrogen peroxide for 10 min and heated at 99 °C in target retrieval solution for 20 min. After target retrieval, sections were treated with protease plus at 40 °C in the hybridization oven for 30 min and hybridized with 3-Plex positive control RNA probe, 3-Plex negative control RNA probe and SEPHS2 RNA probe for 2 hrs at 40 °C in the oven. The section samples were incubated with 3 different amplifiers, AMP1 (30 min), AMP2 (30 min) and AMP3 (15 min), at 40 °C to amplify hybridization signals. After amplification steps, sections were treated with HRP-C1 for 15 min at 40 °C and incubated with diluted TSA plus fluorescein (1:50 in TSA buffer) for 30 min at 40 °C in oven. The section samples were counterstained and mounted with Vectashield antifade mounting media with DAPI and imaged by Lionheart LX Automated microscope (BioTek) and images were processed by Gen5 software (BioTek).
Cell death analysis
Cell death was measured using a FITC Annexin V Detection Kit (BD Biosciences, 556547). Cell lines treated with selected concentrations of sodium selenite or cell lines following KO with guides against SEPHS2 were stained with propodium iodide (PI) and Annexin-V FITC. The stained cells were analyzed using the BD LSR II flow cytometer (BD Biosciences). The data was analyzed by FLOWJO 10. The gating and quadrant strategy for FACS measurement is provided in Extended Data Figure 10.
Detection of reactive oxygen species
ROS was detected using DCFDA Cellular ROS Detection Assay Kit (Abcam, ab 113851). MDAMB231 cells were seeded at 2,000 cells/well and 24 hours later were stained with DCF reagent and then treated with various selenite concentrations for 45 min. For SeCys peptide treatment, MDAMB231 cells were seeded at 2,000 cells/well and 24 hours later treated with various concentrations of SeCys peptide for 24 hours before DCF staining. Fluorescence was measured using 485nm excitation and 535nm emission filters with a Beckman Coulter DTX880 Multimode plate reader. Values were normalized to DCF background and vehicle treatment.
Media conditioning, selenide uptake and ferroptosis
We have established that selenite uptake is highly reliant on the presence of extracellular thiols (Figure 3, d-i). Therefore, we observe that the toxicity of selenite treatment is highly modulated by whether the media has been preconditioned for a period of time, which increases toxicity, or whether selenite is added along with a fresh media change, which conversely requires a longer time for selenium uptake and toxicity to occur. We note that in the experiments for Figures 3b, 3d, 4d,e and Extended data Figure 5f,g selenite was added to the media already conditioned since the seeding of the cells; in Figure 3a and Extended Data 8a, selenite was added along with fresh media. Due to the need to pre-stain cells for the DCFDA assay in Extended Data Figure 8b, selenite was co-treated with 75 μM reduced glutathione in assay buffer to provide reduced thiols as conditioned media could not be used for this assay.
We found that a second factor that affects toxicity in some of our experiments was whether the virally transduced cells are ‘in place’ for the duration of the experiment, or for practical reasons trypsin detached and then reattached during the experiment, for example when virally transduced and selected in 6 well format and then replated in 96-well format for CellTiterGlo assays. In the latter case, we find that disruption of selenocysteine biosynthesis pathway (such as via SEPHS2 KO) does induce a small degree of toxicity even in the insensitive cells, which we think is due to detachment/reattachment being a mild ferroptotic stimulus. The MCF10A cells from Figure 3n and Extended Data Figure 2c show this effect, compared to the same cells in Figure 1d, which were not detached and reattached.
Extended Data
Extended Data Figure 1. Panel of toxic metabolites and putative detoxifying enzymes tested.
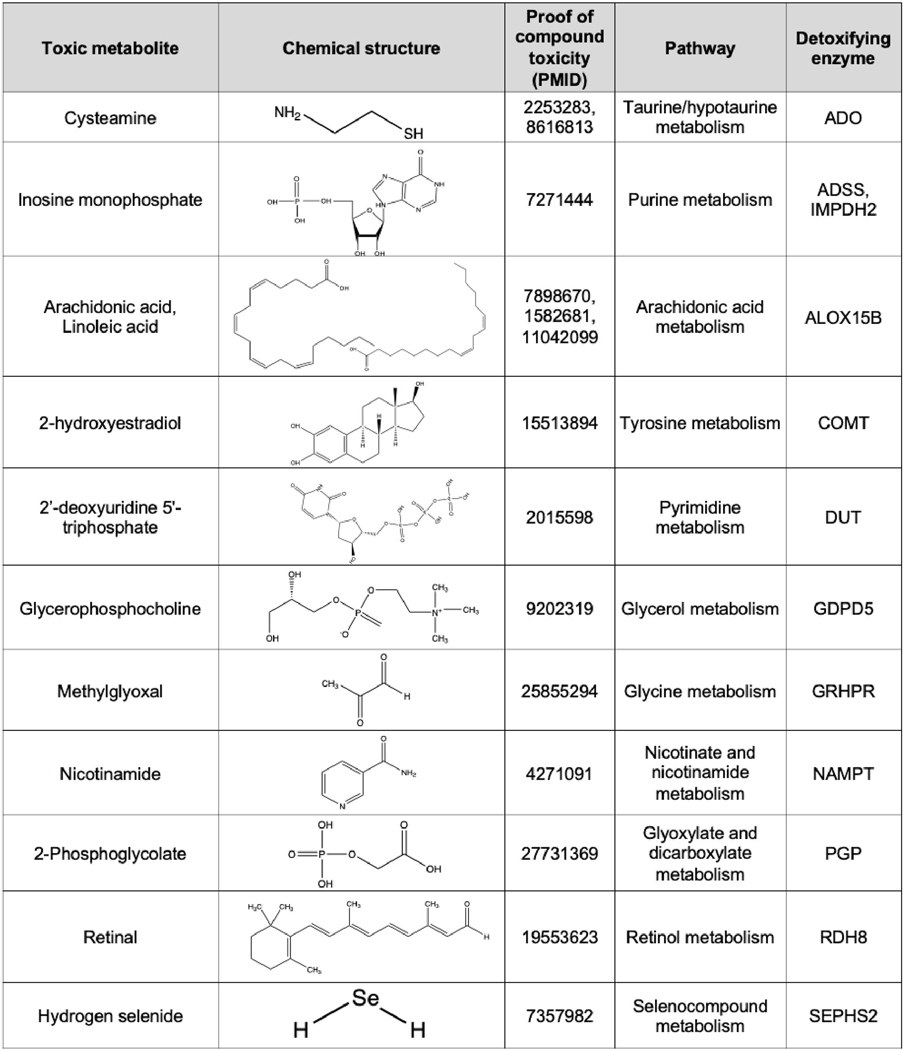
A panel of metabolites that have documented toxic properties, and the downstream enzymes which use them as substrates, designated as ‘detoxifiers’, are listed. Chemical structures and PMID of references which document the toxicity of each metabolite as a compound are shown.
Extended Data Figure 2. Further details of effects of SEPHS2 KO and overexpression in cells and in the MDA231 orthotopic xenograft.
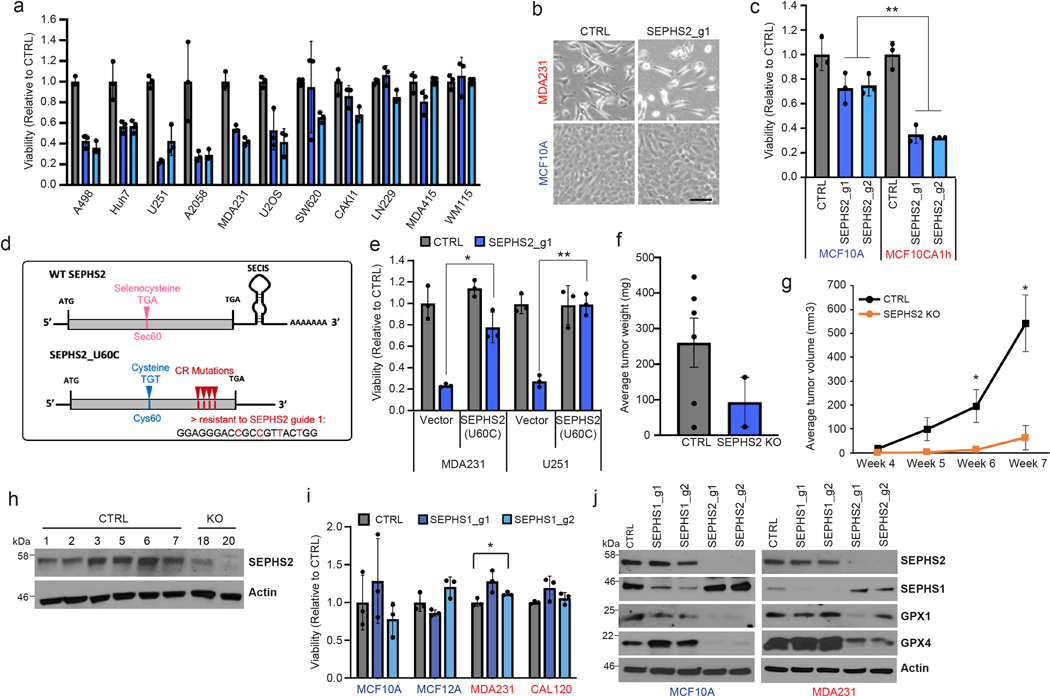
(a) Viability of cell lines following KO with guides against SEPHS2 for 9 days. Values are relative to the same cell lines expressing nontargeting (CTRL) guide (=1.0), (b) Light microscope images of MDAMB231 and MCF10A cells subjected to CTRL or SEPSECS KO. Scale bar=25μm. (c) Viability of cell lines following KO with guides against SEPHS2 for 11 days. Values are relative to the same cell lines expressing nontargeting guide (=1.0). (d) Map of wild type SEPHS2 and CRISPR resistant mutant SEPHS2_U60C. Details of features are provided in Methods. (e) Viability of vector and SEPHS2_U60C overexpressing cell lines subjected to CTRL and SEPHS2 g1 KO. (f) Weight measurements for ex vivo CTRL and SEPHS2 KO MDAMB231 orthotopic xenograft tumors. (g) In vivo tumor volume measurements for CTRL and SEPHS2 KO MDAMB231 orthotopic xenograft tumors. For f and g, if no tumor has formed, tumor weight and volume was designated 0 for CTRL, n=6 and for SEPHS2 KO n=2. (h) Immunoblot of SEPHS2 in CTRL and SEPHS2 KO MDAMB231 orthotopic xenograft tumors. Number is an animal identifier number. For a,c,e, n=3 biological replicates; error bars are S.D. Number is an animal identifier number. (i) Viabilities of noncancer (immortalized) and cancer lines following KO with guides against SEPHS1 (blue bars) for 9 days. Values are relative to the same cell lines expressing nontargeting guide (black bars), set at 1.0. (j) Immunoblots of selenoprotein expression in MCF10A and MDAMB231 cells subjected to (CRISPR/Cas9-induced) KO with guides against SEPHS1, SEPHS2, or control guides for 11 days. For a,c,e and i, n=3 biological replicates; error bars are S.D. For all panels, the measure of center is mean. *p>0.05, **p<0.01 (student’s two-tailed t test).
Extended Data Figure 3. Induction of cell death by SEPHS2 KO in cancer cells.
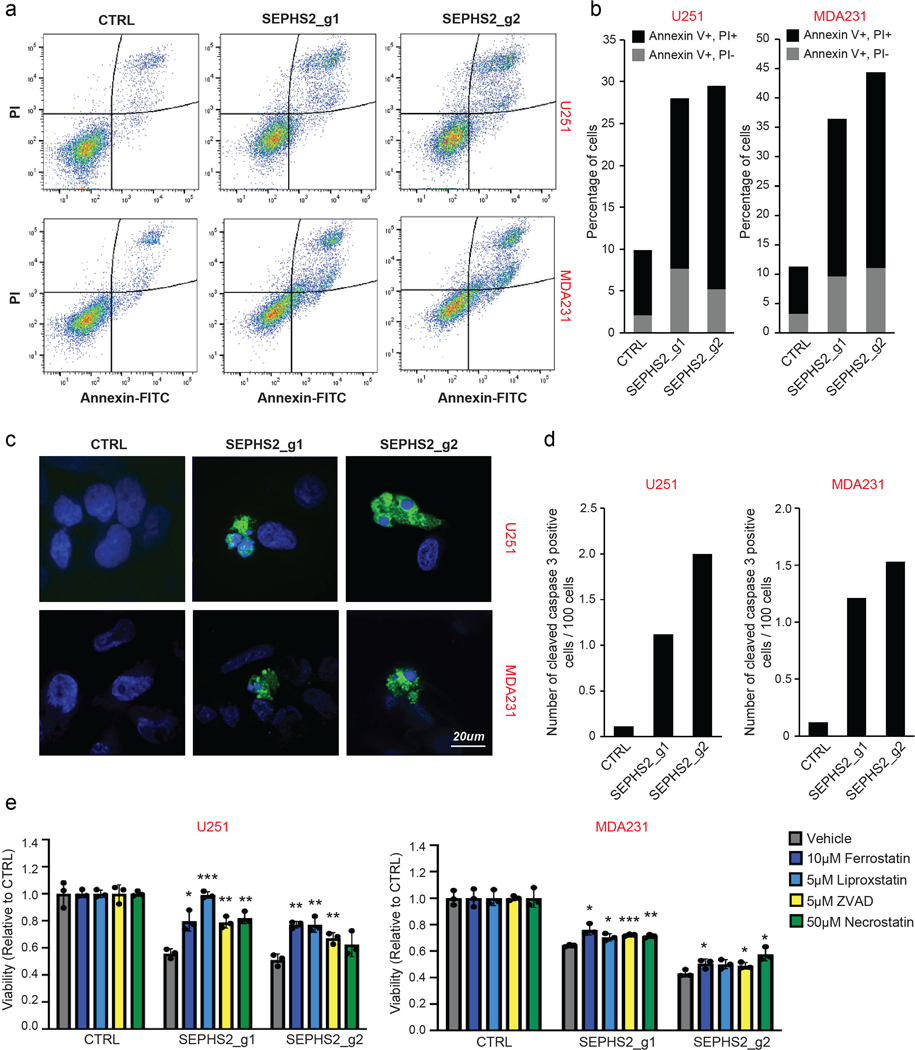
(a) Raw flow cytometry of PI and Annexin V double-stained U251 and MDAMB231 cells following KO with guides against SEPHS2 at 10 days after viral infection. Gating strategy is outlined in Extended Data Figure 10a-e (b) Percentages of Annexin V+/PI- and Annexin V+/PI+ cells. (c) Cleaved caspase 3 (CC3) staining in MDAMB231 and U251cells following KO with guides against SEPHS2 at 10 days after viral transduction. Scale bar=20μm. (d) Quantification of CC3 positive cells over total cells in CTRL and SEPHS2 deficient MDAMB231 and U251. Counts are from random fields. (e) Viability of control and SEPHS2 deficient U251 and MDAMB231 cells treated with vehicle or the indicated drugs for 4 days. Values are relative to the cell lines expressing nontargeting (CTRL) guide, set at 1.0. For e, n=3 biological replicates; error bars are S.D. For all panels, the measure of center is mean. For all panels, *p<0.05, **p<0.01, and ***p<0.001 (student’s two-tailed t test).
Extended Data Figure 4. Expression of SEPHS2 in various types of tumor and normal tissues.
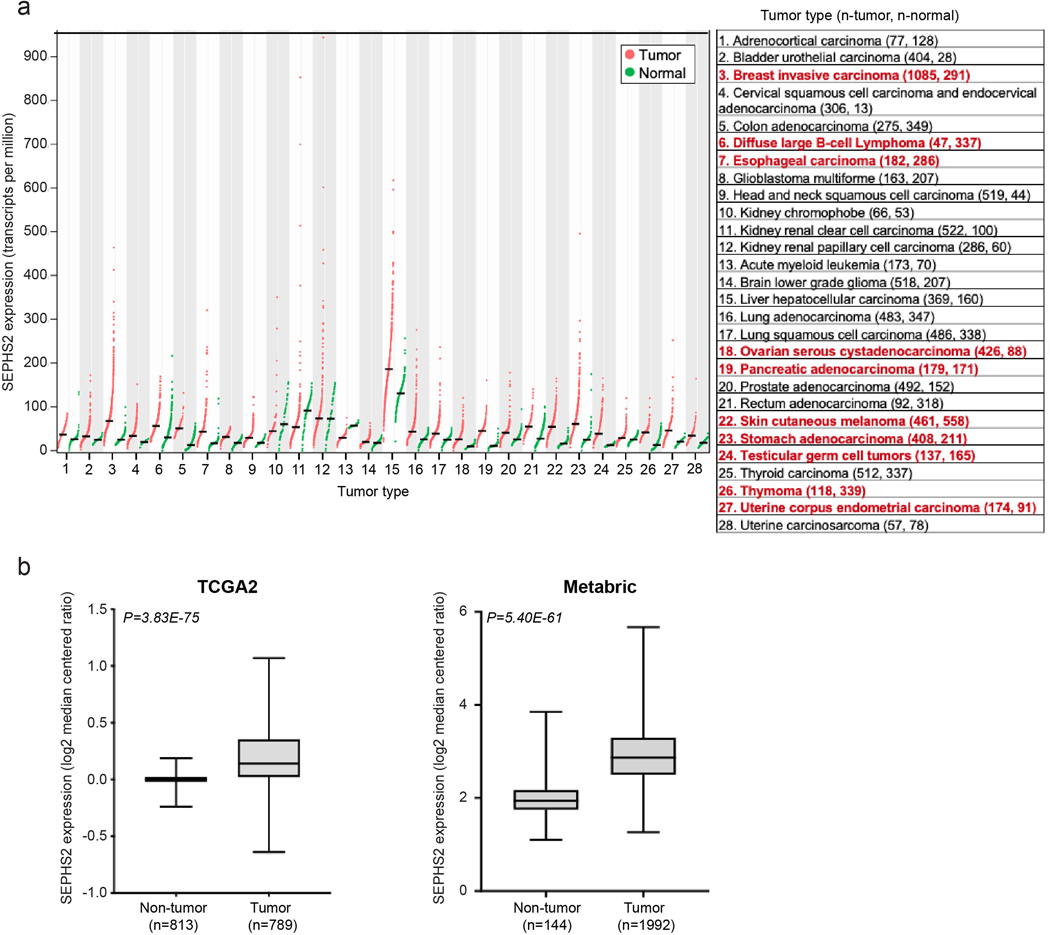
(a) Expression profiles of SEPHS2 in 28 types of normal and tumor tissues. Normalized mRNA-Seq expression profile data from patient tumor tissues and normal tissues was obtained from GEPIA (Tang, Z. et al. (2017) GEPIA: a web server for cancer and normal gene expression profiling and interactive analyses. Nucleic Acids Res, 10.1093/nar/gkx247). Tumor subtypes having over 2-fold SEPHS2 expression in tumor than normal and q-value less than 0.01 indicated with red. q values are have been determined by ANOVA and adjusted for FDR (false discovery rate). (b and c) Box plots of SEPHS2 mRNA expression levels in patient tumors and normal breast tissue. SEPHS2 expression was compared in tumor and normal breast samples from TCGA (b) and METABRIC (c) datasets. For panel b, minimum is non-tumor (−0.239), tumor (−0.6386), maximum is non-tumor (0.1874), tumor (1.0702) and median is non-tumor (0.0014), tumor (0.1402). For panel c, minimum is non-tumor (1.10097), tumor (1.26305), maximum is non-tumor (3.85158), tumor (5.67272), and median is non-tumor (1.941515), tumor (2.86621).
Extended Data Figure 5. Candidate transporters tested and xCT functional characterization.
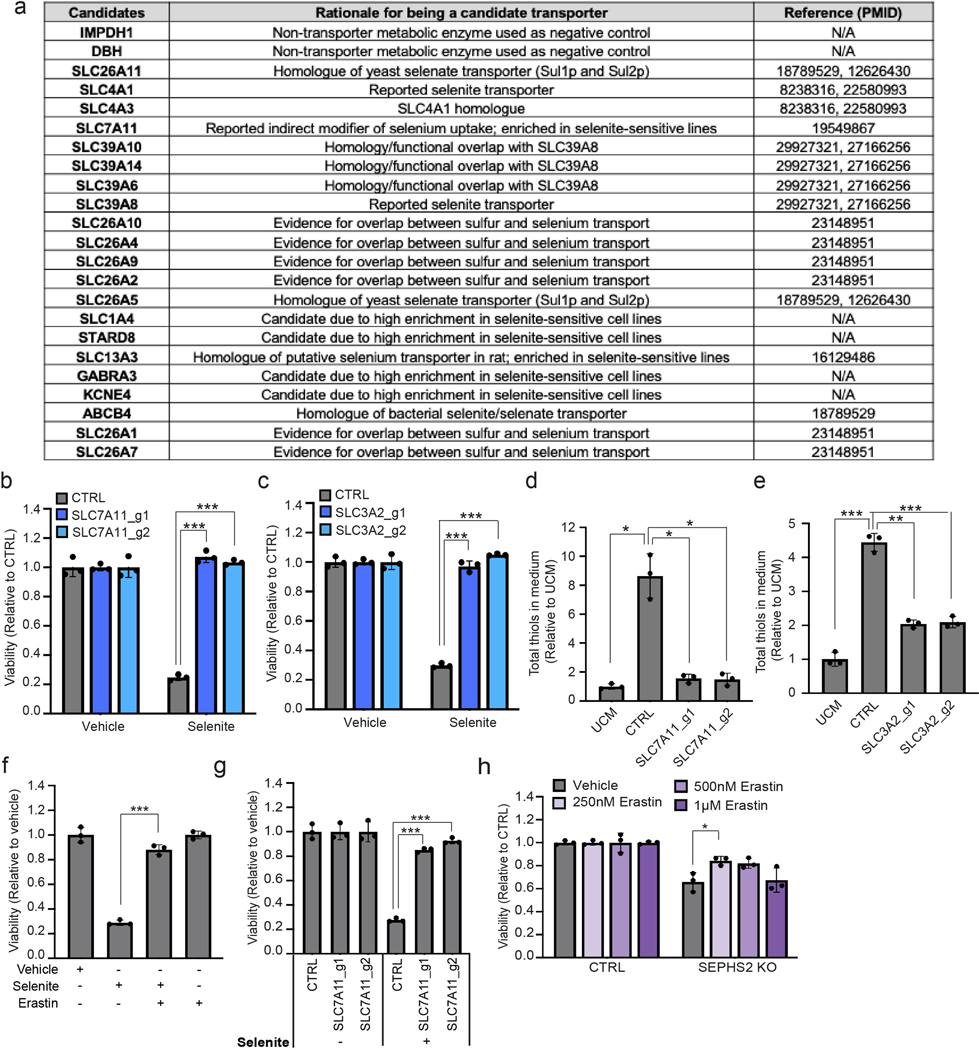
(a) A list of selenium transporter candidates examined in the focused screen, rationale for candidacy, and references. (b) Viability of control and SLC7A11 KO U251 cells treated with 12 μM of sodium selenite for 48 hr. Values are relative to that of the same cells treated with vehicle (=1.0). (c) Viability of control and SLC3A2 KO U251 cells treated with 12 μM of sodium selenite for 48 hr. Values are relative to that of the same cells treated with vehicle (=1.0). (d) Total thiol quantification of 24 hr conditioned media from control and SLC7A11 KO U251 cells. (e) Total thiol quantification of 24 hr conditioned media from control and SLC3A2 KO U251 cells. Each value was normalized to that of unconditioned medium. (f) Viability of U251 cells treated with vehicle, 12 μM sodium selenite, and/or 10 μM Erastin for 72 hr. Values are relative to the cells treated with vehicle (=1.0). (g) Viability of control and SLC7A11 KO U251 cells treated with vehicle or 12 μM sodium selenite for 72 hr. Values are relative to the control cells treated with vehicle (=1.0). (h) Viability of control and SEPHS2 KO CAL120 cells treated with vehicle or indicated doses of Erastin for 4 days. Values are relative to each untreated cells (=1.0). For b-h, n=3 biological replicates; error bars are S.D. For all panels, the measure of center is mean. For all panels, *p<0.05, **p<0.01, and ***p<0.001 (student’s two-tailed t test).
Extended Data Figure 6. Effects of hypoxia or nutrient-starved stresses on normal and selenophilic cancer cells.
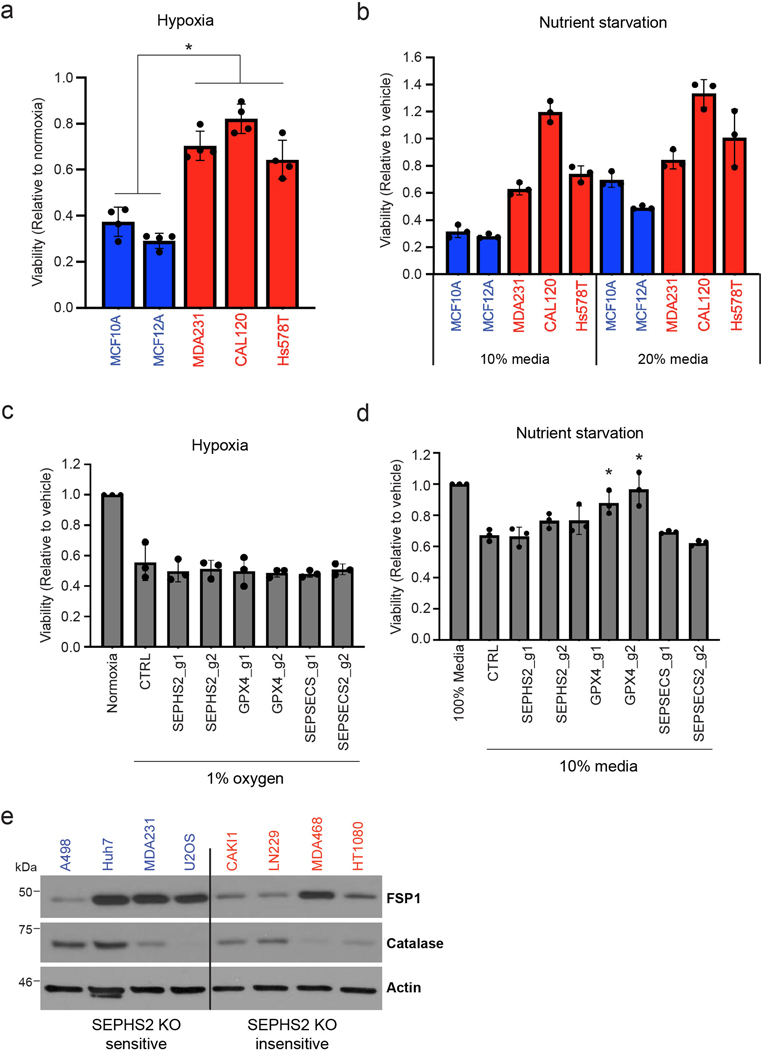
(a) Viability of non-transformed (blue bars) and selenophilic cancer (red bars) cells under hypoxia (1% O2) for 48hr. Values are relative to cells cultured under normoxic condition (20% O2), set at 1.0. (b) Viability of non-transformed (blue bars) and selenophilic cancer (red bars) cells under nutrient starved conditions (10% or 20% growth media) for 48hr. Values are relative to cells cultured in 100% growth media, set at 1.0. (c) Viability of control, SEPHS2, GPX4, and SEPSECS deficient MDAMB231 cells after being cultured in hypoxic condition (1% O2) for 48hr. Values are relative to the cells cultured in normoxic condition (20% O2), set at 1.0. (d) Viability of control, SEPHS2, GPX4, and SEPSECS deficient MDAMB231 cells under nutrient starved conditions (10% growth media) for 48hr. Values are relative to the cells cultured in 100% growth media, set at 1.0. (e) Immunoblot of FPS1 and catalase in SEPHS2 KO sensitive and in sensitive cell lines. For a,b, n=3 biological replicates; error bars are S.D. For c,d n=3 independent experiments; error bars are S.D. For b, while trends can be seen, statistical comparisons were not carried out due to variability between cell lines. For all panels, the measure of center is mean. For all panels, *p<0.05 (student’s two-tailed t test).
Extended Data Figure 7. SEPHS2 and GPX4 expression in tumor microenvironments.
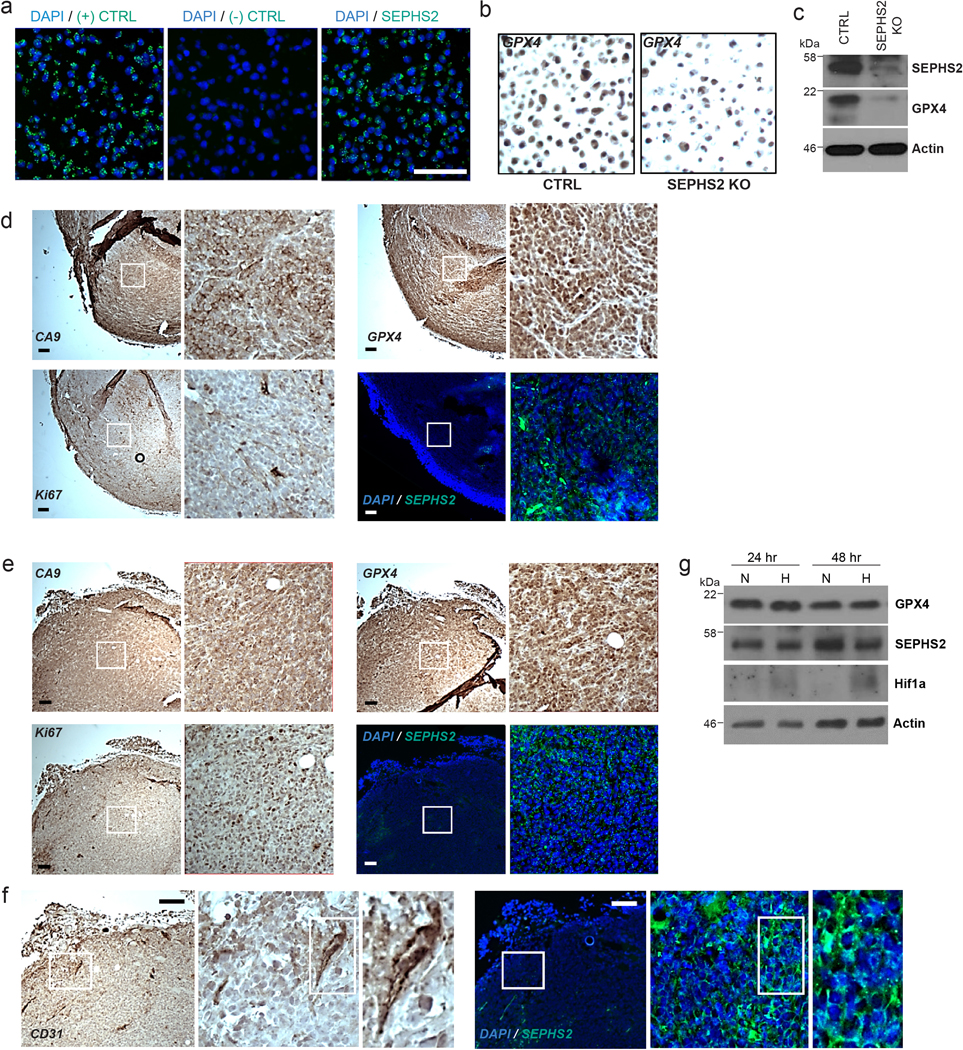
(a) Validation of SEPHS2 RNA probe by RNAscope in situ hybridization in MDA231 cell pellet block samples. Scale bar=100μm. (b) Validation of specificity of GPX4 antibody in CTRL and SEPHS2 KO MDAMB231 cell pellet block by immunohistochemistry. (c) SEPHS2 immunoblots from the cells used in b. (d and e) Micrographs of serial xenograft tumor sections stained with CA9, GPX4, KI67 antibodies and in situ hybridized with SEPHS2 RNA probe. The right hand panels are magnifications of the regions outlined by the white square. (d) shows a hypoxic region as indicated by membrane staining of CA9, and with a low Ki67 index. (e) shows a nonhypoxic region (as indicated by only background nonspecific stain in CA9) with a high Ki67 index. Scale bar is 100μm. (f) Micrographs of serial human tumor sections stained with CD31 antibody and in situ hybridized with SEPHS2 RNA probe, showing vasculature. Scale bar is 100μm. (g) Immunoblots of GPX4, SEPHS2 and Hif1a in MDAMB231 cells subjected to hypoxia (1% O2) for 48hrs.
Extended Data Figure 8. Reactive oxygen species production by excess selenium, and implications in SEPHS2 KO toxicity.
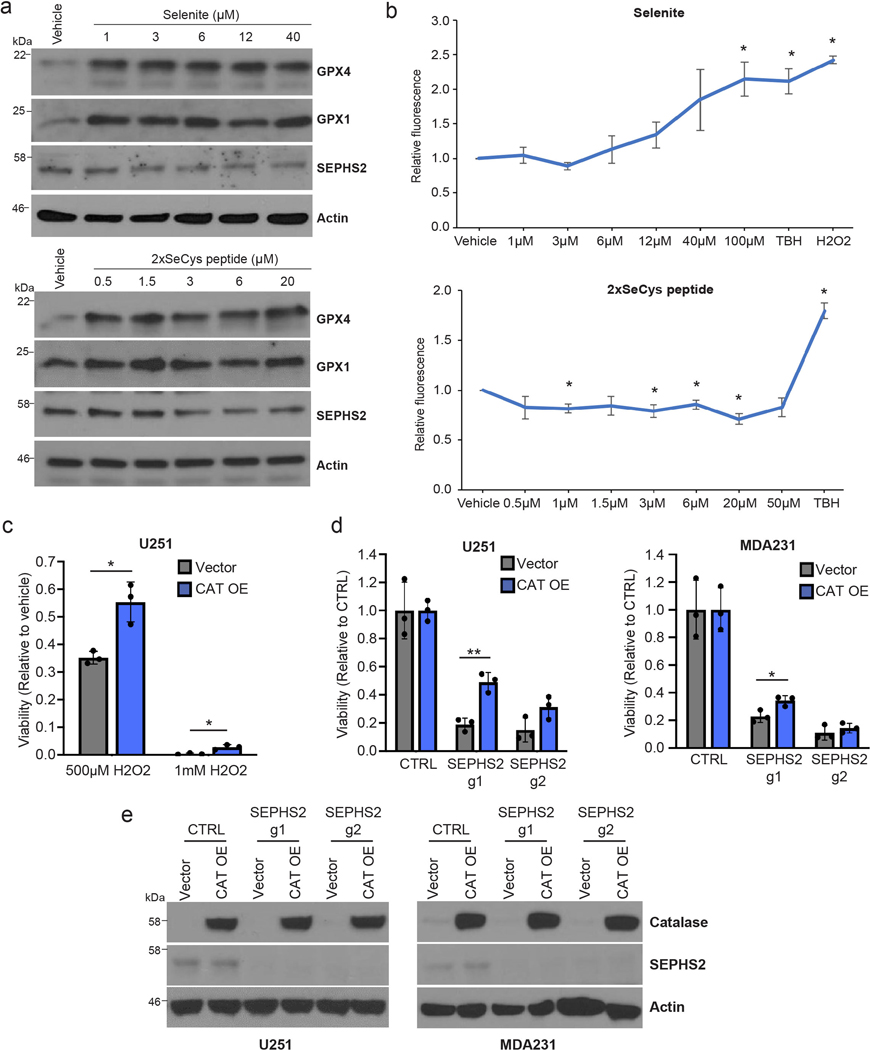
(a) Selenoprotein immunoblots of MDAMB231 cells at 24hr recovery after 2 hr sodium selenite treatment or treated with 2-selenocysteine-containing peptide for 24hr. (b) ROS quantification of cells treated with indicated concentrations of sodium selenite or 2xselenocysteine containing peptide, 250 μM TBH, or 500μM H2O2 for 45 mins. (c) Viability of U251 cells overexpressing vector or CAT treated with vehicle or H2O2 for 48 hr. (d)Viability of U251, and MDAMB231 cells overexpressing blank vector or CAT and subjected to KO with guides against SEPHS2 for 9 days. (e) Immunoblots of CAT and SEPHS2 in U251 and MDAMB231 cells overexpressing blank vector or CAT and subjected to KO with guides against SEPHS2 for 9 days. For b, n=3 independent experiments; error bars are S.D. For c,d n=3 biological replicates; error bars are S.D. For all panels, the measure of center is mean. For all panels, *p<0.05 and **p<0.01 (student’s two-tailed t test).
Extended Data Figure 9. Confirmation of gene knockout or overexpression after lentiviral transduction.
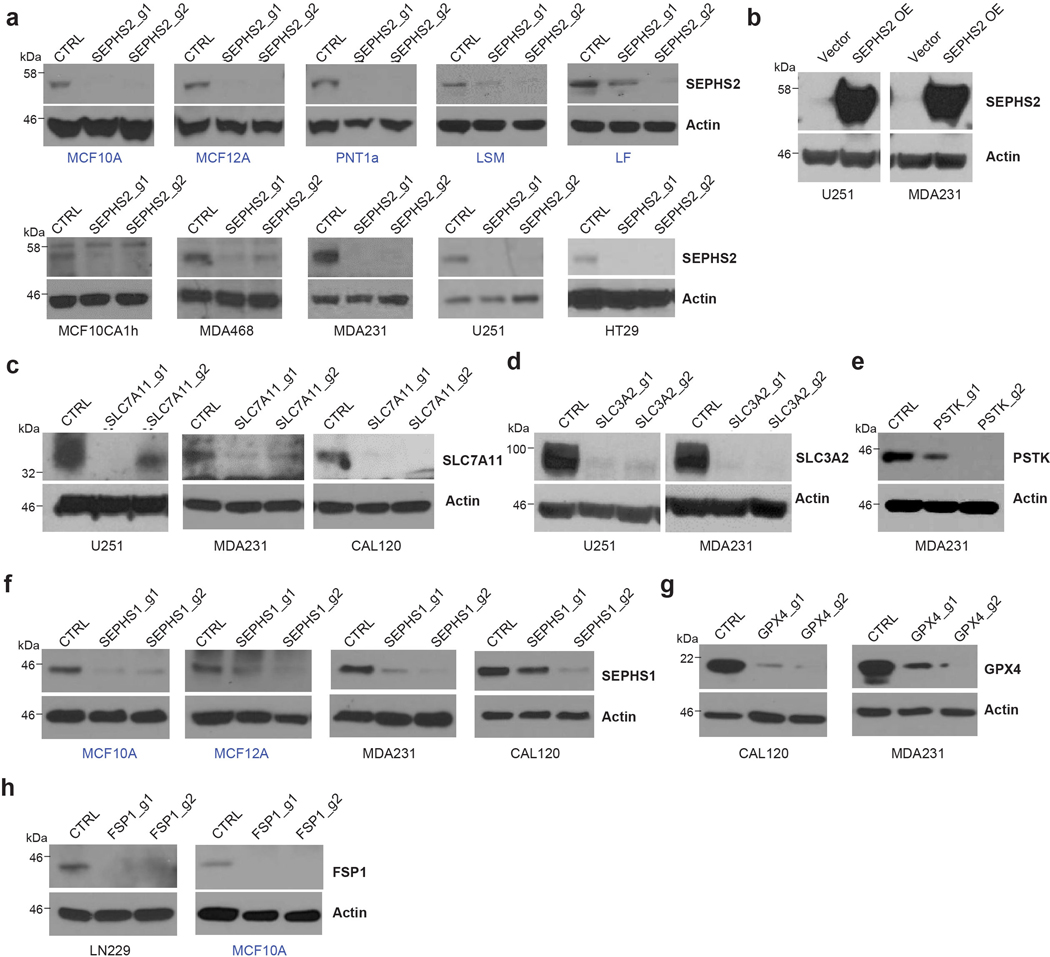
(a) Immunoblots of SEPHS2 in 5 non-transformed (blue) and 5 transformed (black) cell lines transduced with Cas9/sgRNAs against SEPHS2, and control (non-targeting sgRNA). (b) Immunoblots of SEPHS2 in cells transduced with CRISPR resistant SEPHS2_U60C and control (empty vector). (c) Immunoblots of SLC7A11 in cells transduced with Cas9/sgRNAs targeting SLC7A11 or non-targeting sgRNA. (d) Immunoblots of SLC3A2 in cells transduced as indicated (e) Immunoblots of PSTK in cells transduced as indicated. (f) Immunoblots of SEPHS1 in 2 non-transformed and 2 cancer cells transduced as indicated. (g) Immunoblots of GPX4 in cells transduced as indicated. (h) Immunoblots of FSP1 in cancer cells transduced as indicated. All samples were lysed between 7~8 days after viral transduction.
Extended Data Figure 10. Supporting data for flow cytometry and gas toxicity system.
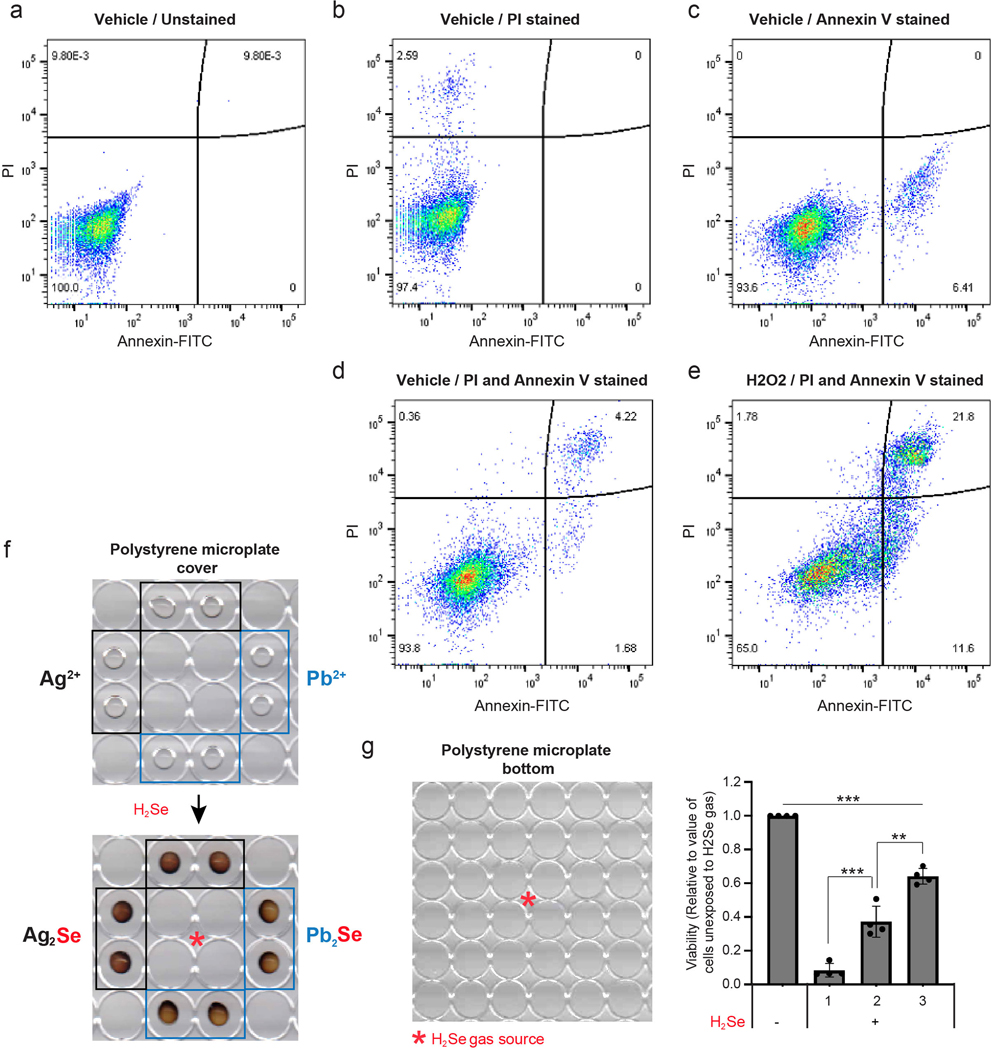
(a-e) Representative flow cytometry data to address gating and quadrant strategy for FACS measurement of dying/dead cells. MDAMB231 cells were stained with Annexin V-FITC and propidium iodide (PI). The X-axis and y-axis of Flow cytometry density plots were designated as Annexin V-FITC and PI, respectively. The left lower quadrant represents Annexin V negative and PI negative live cells. The right lower quadrant represents Annexin V positive and PI negative early dying cells. The right upper quadrant represents Annexin V positive and PI positive late dying/dead cells. Staining is as follows: (a) unlabeled, (b) PI, (c) Annexin V, (d) Annexin V and PI, (e) Annexin V and PI stained cells treated with 50 μM H2O2 for 24hr. (f) Scanned image of a polystyrene microplate cover with PVP spots embedded with silver nitrate or lead acetate. The plate cover was scanned before (upper panel) and after (lower panel) selenide gas exposure for one min. (g) Viability of MDAMB231 cells in the numbered spots outlined on the 96 well plate, exposed to selenide gas. For g, n=4 independent experiments; values are normalized to untreated cells (=1.0). For all panels, the measure of center is mean. For all panels **p<0.01, and ***p<0.001 (student’s two-tailed t test).
Supplementary Material
STATISTICS AND REPRODUCIBILITY.
All experiments were repeated at least three times with the following exceptions: Focused candidate detoxifying enzyme screen carried out in 11 cell lines in Fig 1b, effects of SEPHS2 KO on tumor growth (Fig 1f,g and Extended Data Fig 2f,g), focused screen for selenium uptake mediator (Fig 3a), SEPHS2 protein measurements in tumors vs normal tissues (Fig 1h,i), imaging for cleaved caspase 3 in SEPHS2 KO cells (Extended Data Fig 3c,d), selenium ICP/MS quantification of captured spots (Fig 4g), validation of SEPHS2 expression knockout (Extended Data Fig 9), and validations of drug efficacy (Fig 3j and Extended Data Fig 8c) which were performed once. The following experiments were repeated twice: SEPHS2 KO in multiple cell lines (Fig 1c and d), SEPHS1 KO in multiple cell lines (Extended Data Fig 2i), SEPHS2/GPX4/SEPSECS KO cell treatment with hypoxia and nutrient starvation (Extended Data Fig 6c,d) and erastin treatment of SEPHS2 KO (Extended Data Fig 5h). In all experiments, all attempts at replication were successful.
Bliss independence values (Fig 4e) were calculated using standard formula of Ec = Ea + Eb - Ea × Eb. A bliss independence score of less than 1.0 indicates a synergistic effect.
ACKNOWLEDGEMENTS
We thank M. Green, E. Baehrecke, A. Mercurio, D. Sabatini, C. Haynes, D. Guertin, B. Bible, K. Krupczak, K. Luk, C. Brown, A. Jaferi, and S. Deibler for advice, assistance, and feedback. We thank D. Sabatini, S. Wolfe, M. Lee, A. Mercurio, and K-Y. Choi for materials including vectors and cell lines. We thank O. Kwon for illustrations, and C-C. Hsieh for assistance with statistics. This work was supported by the Suh Kyungbae Foundation (SUHF) Young Investigator Award to D.K.; NIH T32 CA130807–8 to M.E.S.; Searle Scholars Program, Rita Allen Foundation, Whitehall Foundation, Smith Family Foundation, and NIH/NIA DP2 AG067490–01 to P.L.G; and R01 CA229910 to L.M.S.
Footnotes
COMPETING FINANCIAL INTERESTS
A.E.C., N.L., and D.K. are listed as the authors on a patent application filed by University of Massachusetts Medical School on targeting SEPHS2 in cancer therapy, and on the hydrogen selenide detection methodology. All other authors declare no competing interests.
DATA AVAILABILITY STATEMENT
All raw data that support the findings of this study are available from the corresponding author upon request.
REFERENCES
- 1.Labunskyy VM, Hatfield DL & Gladyshev VN Selenoproteins: molecular pathways and physiological roles. Physiol Rev 94, 739–777, doi: 10.1152/physrev.00039.2013 (2014). [DOI] [PMC free article] [PubMed] [Google Scholar]
- 2.Burk RF & Hill KE Regulation of Selenium Metabolism and Transport. Annu Rev Nutr 35, 109–134, doi: 10.1146/annurev-nutr-071714-034250 (2015). [DOI] [PubMed] [Google Scholar]
- 3.Hanahan D & Weinberg R. Hallmarks of Cancer: The Next Generation. Cell 144, 646–674, doi: 10.1016/j.cell.2011.02.013 (2011). [DOI] [PubMed] [Google Scholar]
- 4.Amoedo ND, Obre E & Rossignol R. Drug discovery strategies in the field of tumor energy metabolism: Limitations by metabolic flexibility and metabolic resistance to chemotherapy. Biochim Biophys Acta Bioenerg 1858, 674–685, doi: 10.1016/j.bbabio.2017.02.005 (2017). [DOI] [PubMed] [Google Scholar]
- 5.Wexler P. TOXNET: an evolving web resource for toxicology and environmental health information. Toxicology 157, 3–10 (2001). [DOI] [PubMed] [Google Scholar]
- 6.Kanehisa M & Goto S. KEGG: kyoto encyclopedia of genes and genomes. Nucleic Acids Res 28, 27–30, doi: 10.1093/nar/28.1.27 (2000). [DOI] [PMC free article] [PubMed] [Google Scholar]
- 7.Sanjana NE, Shalem O & Zhang F. Improved vectors and genome-wide libraries for CRISPR screening. Nat Methods 11, 783–784, doi: 10.1038/nmeth.3047 (2014). [DOI] [PMC free article] [PubMed] [Google Scholar]
- 8.Banerjee BD, Dwivedi S & Singh S. Acute hydrogen selenide gas poisoning admissions in one of the hospitals in Delhi, India: case report. Hum Exp Toxicol 16, 276–278, doi: 10.1177/096032719701600508 (1997). [DOI] [PubMed] [Google Scholar]
- 9.Schecter A, Shanske W, Stenzler A, Quintilian H & Steinberg H. Acute hydrogen selenide inhalation. Chest 77, 554–555 (1980). [DOI] [PubMed] [Google Scholar]
- 10.Strickland LB, Dawson PJ, Santner SJ & Miller FR Progression of premalignant MCF10AT generates heterogeneous malignant variants with characteristic histologic types and immunohistochemical markers. Breast Cancer Res Treat 64, 235–240, doi: 10.1023/a:1026562720218 (2000). [DOI] [PubMed] [Google Scholar]
- 11.Xu XM et al. Selenophosphate synthetase 2 is essential for selenoprotein biosynthesis. Biochem J 404, 115–120, doi: 10.1042/BJ20070165 (2007). [DOI] [PMC free article] [PubMed] [Google Scholar]
- 12.Noinaj N et al. Structural insights into the catalytic mechanism of Escherichia coli selenophosphate synthetase. J Bacteriol 194, 499–508, doi: 10.1128/JB.06012-11 (2012). [DOI] [PMC free article] [PubMed] [Google Scholar]
- 13.Cavalieri RR, Scott KG & Sairenji E. Selenite (75Se) as a tumor-localizing agent in man. J Nucl Med 7, 197–208 (1966). [PubMed] [Google Scholar]
- 14.Cavalieri RR & Scott KG Sodium selenite Se 75. A more specific agent for scanning tumors. JAMA 206, 591–595 (1968). [PubMed] [Google Scholar]
- 15.Jiang C, Wang Z, Ganther H & Lu J. Distinct effects of methylseleninic acid versus selenite on apoptosis, cell cycle, and protein kinase pathways in DU145 human prostate cancer cells. Mol Cancer Ther 1, 1059–1066 (2002). [PubMed] [Google Scholar]
- 16.Sato H et al. Redox imbalance in cystine/glutamate transporter-deficient mice. J Biol Chem 280, 37423–37429, doi: 10.1074/jbc.M506439200 (2005). [DOI] [PubMed] [Google Scholar]
- 17.Sato H, Tamba M, Ishii T & Bannai S. Cloning and expression of a plasma membrane cystine/glutamate exchange transporter composed of two distinct proteins. J Biol Chem 274, 11455–11458, doi: 10.1074/jbc.274.17.11455 (1999). [DOI] [PubMed] [Google Scholar]
- 18.Olm E et al. Extracellular thiol-assisted selenium uptake dependent on the x(c)- cystine transporter explains the cancer-specific cytotoxicity of selenite. Proc Natl Acad Sci U S A 106, 11400–11405, doi: 10.1073/pnas.0902204106 (2009). [DOI] [PMC free article] [PubMed] [Google Scholar]
- 19.Kim JY et al. Human cystine/glutamate transporter: cDNA cloning and upregulation by oxidative stress in glioma cells. Biochim Biophys Acta 1512, 335–344, doi: 10.1016/s0005-2736(01)00338-8 (2001). [DOI] [PubMed] [Google Scholar]
- 20.Jiang L et al. Ferroptosis as a p53-mediated activity during tumour suppression. Nature 520, 57–62, doi: 10.1038/nature14344 (2015). [DOI] [PMC free article] [PubMed] [Google Scholar]
- 21.Hangauer MJ et al. Drug-tolerant persister cancer cells are vulnerable to GPX4 inhibition. Nature 551, 247–250, doi: 10.1038/nature24297 (2017). [DOI] [PMC free article] [PubMed] [Google Scholar]
- 22.Yang WS et al. Regulation of ferroptotic cancer cell death by GPX4. Cell 156, 317–331, doi: 10.1016/j.cell.2013.12.010 (2014). [DOI] [PMC free article] [PubMed] [Google Scholar]
- 23.Doll S et al. FSP1 is a glutathione-independent ferroptosis suppressor. Nature 575, 693–698, doi: 10.1038/s41586-019-1707-0 (2019). [DOI] [PubMed] [Google Scholar]
- 24.Bersuker K et al. The CoQ oxidoreductase FSP1 acts parallel to GPX4 to inhibit ferroptosis. Nature 575, 688–692, doi: 10.1038/s41586-019-1705-2 (2019). [DOI] [PMC free article] [PubMed] [Google Scholar]
- 25.Spallholz JE On the nature of selenium toxicity and carcinostatic activity. Free Radic Biol Med 17, 45–64 (1994). [DOI] [PubMed] [Google Scholar]
- 26.Alim I et al. Selenium Drives a Transcriptional Adaptive Program to Block Ferroptosis and Treat Stroke. Cell 177, 1262–1279 e1225, doi: 10.1016/j.cell.2019.03.032 (2019). [DOI] [PubMed] [Google Scholar]
- 27.Ingold I et al. Selenium Utilization by GPX4 Is Required to Prevent Hydroperoxide-Induced Ferroptosis. Cell 172, 409–422 e421, doi: 10.1016/j.cell.2017.11.048 (2018). [DOI] [PubMed] [Google Scholar]
- 28.Delafiori J, Ring G & Furey A. Clinical applications of HPLC-ICP-MS element speciation: A review. Talanta 153, 306–331, doi: 10.1016/j.talanta.2016.02.035 (2016). [DOI] [PubMed] [Google Scholar]
- 29.Suzuki KT & Ogra Y. Metabolic pathway for selenium in the body: speciation by HPLC-ICP MS with enriched Se. Food Addit Contam 19, 974–983, doi: 10.1080/02652030210153578 (2002). [DOI] [PubMed] [Google Scholar]
- 30.Dauplais M, Lazard M, Blanquet S & Plateau P. Neutralization by metal ions of the toxicity of sodium selenide. PLoS One 8, e54353, doi: 10.1371/journal.pone.0054353 (2013). [DOI] [PMC free article] [PubMed] [Google Scholar]
- 31.Wang T, Wei JJ, Sabatini DM & Lander ES Genetic screens in human cells using the CRISPR-Cas9 system. Science 343, 80–84, doi: 10.1126/science.1246981 (2014). [DOI] [PMC free article] [PubMed] [Google Scholar]
- 32.Sheehan TM & Gao M. Simplified fluorometric assay of total selenium in plasma and urine. Clin Chem 36, 2124–2126 (1990). [PubMed] [Google Scholar]
- 33.A Package for Survival Analysis in S. Version 2.38. (CRAN website - http//cran.r-project.org/package=survival, 2015).
- 34.Harrington DPF, T. R. . A class of rank test procedures for censored survival data. Biometrika, doi: 10.1093/biomet/69.3.553 (1982). [DOI] [Google Scholar]
- 35.Ciriello G et al. Comprehensive Molecular Portraits of Invasive Lobular Breast Cancer. Cell 163, 506–519, doi: 10.1016/j.cell.2015.09.033 (2015). [DOI] [PMC free article] [PubMed] [Google Scholar]
- 36.Cerami E et al. The cBio cancer genomics portal: an open platform for exploring multidimensional cancer genomics data. Cancer Discov 2, 401–404, doi: 10.1158/2159-8290.CD-12-0095 (2012). [DOI] [PMC free article] [PubMed] [Google Scholar]
Associated Data
This section collects any data citations, data availability statements, or supplementary materials included in this article.


