Abstract
BACKGROUND
A treatment option for autosomal dominant polycystic kidney disease (ADPKD) has highlighted the need to identify rapidly progressive patients. Kidney size/age and genotype have predictive power for renal outcomes, but their relative and additive value, plus associated trajectories of disease progression, are not well defined.
METHODS
The value of genotypic and/or kidney imaging data (Mayo Imaging Class; MIC) to predict the time to functional (end-stage kidney disease [ESKD] or decline in estimated glomerular filtration rate [eGFR]) or structural (increase in height-adjusted total kidney volume [htTKV]) outcomes were evaluated in a Mayo Clinic PKD1/PKD2 population, and eGFR and htTKV trajectories from 20–65 years of age were modeled and independently validated in similarly defined CRISP and HALT PKD patients.
RESULTS
Both genotypic and imaging groups strongly predicted ESKD and eGFR endpoints, with genotype improving the imaging predictions and vice versa; a multivariate model had strong discriminatory power (C-index = 0.845). However, imaging but not genotypic groups predicted htTKV growth, although more severe genotypic and imaging groups had larger kidneys at a young age. The trajectory of eGFR decline was linear from baseline in the most severe genotypic and imaging groups, but it was curvilinear in milder groups. Imaging class trajectories differentiated htTKV growth rates; severe classes had rapid early growth and large kidneys, but growth later slowed.
CONCLUSION
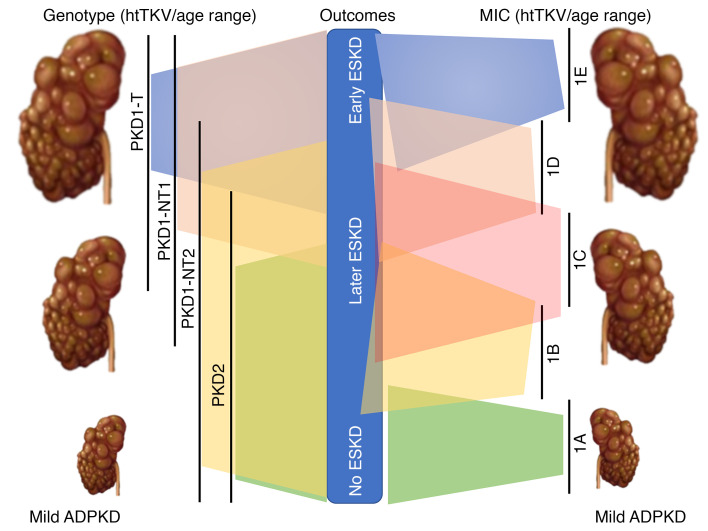
The value of imaging, genotypic, and combined data to identify rapidly progressive patients was demonstrated, and reference values for clinical trials were provided. Our data indicate that differences in kidney growth rates before adulthood significantly define patients with severe disease.
FUNDING
NIDDK grants: Mayo DK058816 and DK090728; CRISP DK056943, DK056956, DK056957, and DK056961; and HALT PKD DK062410, DK062408, DK062402, DK082230, DK062411, and DK062401.
Keywords: Genetics, Nephrology
Keywords: Genetic diseases
Genetic and radiological imaging features in autosomal dominant polycystic kidney disease identify rapidly progressive patients.
Introduction
Autosomal dominant polycystic kidney disease (ADPKD) is a common (~1/1000 individuals) (1) monogenic disease characterized by cyst development and growth, resulting in enlarged kidneys and end-stage kidney disease (ESKD) (2), accounting for 4%–10% of ESKD worldwide (3, 4). The major loci are PKD1 (~78% cases) and PKD2 (~15%) (5–8), with minor loci accounting for a small proportion of often atypical patients, plus a group of genetically unresolved cases (9–12). The recent approval of a specific treatment option for ADPKD — tolvaptan, which is only indicated for individuals defined as having rapidly progressive disease — highlights the need to identify such cases and better understand disease trajectories (13–15).
The germline gene and mutation are associated with the disease outcome; the median age at onset of ESKD significantly differs between patients with PKD1 truncating (PKD1T; 55.6 years [55.6y]), nontruncating (PKD1NT; 67.9y), and PKD2 (79.7y) mutations (16). Bioinformatic categorization of PKD1NT into those predicted to be fully penetrant (termed here PKD1NT1) and those considered hypomorphic (PKD1NT2) showed a higher estimated glomerular filtration rate (eGFR) in PKD1NT2, compared with PKD1NT1 and PKD1T (9). Mutation categorization (PKD1T, PKD1NT, PKD2), combined with clinical indications (early onset of hypertension or urinary symptoms; the PROPKD score), have provided further predictive power for renal outcomes (17).
The CRISP study showed that the growth of MRI-determined total kidney volume (TKV) in ADPKD patients is exponential (18), and that height-adjusted TKV (htTKV) has predictive value for future GFR decline (19, 20). The further value of imaging was shown by the Mayo Imaging Class (MIC), where patients with atypical radiological patterns were placed in Class 2, and typical patients were categorized as htTKV/age groups based on theoretical growth rates from a common starting htTKV of 150 mL/m at birth; < 1.5% (MIC-1A), 1.5%–3% (MIC-1B), 3%–4.5% (MIC-1C), 4.5%–6% (MIC-1D), and > 6% (MIC-1E) (21). MIC was found to strongly predict renal survival during a 10-year follow-up (i.e., MIC-1E had a much poorer outcome than MIC-1A). The rate of GFR decline in ADPKD has often been considered to have a “hockey stick” trajectory of conserved function followed by a period of rapid decline of 3–5 mL/min/1.73 m2/y (22–24). This is partially reflected in recent analysis of the CRISP and HALT PKD populations (25, 26). While mild groups had extended preserved function, steeper curvilinear slopes were associated with increasingly severe MICs, with close to a linear decline for MIC-1E. Genotype is also associated with htTKV, with kidney sizes larger by genotypic classes (PKD1T and PKD1NT1 > PKD1NT2 > PKD2), although the rate of growth did not differ between PKD1 and PKD2 patients (9, 18, 27). Consistently, there is a strong correlation between MIC and genotypic and PROPKD groups (21, 28). Sex — with males having more severe kidney disease — has been associated with age at ESKD, eGFR, and htTKV (9, 17), and lower BMI (minus kidney and liver weight) was associated with a lower rate of change of TKV (29).
Despite progress in understanding factors that correlate with kidney disease severity, there has been no systematic analysis of the effects of genotype and value of MIC for predicting disease progression and outcomes in a well-defined, longitudinally followed, ADPKD population. Here, we describe the predictive power of defining patients by genotype and/or MIC to determine the time to functional and structural outcomes, and we also analyze the trajectories of eGFR and htTKV over time for these classes in Analysis and Validation cohorts.
Results
Baseline characteristics.
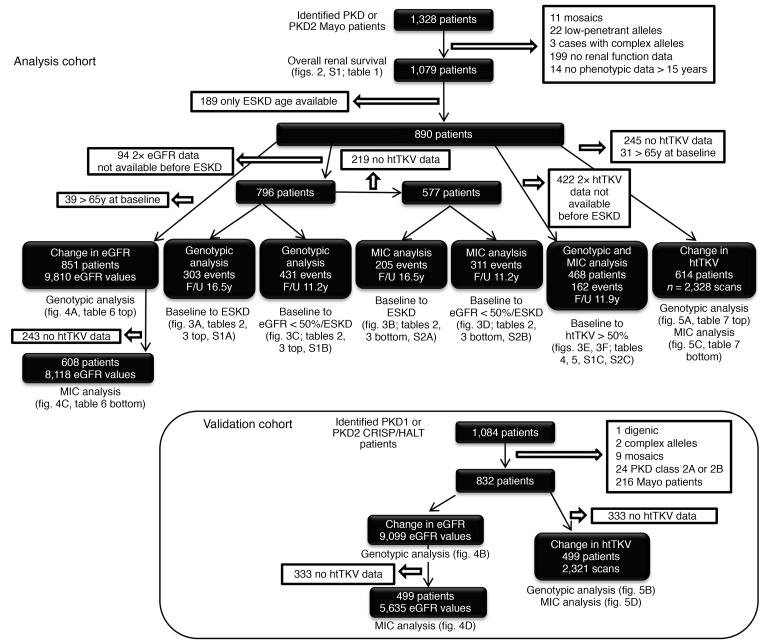
Selection of the Analysis Cohort of PKD1 and PKD2 patients is shown in Figure 1. The genotypic analysis defined the groups as PKD1T, PKD1NT1, PKD1NT2, or PKD2 and MIC as MIC-1A to MIC-1E. In the Analysis Cohort employed to assess overall renal survival (N = 1079; Figure 1), baseline MIC, eGFR, and htTKV, as well as age at ESKD, baseline eGFR and baseline htTKV, were found to significantly differ between genotypes, whereas sex and BMI were similar across the genotypic groups (Table 1).
Figure 1. Flowchart showing the selection and details of the Analysis and Validation cohorts.
The Analysis Cohort consists of Mayo patients, and the Validation Cohort is derived from the CRISP and HALT PKD study populations. All included patients had a PKD1 or PKD2 mutation, with atypical genotypes removed, as indicated. Patients with an atypical MIC or incomplete data were also removed. The chart also shows the selection, size, available data, and average follow-up time for each of the analyses described in the paper, with corresponding data tables and figures indicated. Comparison of the baseline characteristics of the 2 cohorts are shown in Supplemental Table 3.
Table 1. Baseline characteristics of the Analysis Cohort, by genotypic group.
Factors influencing renal survival from birth.
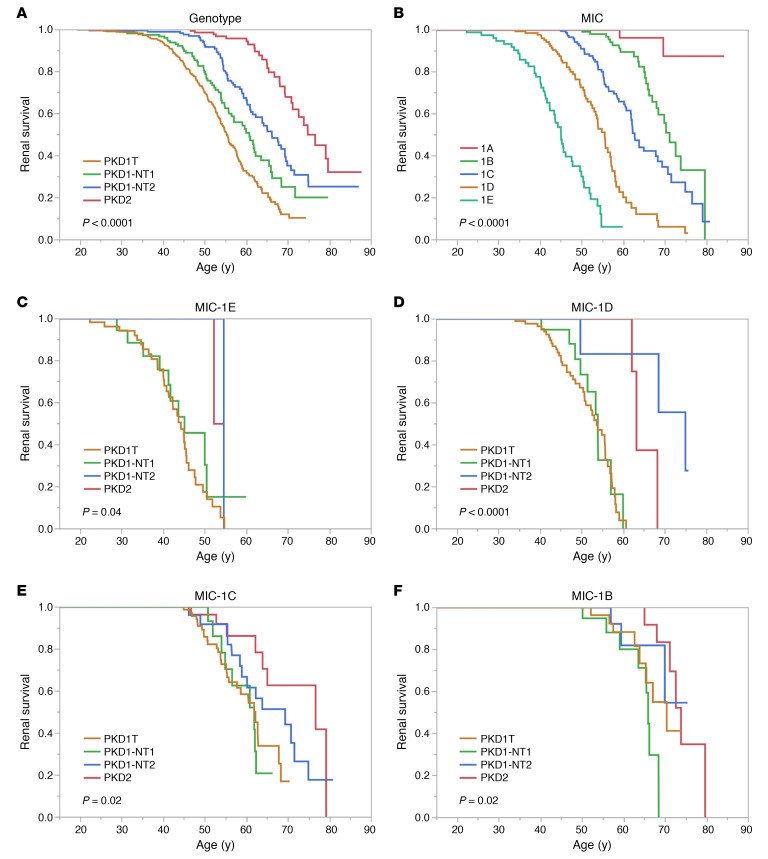
Kaplan-Meier renal survival analysis showed a median age at onset of ESKD of the whole population (n = 1079) of 61.2y (data not shown). Sex significantly differed, with males reaching ESKD 5.7y earlier than females, but BMI was only marginally significant (Supplemental Figure 1, A and B; supplemental material available online with this article; https://doi.org/10.1172/jci.insight.138724DS1). The overall median age at ESKD for PKD1 patients was 58.0y (PKD1 males, 55.7y; females, 59.4y), compared with 74.8y for PKD2 (males 71.2y and 50% females not experiencing ESKD; data not shown). The 4 genotypic divisions significantly separated the population, with median PKD1 ESKD ages ranging from 55.3y (PKD1T) to 66.2y (PKD1NT2) (Figure 2A). The MICs showed even greater separation between classes, with onset of ESKD ranging from 45.1y (MIC-1E) to 71.2y (MIC-1B); less than 20% of MIC-1A patients reached ESKD (Figure 2B). Renal survival analysis of MICs-1E to -1B separated by the genotypic groups identified a few PKD2 and PKD1NT2 patients with large kidneys but better-than-expected renal survival, providing further differentiation of the patient populations (Figure 2, C–F).
Figure 2. Unadjusted Kaplan-Meier renal survival analysis.
(A and B) Unadjusted Kaplan-Meier renal survival analysis from birth (data shown from 15y) analyzing genotype (A) and Mayo Imaging Class (MIC; B), with P values shown. The median age at ESKD is: 55.3y, 60.8y, 66.2y, and 74.4y for PKD1T, PKD1NT1, PKD1NT2, and PKD2, respectively (A) (n = 1079, P < 0.0001); and 45.1y, 55.6y, 62.8y and 71.2y for MIC-1E to -1B, respectively, with less than 20% of MIC-1A patients experiencing ESKD (B) (n = 646, P < 0.0001). (C–F) Similar Kaplan-Meier renal survival analysis from birth analyzes the 4 MICs: MIC-1E (C), -1D (D), 1-C (E), and -1B (F), separated by the 4 genotypic groups. The median age at ESKD for the MIC-1E genotypic groups: PKD1T, PKD1NT1, and PKD1NT2 is 44.3y, 45.1y, and 54.5y, respectively, with less than 50% of PKD2 experiencing ESKD (C, n = 80; P = 0.04); for the MIC-1D genotypic groups, 53.7y, 53.9y, 74.9y, and 63.1y for PKD1T, PKD1NT1, PKD1NT2, and PKD2, respectively (D, n = 140, P < 0.0001); MIC-1C genotypic groups, 61.9y, 61.8y, 69.4y, and 76.6y for PKD1T, PKD1NT1, PKD1NT2, and PKD2, respectively (E, n = 198, P < 0.02); and MIC-1B genotypic groups, 70.3y, 66.0y, and 73.9y for PKD1T, PKD1NT1, and PKD2, respectively, with less than 50% of PKD1NT2 experiencing ESKD (F, n = 156, P < 0.02). Since very few MIC-1A patients reached ESKD (B), we did not plot this class divided by genotypic group.
Association between genotype or MIC and time to ESKD, or 50% eGFR decline/ESKD from baseline.
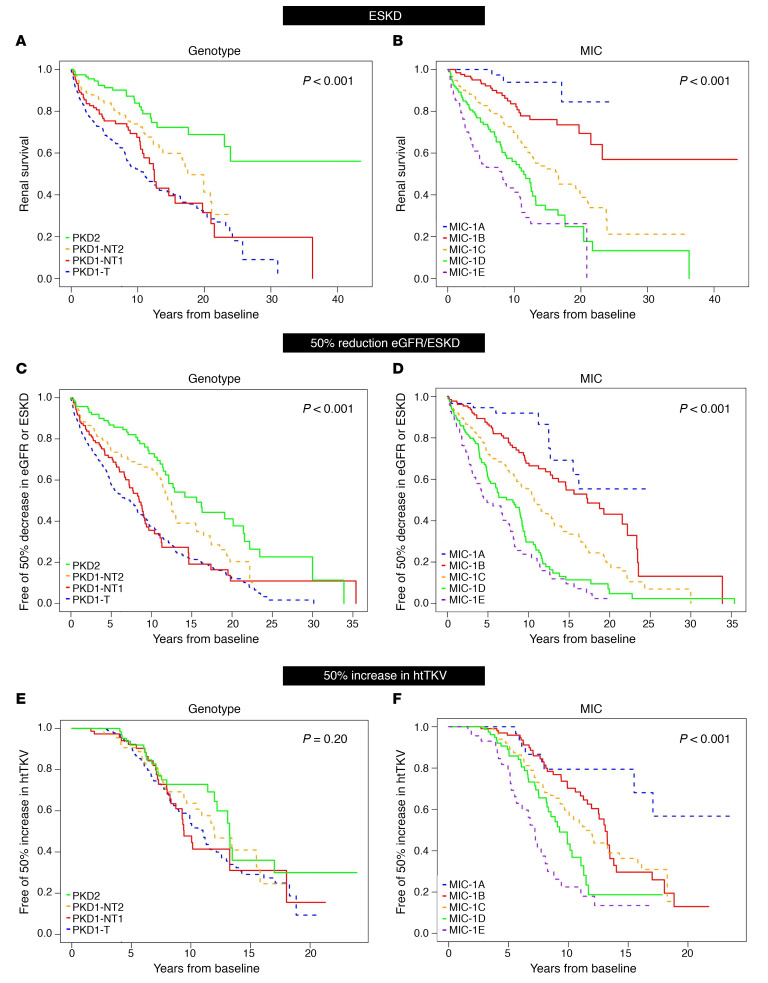
Details of the cohorts used for time-to-event analyses are shown in Figure 1. Average (± SD) follow-up time was 16.5y (0.81) for the endpoint of ESKD and 11.2y (0.45) for 50% eGFR decline/ESKD (eGFR < 50%/ESKD). From baseline, the median time to ESKD for PKD1T patients was 11.0y, compared with 17.5y for PKD1NT2, with 50% of PKD2 patients not experiencing ESKD during follow-up (Figure 3A). For eGFR < 50%/ESKD from baseline, the time to endpoint varied considerably: PKD1T (7.3y) and PKD1NT1 (8.5y), compared with PKD1NT2 (12.5y) and PKD2 (15.6y) (Figure 3C). Even greater resolving power was evident for these endpoints with the MICs: for ESRD, MIC-1E = 8.1y compared with 16.4y for MIC-1C; 50% of the -1A and -1B patients did not reach ESKD during follow-up (Figure 3B). For the eGFR < 50%/ESKD endpoint, the average time to endpoint was 4.9y for MIC-1E, compared with 17.3y for -1B (Figure 3D).
Figure 3. Unadjusted Kaplan-Meier analysis from baseline of functional and structural kidney disease endpoints.
(A–F) Unadjusted Kaplan-Meier renal survival analysis (A and B), eGFR < 50%/ESKD (C and D), or 50% increase in htTKV (E and F) from baseline analyzing genotype (A, C, and E) and MIC (B, D, and F), with P values shown. Median years to ESKD from baseline are: 11.0y, 12.5y, and 17.5y for PKD1T, PKD1NT1, and PKD1NT2, respectively, with less than 50% of PKD2 patients reaching ESKD throughout follow-up (A, n = 796, P < 0.001) and 8.1y, 11.4y, and 16.4y for MIC-1E, -1D, and -1C, respectively, with less than 50% of -1B and -1A patients reaching ESKD throughout follow-up (B, n = 577, P < 0.001). Median years to a eGFR < 50%/ESKD from baseline are: 7.3y, 8.5y, 12.5y, and 15.6y for PKD1T, PKD1NT1, PKD1NT2, and PKD2, respectively (C, n = 796, P < 0.001) and 4.9y, 8.1y, 10.7y, and 17.3y for MIC-1E, -1D, -1C, and -1B, respectively, with less than 50% of -1A patients reaching the endpoint (D, n = 577, P < 0.001). Median years to htTKV > 50% from baseline was not significantly different between genotypic groups: 11.0y, 9.4y, 12.0y, and 13.3y for PKD1T, PKD1NT1, PKD1NT2, and PKD2, respectively (E, n = 468, P = 0.20). However, MIC was significant different for the htTKV > 50% endpoint: 7.2y, 9.3y, 11.4y, and 13.1y for MIC-1E, -1D, -1C, and -1B, respectively, with less than 50% of -1A cases reaching the endpoint (F, n = 468, P < 0.001).
Univariate and multivariate analyses of factors associated with severity of kidney disease.
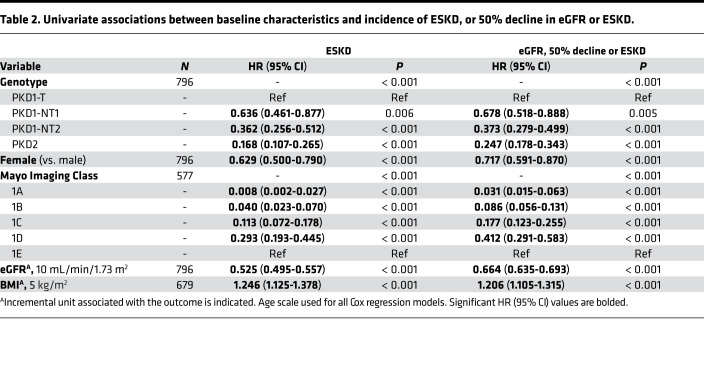
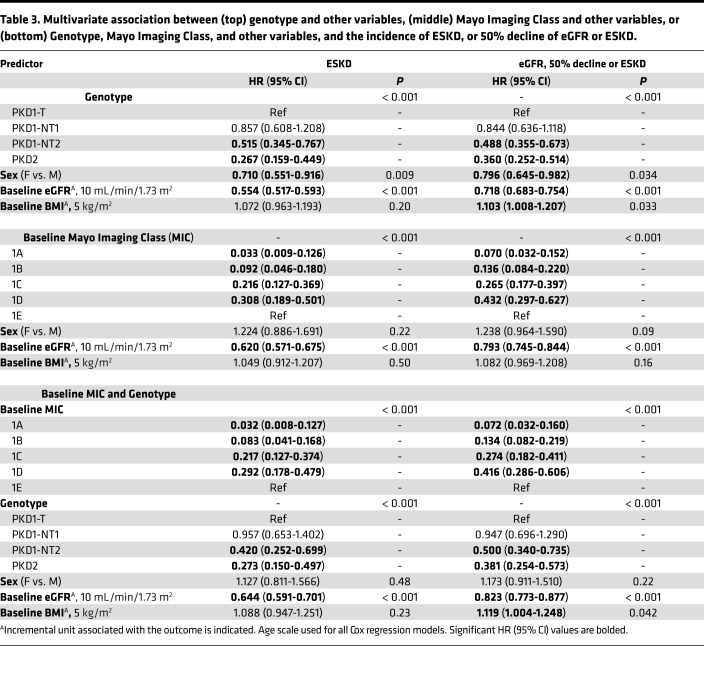
In the univariate analysis, sex, genotype, and baseline MIC, eGFR, and BMI were all found to be associated with the incidence of both ESKD and eGFR < 50%/ESKD during follow-up, with hazard ratios (HR) and 95% CI shown in Table 2. For instance, the risk of reaching ESKD during follow-up was 5.95× greater for a PKD1T patient than PKD2, and 4.05× greater for the eGFR < 50%/ESKD endpoint. Corresponding data for MIC showed MIC-1E patients having a 25× or 11.6× higher risk of ESKD or eGFR < 50%/ESKD, respectively, during follow-up than MIC-1B patients. As a further example, a lower baseline eGFR by 10 mL/min/1.73 m2 equated to a 1.9× or 1.5× greater risk of reaching ESKD or eGFR < 50%/ESKD during follow-up, respectively. When adjusting both individually and combined for sex and baseline eGFR and BMI, results retained statistical significance for both the ESKD and eGFR < 50%/ESKD endpoints for the genotypic groups PKD1NT2 and PKD2 when compared with PKD1T; however, results were attenuated for PKD1NT1 vs. PKD1T for both endpoints (Supplemental Table 1, A and B). In a multivariate model adjusting for all of the above factors with genotype, baseline eGFR and sex significantly associated with the incidence of ESKD (Table 3, top). The discriminatory ability of this model was strong, with a C-index of 0.824 (Supplemental Table 1A). For incidence of eGFR < 50%/ESKD in a multivariate model, sex, baseline eGFR, and BMI were all significantly associated, along with genotype (Table 3, top), and overall had a moderate discriminatory ability: C-index of 0.732 (Supplemental Table 1B).
Table 2. Univariate associations between baseline characteristics and incidence of ESKD, or 50% decline in eGFR or ESKD.
Table 3. Multivariate association between (top) genotype and other variables, (middle) Mayo Imaging Class and other variables, or (bottom) Genotype, Mayo Imaging Class, and other variables, and the incidence of ESKD, or 50% decline of eGFR or ESKD.
When accessing baseline MIC, adjusting both individually and combined for sex, baseline eGFR, and BMI, results retained statistical significance for both the ESKD and eGFR < 50%/ESKD endpoints for all MIC groups, compared with MIC-1E (Supplemental Table 2, A and B). In a multivariate model adjusting for all of the above factors, incidence of ESKD was associated with all MIC levels, with baseline eGFR also significant (Table 3, middle), with strong discriminatory ability (C-index = 0.830; Supplemental Table 2A). Results were similar using the eGFR < 50%/ESKD endpoint, with an overall C-index of 0.753 (Supplemental Table 2B and Table 3).
Both genotype and MIC had good discriminatory power for the 2 functional endpoints, so we performed a multivariate analysis with both of these groups and the other factors (Table 3, bottom). Genotypic groups PKD1NT2 and PKD2 compared with PKD1T, as well as baseline eGFR, were significant after adjusting for MIC for the ESKD endpoint, with a C-index = 0.845, better than models with genotype or MIC alone (Supplemental Table 1A, Supplemental Table 2A). A likelihood ratio test (LRT) between the models including MIC and other baseline variables with and without genotype stratification yielded a highly significant P < 0.001, indicating that inclusion of genotype resulted in improved model fit. Similar results were found for the eGFR < 50%/ESKD endpoint, but with baseline BMI now also marginally a significant risk factor (C-index = 0.765; Supplemental Table 1B and Supplemental Table 2B).
Comparison of time to 50% increase in htTKV from baseline for the genotypic and imaging groups.
Average (SD) follow-up time to 50% increase in htTKV (htTKV > 50%) was 11.9y (0.34; Figure 1). The risk of htTKV > 50% was positively associated with greater severity of the MIC groups (P < 0.001) but was not found to significantly differ between genotypes (P = 0.20) (Figure 3, E and F).
Univariate and multivariate analysis of factors associated with time to a 50% increase in htTKV.
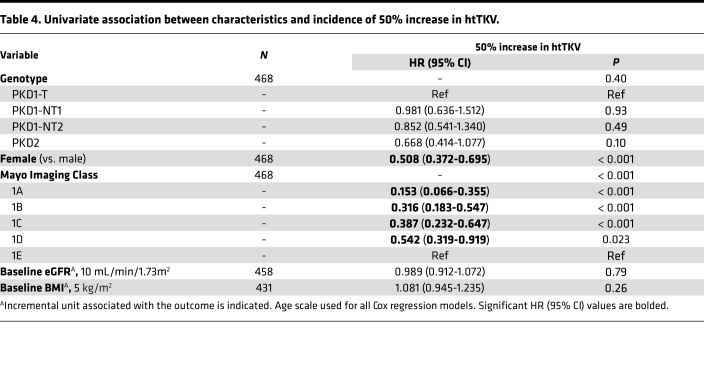
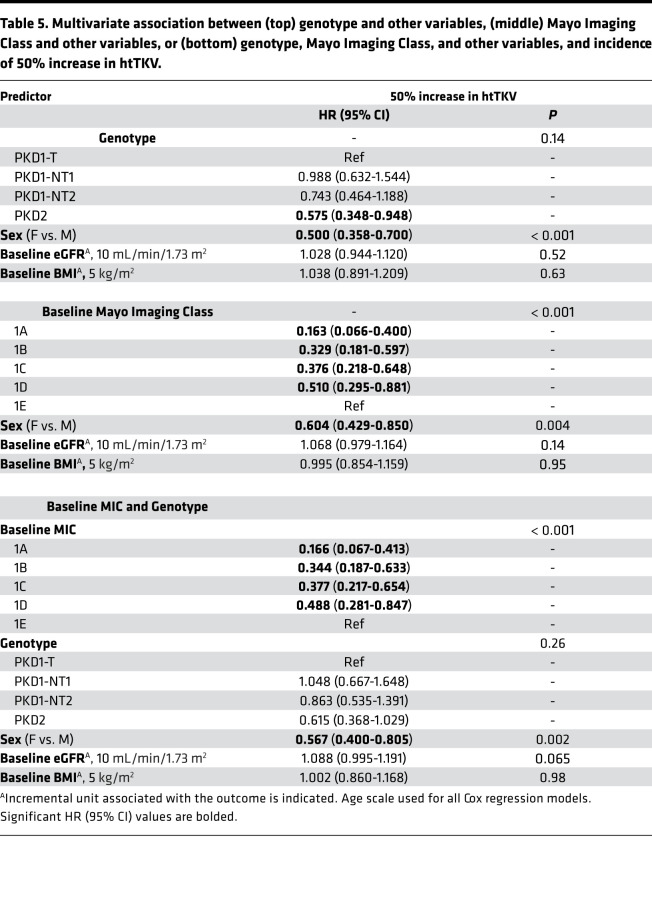
In univariate analysis, the factors sex and baseline MIC were found to be associated with the incidence of htTKV > 50% throughout follow-up, with the HRs and 95% CI shown in Table 4. For example, MIC-1A patients were 6.5× less likely to see this htTKV increase than MIC-1E patients. In pairwise and multivariate analysis with genotype, only sex was significant (Tables 5, top; Supplemental Table 1C). When adjusting both individually and combined for baseline eGFR and BMI, as well as for sex, results retained statistical significance for all MIC groups, compared with MIC-1E (Supplemental Table 2C). In a multivariate model adjusting for all of the above factors, incidence of htTKV > 50% was significantly associated with all MIC levels, as well as sex, but with relatively poor discriminatory ability (C-index 0.632), which only slightly increased by adding genotype (C-index 0.636; Tables 5, middle and bottom; Supplemental Table 2C).
Table 4. Univariate association between characteristics and incidence of 50% increase in htTKV.
Table 5. Multivariate association between (top) genotype and other variables, (middle) Mayo Imaging Class and other variables, or (bottom) genotype, Mayo Imaging Class, and other variables, and incidence of 50% increase in htTKV.
Trajectory analysis of eGFR and htTKV.
Trajectories of eGFR and htTKV over time were plotted for the Analysis Cohort with the population divided by the genotypic and imaging classifications. Results were then compared with a second, PKD1 and PKD2 population, derived from the CRISP and HALT PKD studies, the Validation Cohort. Similar to the Analysis Cohort, atypical genetic and imaging cases, plus Mayo patients in the Analysis Cohort, were excluded from the Validation Cohort (Figure 1). Comparison of the characteristics of the Analysis and Validation cohorts are shown in Supplemental Table 3. Differences between the 2 cohorts are considered in detail in the Discussion, but similar to the Analysis Cohort, the Validation Cohort is a reasonably representative ADPKD population.
Genotypic influences on the change in eGFR over time.
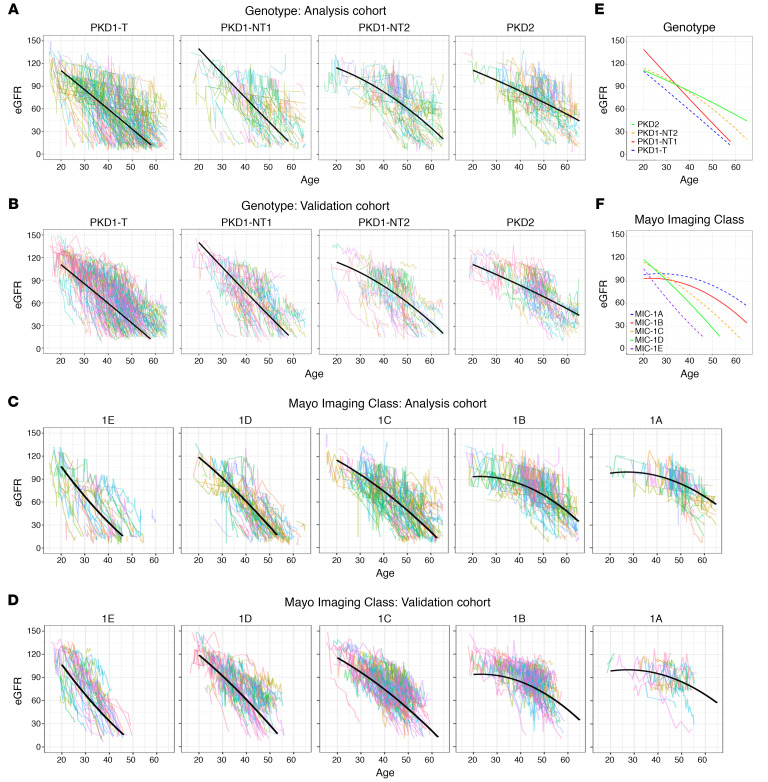
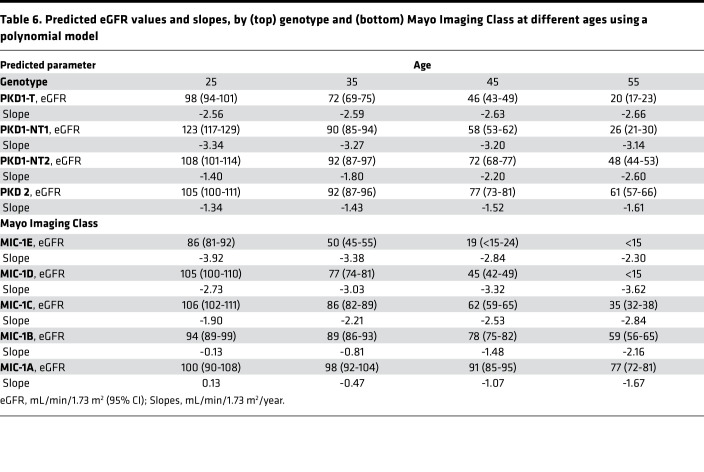
Since the patient trajectories stratified by genotype from the Analysis Cohort plotted in Figure 4A depict a slightly curvilinear decline in eGFR over time, the association between genotype and eGFR across age was modeled using a mixed effect model with both linear and quadratic terms for age, as well as interaction terms between age and genotype group; model coefficients are reported in Supplemental Table 4A. Fitted average eGFR trajectories for each genotypic group from the polynomial model are plotted for the Analysis Cohort (Figure 4A) and compared with the Validation Cohort (Figure 4B); Figure 4E shows the average trajectories. Predicted eGFR values and slopes by genotypic group for the ages 25y, 35y, 45y, and 55y are presented in Table 6, top. Our data show that PKD1T and PKD1NT1 patients have relatively linear decreases in eGFR over time starting from a young age, whereas PKD1NT2 and PKD2 patients are initially quite stable, but with a more rapid decline at later ages. The model performance was assessed by mean paired differences between the predicted and observed eGFR by genotypic group across the various ages for the Analysis and Validation cohorts (Supplemental Table 5, A and B). Most paired differences were within 20 mL/min/1.73 m2, indicating a relatively good fit to the polynomial model; however, paired differences were largest at earlier ages, reflecting the greater variability in baseline eGFR values in the normal range.
Figure 4. Trajectory analysis of eGFR decline for the genotypic and imaging groups.
(A–D) Trajectory plots of eGFR for the 4 genotypic groups in the Analysis (A) and the Validation (B) cohorts and the 5 MICs in the Analysis (C) and Validation (D) cohorts. Fitted average eGFR trajectories from the polynomial model determined from the Analysis Cohort are plotted for each genotypic (A) and imaging (C) group, with the same trajectory plotted on the corresponding data from the Validation Cohort (B and D). (E and F) The summary of these plots for the genotypic (E) and MIC (F) groups are also shown. The slope at the average age for each genotypic group is: –2.62, –3.19, –2.34, and –1.55 mL/min/1.73m2/y for PKD1T, PKD1NT1, PKD1NT2, and PKD2, respectively (E), and for the MICs: –3.27, –3.34, –2.60, –1.73, –1.33 mL/min/1.73m2/y for MIC-1E, -1D, -1C, -1B, and -1A, respectively (F). However, because of the curvilinear trajectories for many groups, the rate of decline varies over time (Table 6).
Table 6. Predicted eGFR values and slopes, by (top) genotype and (bottom) Mayo Imaging Class at different ages using a polynomial model.
MIC influences on the change in eGFR over time.
A similar analysis was performed for eGFR decline over time subdivided by MIC group; model coefficients are reported in Supplemental Table 4B. Fitted average eGFR trajectories by MIC from the polynomial model are plotted for the Analysis Cohort (Figure 4C) and compared with the Validation Cohort (Figure 4D); Figure 4F shows the average trajectories. Predicted eGFR values and slopes by MIC for the ages per decade from 25y–55y are presented in Table 6, bottom. In MIC-1A and -1B patients, renal function was relatively stable at early ages, followed by a decline starting at ~40y. MIC-1C to -1E, on the other hand, experienced relatively linear decreases in eGFR until reaching ESKD, with a steeper slope and earlier ESKD when moving from MIC-1C through to -1E (Figures 4, C, D, and F, and Table 6, bottom). Mean paired differences between the predicted and observed eGFR by MIC across the various ages for the Analysis and Validation cohorts are shown (Supplemental Table 5, C and D). Again, most paired differences were within 20 mL/min/1.73m2, indicating that the model fits well. The large paired differences at earlier ages reflect the increased variability in baseline eGFR values and — at later ages, in the more severe imaging levels — sparsity of patients with baseline MIC at -1D or -1E that continue to be ESKD-free until age 50.
Genotypic influences on the change in htTKV over time.
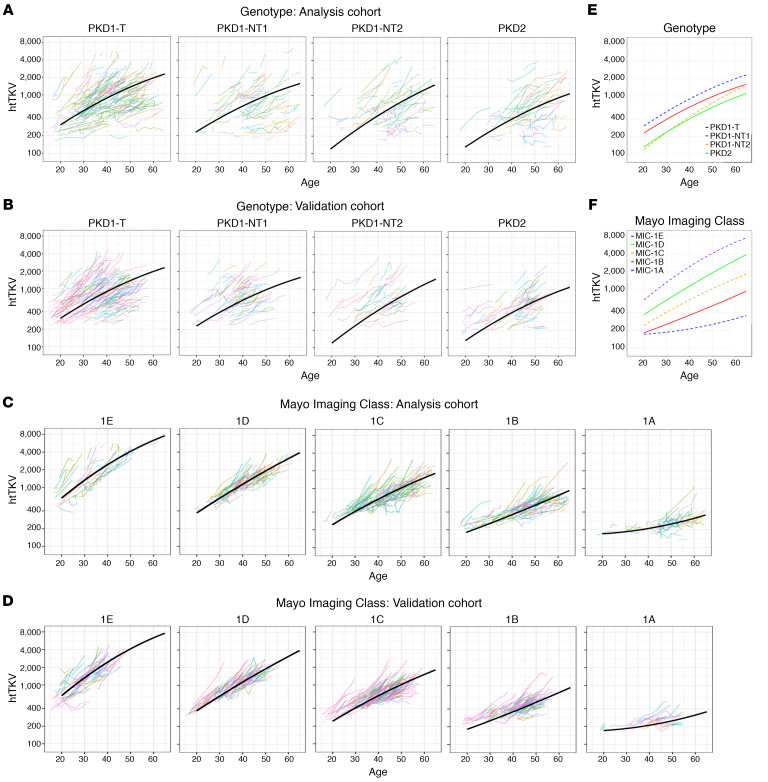
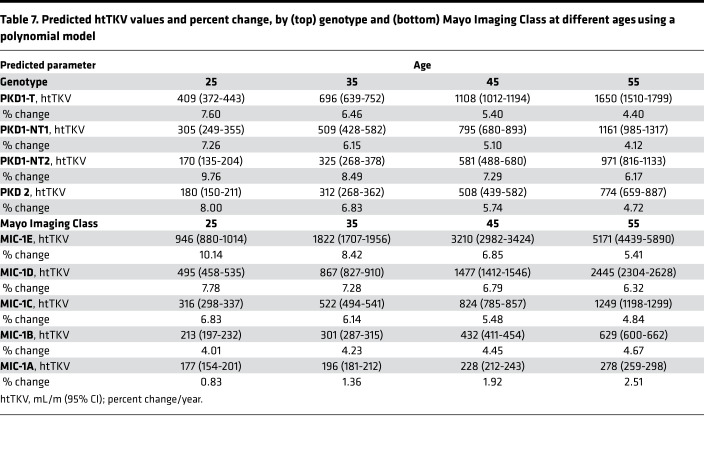
The association between genotype and htTKV over time was modeled using a mixed effect model with htTKV transformed on the natural log scale. Both linear and quadratic terms were included for age, as well as the interaction between age and genotypic group (P < 0.05 for all, using the LRT); the interaction between the quadratic term for age and genotypic group was not found to be statistically significant (P = 0.28); therefore, it was not retained as a predictor in the final model (Supplemental Table 6A). Fitted average htTKV trajectories by genotypic group for the polynomial model of the Analysis Cohort is plotted and compared with the Validation Cohort (Figure 5, A and B), plus the summary trajectories (Figure 5E). Predicted htTKV values and annual percentage change by genotypic group per decade from 25y–55y are presented in Table 7, top. Patients in all genotypic groups tended to exhibit close to exponential trajectories (linear on the log scale) across time, although the trajectories started to level off at older ages (except for perhaps PKD1NT2), and PKD1T and PKD1NT1 tended to have greater htTKVs even by 20 years of age (Figure 5E). As expected from the survival analysis predicting time to htTKV > 50% (Figure 3E), rate of percentage increase was not significantly different between groups, although absolute kidney sizes were much larger at baseline for the more severe groups (Table 7, top). Paired differences between predicted and observed htTKV in the Analysis and Validation cohorts by genotypic groups across various ages are presented (Supplemental Table 7, A and B). Larger paired differences occurred at the earliest and latest ages, which are to be expected due to the large differences of starting htTKV values in patients, as well as the small sample size of PKD1T patients who are ESKD free and have htTKV measured at later ages.
Figure 5. Trajectory analysis of htTKV increase for the genotypic and imaging groups.
(A–D) Trajectory plots of htTKV for the 4 genotypic groups in the Analysis (A) and the Validation (B) cohorts and for the 5 MICs in the Analysis (C) and Validation (D) cohorts. Fitted average htTKV trajectories from the polynomial model determined from the Analysis Cohort are plotted for each genotypic (A) and imaging group (C), with the same trajectory plotted on the corresponding data from the Validation Cohort (B and D). (E and F) The summary of these plots for the genotypic (E) and MIC (F) groups are also shown. The slope at the average age for each genotypic group is: 5.82, 5.08, 7.25, and 5.47 %/y for PKD1T, PKD1NT1, PKD1NT2, and PKD2, respectively (E), and for the MICs: 8.33, 6.96, 5.54, 4.46, 2.10 %/y for MIC-1E, -1D, -1C, -1B and -1A, respectively (F). However, because of the curvilinear trajectories for many groups, the rate of decline varies over time (Table 7).
Table 7. Predicted htTKV values and percent change, by (top) genotype and (bottom) Mayo Imaging Class at different ages using a polynomial model.
MIC influences on change in htTKV over time.
The association between MIC and htTKV over time was estimated using a mixed effect model with htTKV transformed on the natural log scale. Both linear and quadric terms were included for age, as well as the interaction between both age terms and MIC class (P < 0.05 for all, using the LRT; Supplemental Table 6B). Fitted average htTKV trajectories by MIC from the polynomial model to the Analysis Cohort was plotted and compared with the Validation Cohort (Figure 5, C and D) with summary trajectories shown in Figure 5F. Predicted htTKV values and slopes by MIC from 25y–55y are presented in Table 7, bottom. Our model predicts that patients in all PKD classes tended to exhibit exponential trajectories, with only MIC-1A apparently accelerating over time. A clear difference between the classes was the very large htTKV even at 20y for MIC-1E, which was progressively smaller through the groups to MIC-1A (Figure 5, C and F). Analysis of the predicted slopes showed a much greater rate of increase in the severe groups at the early time points, but it showed that the MIC-1B to -1E groups have much more similar growth rates by 45y. Paired differences between predicted and observed htTKV by MIC across various ages for the Analysis and Validation cohorts are presented in Supplemental Table 7, C and D, and are similar in pattern to the genotypic analysis.
Discussion
We believe that our study provides the most detailed analysis thus far of the progression of kidney disease in ADPKD. Although there have been many studies of the renal phenotype in ADPKD (9, 16–18, 20, 21, 26, 30–32), several aspects of this study make it particularly informative: (a) large populations of only mutation defined PKD1 and PKD2 patients are included, excluding ADPKD-like patients with mutations to other genes, genetically unresolved cases, and individuals with unusual alleles, in the Analysis and Validation cohorts (10–12, 33); (b) both time to event and trajectory analysis are performed; (c) genetic analysis, considering allelic and genic factors (3 PKD1 groups, plus PKD2), and imaging analysis employing the widely used htTKV/age determined MICs as predictors in the same populations to measure disease outcomes and trajectories (9, 21); and (d) the trajectory data are confirmed in a second, large, well-characterized Validation Cohort. Overall, the data show the value of both genetic and imaging data to identify rapidly progressive patients suitable for treatment and clinical trials, and they provide reference data to track the trajectories and outcomes of these patient groups (15, 34).
The median age of renal survival in our population is 61.7y, a number similar to older data showing ~50% of typical ADPKD patients experiencing ESKD by ~60y (31, 35). This similarity reflects that PKD1 and PKD2 patients represent the vast majority of ADPKD in renal clinic populations. Our analysis confirms that sex has a strong effect on renal survival, with females faring better by a median of 5.7y (17, 31). Sex is also a major factor driving the rate of htTKV growth, with risk of htTKV > 50% in males almost 2-fold that in females (Table 4), and it is still significant in the multivariate analysis (Table 5) (13). This indicates that sex is an important factor to consider when recruiting for and analyzing clinical trial data. BMI predicted time to ESKD, and in the multivariate analysis, the probability of reaching the eGFR < 50%/ESKD was ~1.1× greater for each 5 kg increase in BMI (Table 3). A recent study indicated that (kidney and liver weight removed) BMI was associated with the rate of htTKV increase in the HALT PKD study (29), but BMI was not significant for our 50% > htTKV endpoint (Table 4).
Dividing PKD1T and PKD1NT patients, and subdividing PKD1NT patients on the predicted penetrance of the mutation, showed a difference in terms of age at onset of ESKD, and time to ESKD, or eGFR < 50%/ESKD from baseline, similar to previously noted differences in eGFR/age for these allelic groups (9). But in the multivariate analysis (Table 3), PKD1NT1 cases did not progress differently than PKD1T for the functional endpoints, consistent with truncating and strongly predicted nontruncating mutation behaving similarly for eGFR/age (9). Even greater differentiation was seen by dividing the population by MICs for all of the functional endpoints, emphasizing their value for identifying rapidly progressive patients. Despite the overlap between renal disease severity groups determined by genotype or MIC, the additional differentiating power of the MIC indicates that it is capturing variability over and above that of the influence of the germline mutation alone. For instance, the MIC-1E group experiences ESKD a median of ~10 years earlier than PKD1T patients. These additional factors presumably involve genetic modifiers beyond the disease allele (including variants on the normal allele of the disease gene), variants to other genes, and environmental exposures and lifestyle factors (33, 36). However, we found that genotype (with sex and baseline eGFR and BMI) had good predictive value, especially for time to ESRD (C-index = 0.824), similar to MIC with these other factors (C-index = 0.830). Furthermore, genotype demonstrably adds to the discriminatory power of the MIC containing model predicting time to ESKD (or eGFR < 50%/ESKD) in the multivariate analysis (C-index increased to 0.845) and Kaplan-Meier analyses (Figure 2 and Table 3), indicating the combined value of imaging and mutation screening to identify rapidly progressive patients. These results are different than previously observed (20, 26), and this may be because of the larger populations and more precise division of the type of PKD1 mutation in this study.
In terms of the structural endpoint of htTKV > 50% during follow-up, MIC and related baseline htTKV were significant, but not genotype or baseline eGFR. Previous studies that also did not find a TKV growth rate difference between genotypic groups (PKD1 and PKD2) concluded that the number of cysts in early disease rather than the rate of kidney growth was influenced by genotype (27); a similar explanation is likely for our genotypic groups, but total kidney cyst number data are not available in our cohorts. It is not surprising that MIC is significantly associated with time to htTKV > 50%, as these groups are classified based on a theoretical difference in the rate that kidneys increase in size (21). The finding that baseline eGFR does not significantly influence this endpoint reflects that the rate of increase in htTKV does not greatly change as kidney function declines (18).
The trajectories of eGFR decline in ADPKD have been much debated, but this study and the recent one from CRISP have provided clarity (22–24, 26). The validity of our model was confirmed in a second population, one overlapping with but better genetically defined than the populations used in the Yu study (26). For the genotypic groups and MICs, the decline is quite close to linear in the severe groups and more curvilinear (the classical view) in the milder ones. Similar to the renal survival data, the MICs identify rapidly progressive patients more precisely than genotype, with a considerable spread even in PKD1T patients, again emphasizing that factors beyond the germline mutation influence the pattern of renal functional decline in individual patients. For both genotypic groups and MICs, by 25y, the more severe groups have a declining eGFR (the average 25y MIC-1E patient had chronic kidney disease [CKD], stage 2 and stage 3a by 35y), but the mildest (MIC-1A and -1B) were not declining until ~40y. However, by 55y, the mild groups were declining, and for the most severe groups, since the majority of patients had already experienced ESKD, their rate of decrease appeared to be slowing. For clinical trials and monitoring treatments, eGFR may be a reasonable endpoint measure for even young patients in the severe groups (with rapidly progressive disease), a fact reflected in the TEMPO trial enriched for such younger patients (13). The rates of eGFR decline in the placebo group in the Reprise study of –3.61 mL/min/1.73 m2, selected for patients with declining renal function (14), is equivalent to that found in our most severe groups, and greater than for PKD1T overall, indicating that rapidly progressive patients were selected.
Some differences in eGFR values were seen at 20y, most notably between PKD1NT1 and other groups (Figure 4E), resulting in a predicted more rapid rate of decline in PKD1NT1 than PKD1T patients. It is not clear if this reflects hyperfiltration in this group at this age, whereas hyperfiltration in the PKD1T group may have been at an even earlier time (37, 38), or because of the relatively few data points for the PKD1NT1 Analysis Cohort at young ages. Some differences in fit of the trajectory plots to the Analysis and Validation cohorts were seen (Figure 4, Figure 5, Supplemental Table 5, and Supplemental Table 7). At least partly, these may reflect the selective nature of the HALT PKD population, which lacks older patients with conserved renal function, younger patients with reduced eGFR, and htTKV data in older patients (Supplemental Table 3) (39, 40).
The rate of growth of htTKV did not differ between genotypic groups, but it did appear to slow as patients aged; the rate at 55y is only ~60% of that at 25y. However, since PKD1T kidneys were more than twice the size of PKD2 or PKD1NT2 at 25y, with exponential growth (or close to it), PKD1T kidneys were more than twice the size of PKD2 at 55y (27). The observed average rate of htTKV growth for each MIC (Figure 5) was greater than predicted (<1.5 to >6%; MIC-1A to -1E) if starting from a common size at birth (21), and it also differed over time. While the growth rates of the milder groups increased over time, the rates decreased for the more severe groups (the most severe cases may have reached ESKD), so that the difference in growth rate between the most severe and mildest was only 2-fold at 55y. This is reflected in 138 patients changing from the baseline MIC during the course of the study, 86 moving to a higher group and 53 to a lower group. Although the growth rates differed between MICs, a major reason why MIC-1E kidneys are much larger than -1A (~14× at 45y) is that, even at 20y, MIC-1E kidneys are ~4× the size of -1A. If the MIC-1E and -1A trajectories are projected back into childhood, the size of the kidneys are similar around 5 years of age, when the MIC-1A growth rate becomes flat while -1E is at ~15% year. Therefore, it is likely that an early burst of childhood/in-utero growth is a major factor why rapidly progressive cases have large htTKVs (41, 42), reflecting rapid early cyst initiation and resulting in increased cystic burden in severe kidneys in adulthood (27). Therefore, the value of the htTKV/age-determined MICs for detecting patients with more severe disease is enhanced by capturing both the early burst of growth and higher growth rates as adults.
Methods
Patient data
Clinical and demographic information was abstracted on each patient, and included the following: date of birth, sex, race, dates, and values of all available serum creatinine and TKV measurements after 15 years of age and before ESKD, ESKD date, height, and weight. Baseline data were defined as the first available eGFR and htTKV data after 15y and before the onset of ESKD. BMI was calculated without removing kidney and liver weight (TKV and liver volumes were not available for all patients).
Genetic characterization
Mutation screening was performed by Sanger sequencing or employing a next-generation sequencing panel (11, 43, 44). Patients with PKD1 mutations were categorized into truncating (PKD1T; inactivating; previously termed MSG1) or nontruncating changes predicted to be fully penetrant (PKD1NT1; MSG2) or hypomorphic (PKD1NT2; MSG3). This characterization was based on information about the chemical strength of the substitution, the conservation of the residue in orthologs and domains, and other structural considerations, as previously described (MSG1, -2, and -3) (9).
Renal outcomes
eGFR was calculated using the CKD Epidemiology Collaboration (CKD-EPI) formula (45). TKV was measured using planimetry or stereology techniques on coronal and axial abdominal scans, including using automated methods (46, 47), and was adjusted for height (htTKV) for the analysis (19). ESKD was defined as the date of initiation of chronic dialysis or renal transplant, or eGFR persistently below 15 mL/min per 1.73 m2, if renal replacement therapy data were unavailable. Patients with at least 1 htTKV were assigned a MIC at baseline (21).
Study Populations
Analysis Cohort.
Patients with a clinical ADPKD phenotype seen at Mayo Clinic, genetically defined as PKD1 or PKD2 and with a typical MIC, were considered for the Analysis Cohort (N = 1328; Figure 1). Subjects with complex genotypes or missing clinical data within the timescale of the study were excluded, leaving 1079 for the renal survival analysis (Figure 1) (33, 44). Other exclusions were implemented depending on the measured outcome (Figure 1).
Validation Cohort.
Non–Mayo Clinic patients from the CRISP and HALT PKD studies were similarly selected for PKD1 and PKD2 cases, without genetic complexity and atypical MIC, for the Validation Cohort (Figure 1) (18, 39, 40). Data covering the 5–7 years of HALT PKD and up to 15 years of follow-up in CRISP were employed. The Validation Cohort was employed for the trajectory analysis.
Statistics
Endpoints studied were time to onset of ESKD from birth and time from baseline to ESKD (censored by death from nonrenal causes or loss to follow-up), to the composite events of ESKD or 50% reduction in eGFR, or time to 50% increase in htTKV. In addition, the trajectory of eGFR decline or htTKV increase were measured. Variables of interest were: genotypic group, sex, and baseline-typical MIC, BMI, and eGFR. Results for continuous variables were expressed in terms of mean (± SD) for normal distributions and median (IQR) for skewed distributions; results for categorical variables were expressed as percentages. When comparing baseline characteristics of study participants by genotype, P values were derived from the Kruskal Wallis test for continuous variables and χ2 tests for categorical variables.
Both the percentage of patients who were free of ESKD overtime from birth and from baseline were estimated using the Kaplan-Meier method. Differences in the risk of ESKD from baseline, by genotype and MIC, were evaluated using the log-rank test. Factors associated with renal survival from baseline were estimated using univariate and multivariate Cox proportional hazards models, with age as the timescale, and reported as HR with 95% CI. Discriminatory ability was quantified using the C-index (area under the receiver operator characteristic curve).
To evaluate the associations between eGFR and htTKV over time by genotypic group, models were developed by fitting eGFR and natural log (ln) htTKV (ln[htTKV]) trajectories using a mixed models framework with random effects for subject and fixed effects for all other covariates to the Analysis Cohort. The goodness of fit between nested models were compared using the LRT. Predicted values and associated 95% CI, as well as slopes derived from the eGFR model and percentage change derived from the htTKV model, were reported across age groups by genotype and MIC.
For the validation analysis, baseline characteristics from patients in the Analysis and Validation cohorts were compared using the 2-sample equal variance 2-tailed t test for continuous variables and the χ2 test for categorical variables. For goodness-of-fit assessment, the models were used to predict eGFR and htTKV values across different age groups in both the Analysis and Validation cohorts, by genotype and MIC. Prediction groups were stratified according to age categories: 15–29, 30–39, 40–49, and 50–65 and separately for genotype and MIC groups. Within each group, the estimated mean (± SEM) paired difference between the predicted and observed value for each subject was calculated using bootstrap analysis with 1000 repetitions. P < 0.05 was considered to indicate statistically significant differences. All calculations were performed using SAS software, version 9.4, or R version 3.4.2.
Study approval
This study was approved by the Mayo Clinic IRB and the IRBs of the CRISP and HALT PKD study sites at: University of Chicago School of Medicine, Emory University School of Medicine, Tufts University School of Medicine, University of Alabama, Birmingham, Cleveland Clinic, Beth Israel Deaconess Medical Center, University of Colorado Denver Anschutz Medical Campus, University of Pittsburgh School of Medicine, and Kansas University Medical Center. All patients gave informed consent.
Author contributions
SL collected data on the patient cohort, analyzed it, and wrote the first draft of the paper. LEV designed, performed, and prepared for publication the statistical analysis. SRS performed the mutation screening. TLK designed tools and performed kidney imaging analysis. ABC, RDP, MM, WEB, TIS, FFRO, and GMB collected and provided clinical data. KTB provided imaging services. DL performed statistical services. FTC, ASLY, and VET collected and provided clinical information and participated in the design of the study. PCH designed and oversaw the study and prepared the final manuscript. All authors edited the manuscript and approved the final version. The HALT PKD and CRISP studies provided patient data for the Validation Cohort.
Supplementary Material
Acknowledgments
The patients and coordinators involved in the Analysis and Validation cohorts are thanked for their participation and efforts. Other investigators thanked for help with these studies are M.E. Edwards and C.D. Madsen (Mayo Clinic), and other investigators in HALT PKD and CRISP, including K.Z. Abebe and C.G. Moore (University of Pittsburgh) F.T. Winklhofer (University of Kansas), P.G. Czarnecki (Beth Israel), M.C. Hogan (Mayo Clinic), and D.C. Miskulin (Tufts University). The study was supported by:NIDDK grant DK058816 (to PCH); the Mayo Clinic Robert M. and Billie Kelley Pirnie Translational Polycystic Kidney Disease Center (DK090728; to VET); the Zell Family Foundation; and Robert M. and Billie Kelley Pirnie.
The CRISP and HALT PKD studies were supported by cooperative agreements from the NIDDK (DK056943, DK056956, DK056957, and DK056961 and DK062410, DK062408, DK062402, DK082230, DK062411, and DK062401, respectively) and National Center for Research Resources General Clinical Research Centers (RR000039, RR000585, RR000054, RR000051, RR023940, and RR001032), and National Center for Advancing Translational Sciences Clinical and Translational Science Awards (RR025008, TR000454, RR024150, TR00135, RR025752, TR001064, RR025780, TR001082, RR025758, TR001102, RR033179, and TR000001) to the participating centers.
Version 1. 07/07/2020
In-Press Preview
Version 2. 08/06/2020
Electronic publication
Funding Statement
Mayo Clinic Robert M. and Billie Kelley Pirnie Translational Polycystic Kidney Disease Center
Footnotes
Conflict of interest: ABC reports grants and/or other activities with Reata, Sanofi, Otsuka, and Jannsen. RDP reports grants and/or other activities with Otsuka, Sanofi, Reata, Kadmon, and Palladio. MM reports grants and/or other activities with Otsuka, Kadmon, and Reata. KTB reports grants and/or other activities with Kadmon, Otsuka, and Sanofi. ASLY reports grants and/or other activities with Regulus, Otsuka, Sanofi, and Calico. VET reports grants and/or other activities with Otsuka, Palladio, Mironid, Sanofi, Blueprint Medicines, and Reata. PCH reports grants and/or other activities with Otsuka, Mitobridge, Regulus, Vertex, and Navitor.
Copyright: © 2020, American Society for Clinical Investigation.
Reference information: JCI Insight. 2020;5(15):e138724.https://doi.org/10.1172/jci.insight.138724.
Contributor Information
Sravanthi Lavu, Email: lavu.sravanthi@mayo.edu.
Lisa E. Vaughan, Email: vaughan.lisa@mayo.edu.
Sarah R. Senum, Email: senum.sarah@mayo.edu.
Timothy L. Kline, Email: kline.timothy@mayo.edu.
Arlene B. Chapman, Email: Achapman1@medicine.bsd.uchicago.edu.
Ronald D. Perrone, Email: rperrone@tuftsmedicalcenter.org.
Michal Mrug, Email: mmrug@uab.edu.
William E. Braun, Email: braunw@ccf.org.
Theodore I. Steinman, Email: tsteinma@bidmc.harvard.edu.
Frederic F. Rahbari-Oskoui, Email: frahbar@emory.edu.
Godela M. Brosnahan, Email: GODELA.BROSNAHAN@CUANSCHUTZ.EDU.
Kyongtae T. Bae, Email: baek@upmc.edu.
Douglas Landsittel, Email: dpl12@pitt.edu.
Fouad T. Chebib, Email: chebib.fouad@mayo.edu.
Vicente E. Torres, Email: torres.vicente@mayo.edu.
References
- 1.Suwabe T, et al. Epidemiology of Autosomal Dominant Polycystic Kidney Disease in Olmsted County. Clin J Am Soc Nephrol. 2020;15(1):69–79. doi: 10.2215/CJN.05900519. [DOI] [PMC free article] [PubMed] [Google Scholar]
- 2.Torres VE, Harris PC, Pirson Y. Autosomal dominant polycystic kidney disease. Lancet. 2007;369(9569):1287–1301. doi: 10.1016/S0140-6736(07)60601-1. [DOI] [PubMed] [Google Scholar]
- 3.Spithoven EM, et al. Renal replacement therapy for autosomal dominant polycystic kidney disease (ADPKD) in Europe: prevalence and survival--an analysis of data from the ERA-EDTA Registry. Nephrol Dial Transplant. 2014;29 Suppl 4:iv15–iv25. doi: 10.1093/ndt/gfu017. [DOI] [PMC free article] [PubMed] [Google Scholar]
- 4. [No authors listed]. United States Renal Data System, 2018 USDRS annual data report: Epidemiology of kidney disease in the United States. United States Renal Data System. https://www.usrds.org/2018/view/Default.aspx Accessed July 7, 2020.
- 5.[No authors listed] The polycystic kidney disease 1 gene encodes a 14 kb transcript and lies within a duplicated region on chromosome 16. The European Polycystic Kidney Disease Consortium. Cell. 1994;78(4):725. [PubMed] [Google Scholar]
- 6.[No authors listed] Polycystic kidney disease: the complete structure of the PKD1 gene and its protein. The International Polycystic Kidney Disease Consortium. Cell. 1995;81(2):289–298. doi: 10.1016/0092-8674(95)90339-9. [DOI] [PubMed] [Google Scholar]
- 7.Hughes J, et al. The polycystic kidney disease 1 (PKD1) gene encodes a novel protein with multiple cell recognition domains. Nat Genet. 1995;10(2):151–160. doi: 10.1038/ng0695-151. [DOI] [PubMed] [Google Scholar]
- 8.Mochizuki T, et al. PKD2, a gene for polycystic kidney disease that encodes an integral membrane protein. Science. 1996;272(5266):1339–1342. doi: 10.1126/science.272.5266.1339. [DOI] [PubMed] [Google Scholar]
- 9.Heyer CM, et al. Predicted Mutation Strength of Nontruncating PKD1 Mutations Aids Genotype-Phenotype Correlations in Autosomal Dominant Polycystic Kidney Disease. J Am Soc Nephrol. 2016;27(9):2872–2884. doi: 10.1681/ASN.2015050583. [DOI] [PMC free article] [PubMed] [Google Scholar]
- 10.Porath B, et al. Mutations in GANAB, Encoding the Glucosidase IIα Subunit, Cause Autosomal-Dominant Polycystic Kidney and Liver Disease. Am J Hum Genet. 2016;98(6):1193–1207. doi: 10.1016/j.ajhg.2016.05.004. [DOI] [PMC free article] [PubMed] [Google Scholar]
- 11.Cornec-Le Gall E, et al. Monoallelic Mutations to DNAJB11 Cause Atypical Autosomal-Dominant Polycystic Kidney Disease. Am J Hum Genet. 2018;102(5):832–844. doi: 10.1016/j.ajhg.2018.03.013. [DOI] [PMC free article] [PubMed] [Google Scholar]
- 12.Besse W, et al. ALG9 Mutation Carriers Develop Kidney and Liver Cysts. J Am Soc Nephrol. 2019;30(11):2091–2102. doi: 10.1681/ASN.2019030298. [DOI] [PMC free article] [PubMed] [Google Scholar]
- 13.Torres VE, et al. Tolvaptan in patients with autosomal dominant polycystic kidney disease. N Engl J Med. 2012;367(25):2407–2418. doi: 10.1056/NEJMoa1205511. [DOI] [PMC free article] [PubMed] [Google Scholar]
- 14.Torres VE, et al. Tolvaptan in Later-Stage Autosomal Dominant Polycystic Kidney Disease. N Engl J Med. 2017;377(20):1930–1942. doi: 10.1056/NEJMoa1710030. [DOI] [PubMed] [Google Scholar]
- 15.Chebib FT, et al. A Practical Guide for Treatment of Rapidly Progressive ADPKD with Tolvaptan. J Am Soc Nephrol. 2018;29(10):2458–2470. doi: 10.1681/ASN.2018060590. [DOI] [PMC free article] [PubMed] [Google Scholar]
- 16.Cornec-Le Gall E, et al. Type of PKD1 mutation influences renal outcome in ADPKD. J Am Soc Nephrol. 2013;24(6):1006–1013. doi: 10.1681/ASN.2012070650. [DOI] [PMC free article] [PubMed] [Google Scholar]
- 17.Cornec-Le Gall E, et al. The PROPKD Score: A New Algorithm to Predict Renal Survival in Autosomal Dominant Polycystic Kidney Disease. J Am Soc Nephrol. 2016;27(3):942–951. doi: 10.1681/ASN.2015010016. [DOI] [PMC free article] [PubMed] [Google Scholar]
- 18.Grantham JJ, et al. Volume progression in polycystic kidney disease. N Engl J Med. 2006;354(20):2122–2130. doi: 10.1056/NEJMoa054341. [DOI] [PubMed] [Google Scholar]
- 19.Chapman AB, et al. Kidney volume and functional outcomes in autosomal dominant polycystic kidney disease. Clin J Am Soc Nephrol. 2012;7(3):479–486. doi: 10.2215/CJN.09500911. [DOI] [PMC free article] [PubMed] [Google Scholar]
- 20.Yu ASL, et al. Baseline total kidney volume and the rate of kidney growth are associated with chronic kidney disease progression in Autosomal Dominant Polycystic Kidney Disease. Kidney Int. 2018;93(3):691–699. doi: 10.1016/j.kint.2017.09.027. [DOI] [PMC free article] [PubMed] [Google Scholar]
- 21.Irazabal MV, et al. Imaging classification of autosomal dominant polycystic kidney disease: a simple model for selecting patients for clinical trials. J Am Soc Nephrol. 2015;26(1):160–172. doi: 10.1681/ASN.2013101138. [DOI] [PMC free article] [PubMed] [Google Scholar]
- 22.Franz KA, Reubi FC. Rate of functional deterioration in polycystic kidney disease. Kidney Int. 1983;23(3):526–529. doi: 10.1038/ki.1983.51. [DOI] [PubMed] [Google Scholar]
- 23.Klahr S, et al. Dietary protein restriction, blood pressure control, and the progression of polycystic kidney disease. Modification of Diet in Renal Disease Study Group. J Am Soc Nephrol. 1995;5(12):2037–2047. doi: 10.1681/ASN.V5122037. [DOI] [PubMed] [Google Scholar]
- 24.Higashihara E, Horie S, Muto S, Mochizuki T, Nishio S, Nutahara K. Renal disease progression in autosomal dominant polycystic kidney disease. Clin Exp Nephrol. 2012;16(4):622–628. doi: 10.1007/s10157-012-0611-9. [DOI] [PMC free article] [PubMed] [Google Scholar]
- 25.Brosnahan GM, et al. Patterns of Kidney Function Decline in Autosomal Dominant Polycystic Kidney Disease: A Post Hoc Analysis From the HALT-PKD Trials. Am J Kidney Dis. 2018;71(5):666–676. doi: 10.1053/j.ajkd.2017.10.023. [DOI] [PMC free article] [PubMed] [Google Scholar]
- 26.Yu ASL, et al. Long-term trajectory of kidney function in autosomal-dominant polycystic kidney disease. Kidney Int. 2019;95(5):1253–1261. doi: 10.1016/j.kint.2018.12.023. [DOI] [PMC free article] [PubMed] [Google Scholar]
- 27.Harris PC, et al. Cyst number but not the rate of cystic growth is associated with the mutated gene in autosomal dominant polycystic kidney disease. J Am Soc Nephrol. 2006;17(11):3013–3019. doi: 10.1681/ASN.2006080835. [DOI] [PubMed] [Google Scholar]
- 28.Cornec-Le Gall E, et al. Can we further enrich autosomal dominant polycystic kidney disease clinical trials for rapidly progressive patients? Application of the PROPKD score in the TEMPO trial. Nephrol Dial Transplant. 2018;33(4):645–652. doi: 10.1093/ndt/gfx188. [DOI] [PMC free article] [PubMed] [Google Scholar]
- 29.Nowak KL, et al. Overweight and Obesity Are Predictors of Progression in Early Autosomal Dominant Polycystic Kidney Disease. J Am Soc Nephrol. 2018;29(2):571–578. doi: 10.1681/ASN.2017070819. [DOI] [PMC free article] [PubMed] [Google Scholar]
- 30.Dalgaard OZ. Bilateral polycystic disease of the kidneys; a follow-up of two hundred and eighty-four patients and their families. Acta Med Scand Suppl. 1957;328:1–255. [PubMed] [Google Scholar]
- 31.Gabow PA, et al. Factors affecting the progression of renal disease in autosomal-dominant polycystic kidney disease. Kidney Int. 1992;41(5):1311–1319. doi: 10.1038/ki.1992.195. [DOI] [PubMed] [Google Scholar]
- 32.Hwang YH, et al. Refining Genotype-Phenotype Correlation in Autosomal Dominant Polycystic Kidney Disease. J Am Soc Nephrol. 2016;27(6):1861–1868. doi: 10.1681/ASN.2015060648. [DOI] [PMC free article] [PubMed] [Google Scholar]
- 33.Cornec-Le Gall E, Torres VE, Harris PC. Genetic Complexity of Autosomal Dominant Polycystic Kidney and Liver Diseases. J Am Soc Nephrol. 2018;29(1):13–23. doi: 10.1681/ASN.2017050483. [DOI] [PMC free article] [PubMed] [Google Scholar]
- 34.Gansevoort RT, et al. Recommendations for the use of tolvaptan in autosomal dominant polycystic kidney disease: a position statement on behalf of the ERA-EDTA Working Groups on Inherited Kidney Disorders and European Renal Best Practice. Nephrol Dial Transplant. 2016;31(3):337–348. doi: 10.1093/ndt/gfv456. [DOI] [PMC free article] [PubMed] [Google Scholar]
- 35.Parfrey PS, et al. The diagnosis and prognosis of autosomal dominant polycystic kidney disease. N Engl J Med. 1990;323(16):1085–1090. doi: 10.1056/NEJM199010183231601. [DOI] [PubMed] [Google Scholar]
- 36.Ong AC, Harris PC. A polycystin-centric view of cyst formation and disease: the polycystins revisited. Kidney Int. 2015;88(4):699–710. doi: 10.1038/ki.2015.207. [DOI] [PMC free article] [PubMed] [Google Scholar]
- 37.Helal I, et al. Glomerular hyperfiltration and renal progression in children with autosomal dominant polycystic kidney disease. Clin J Am Soc Nephrol. 2011;6(10):2439–2443. doi: 10.2215/CJN.01010211. [DOI] [PMC free article] [PubMed] [Google Scholar]
- 38.Wong H, Vivian L, Weiler G, Filler G. Patients with autosomal dominant polycystic kidney disease hyperfiltrate early in their disease. Am J Kidney Dis. 2004;43(4):624–628. doi: 10.1053/j.ajkd.2003.12.026. [DOI] [PubMed] [Google Scholar]
- 39.Schrier RW, et al. Blood pressure in early autosomal dominant polycystic kidney disease. N Engl J Med. 2014;371(24):2255–2266. doi: 10.1056/NEJMoa1402685. [DOI] [PMC free article] [PubMed] [Google Scholar]
- 40.Torres VE, et al. Angiotensin blockade in late autosomal dominant polycystic kidney disease. N Engl J Med. 2014;371(24):2267–2276. doi: 10.1056/NEJMoa1402686. [DOI] [PMC free article] [PubMed] [Google Scholar]
- 41.Grantham JJ, Cook LT, Wetzel LH, Cadnapaphornchai MA, Bae KT. Evidence of extraordinary growth in the progressive enlargement of renal cysts. Clin J Am Soc Nephrol. 2010;5(5):889–896. doi: 10.2215/CJN.00550110. [DOI] [PMC free article] [PubMed] [Google Scholar]
- 42.Fick-Brosnahan GM, Tran ZV, Johnson AM, Strain JD, Gabow PA. Progression of autosomal-dominant polycystic kidney disease in children. Kidney Int. 2001;59(5):1654–1662. doi: 10.1046/j.1523-1755.2001.0590051654.x. [DOI] [PubMed] [Google Scholar]
- 43.Rossetti S, et al. Comprehensive molecular diagnostics in autosomal dominant polycystic kidney disease. J Am Soc Nephrol. 2007;18(7):2143–2160. doi: 10.1681/ASN.2006121387. [DOI] [PubMed] [Google Scholar]
- 44.Hopp K, et al. Detection and characterization of mosaicism in autosomal dominant polycystic kidney disease. Kidney Int. 2020;97(2):370–382. doi: 10.1016/j.kint.2019.08.038. [DOI] [PMC free article] [PubMed] [Google Scholar]
- 45.Levey AS, et al. A new equation to estimate glomerular filtration rate. Ann Intern Med. 2009;150(9):604–612. doi: 10.7326/0003-4819-150-9-200905050-00006. [DOI] [PMC free article] [PubMed] [Google Scholar]
- 46.Kline TL, et al. Performance of an Artificial Multi-observer Deep Neural Network for Fully Automated Segmentation of Polycystic Kidneys. J Digit Imaging. 2017;30(4):442–448. doi: 10.1007/s10278-017-9978-1. [DOI] [PMC free article] [PubMed] [Google Scholar]
- 47.van Gastel MDA, Edwards ME, Torres VE, Erickson BJ, Gansevoort RT, Kline TL. Automatic Measurement of Kidney and Liver Volumes from MR Images of Patients Affected by Autosomal Dominant Polycystic Kidney Disease. J Am Soc Nephrol. 2019;30(8):1514–1522. doi: 10.1681/ASN.2018090902. [DOI] [PMC free article] [PubMed] [Google Scholar]
Associated Data
This section collects any data citations, data availability statements, or supplementary materials included in this article.


