

Abstract
The axon initial segment (AIS) is involved in action potential initiation. Structural and biophysical characteristics of the AIS differ among cell types and/or brain regions, but the underlying mechanisms remain elusive. Using immunofluorescence and electrophysiological methods, combined with super-resolution imaging, we show in the developing nucleus magnocellularis of the chicken in both sexes that the AIS is refined in a tonotopic region-dependent manner. This process of AIS refinement differs among cells tuned to different frequencies. At hearing onset, the AIS was ∼50 µm long with few voltage-gated sodium channels regardless of tonotopic region. However, after hatching, the AIS matured and displayed an ∼20-µm-long structure with a significant enrichment of sodium channels responsible for an increase in sodium current and a decrease in spike threshold. Moreover, the shortening was more pronounced, while the accumulation of channels was not, in neurons tuned to higher frequency, creating tonotopic differences in the AIS. We conclude that AIS shortening is mediated by disassembly of the cytoskeleton at the distal end of the AIS, despite intact periodicity of the submembranous cytoskeleton across the AIS. Importantly, deprivation of afferent input diminished the shortening in neurons tuned to a higher frequency to a larger extent in posthatch animals, with little effect on the accumulation of sodium channels. Thus, cytoskeletal reorganization and sodium channel enrichment at the AIS are differentially regulated depending on tonotopic region, but work synergistically to optimize neuronal output in the auditory nucleus.
SIGNIFICANCE STATEMENT The axon initial segment (AIS) plays fundamental roles in determining neuronal output. The AIS varies structurally and molecularly across tonotopic regions in avian cochlear nucleus. However, the mechanism underlying these variations remains unclear. The AIS is immature around hearing onset, but becomes shorter and accumulates more sodium channels during maturation, with a pronounced shortening and a moderate channel accumulation at higher tonotopic regions. Afferent input adjusts sodium conductance at the AIS by augmenting AIS shortening (via disassembly of cytoskeletons at its distal end) specifically at higher-frequency regions. However, this had little effect on channel accumulation. Thus, cytoskeletal structure and sodium channel accumulation at the AIS are regulated differentially but work synergistically to optimize the neuronal output.
Keywords: activity, auditory, axon initial segment, cytoskeleton, sodium channel, super resolution imaging
Introduction
The axon initial segment (AIS) is a proximal axonal domain that is responsible for action potential initiation in neurons. The excitability of the AIS is based on its structural and biophysical properties, such as the electrical compactness because of its small size and segregation from the soma, and the accumulation of voltage-gated Na+ (Nav) channels (Kole and Stuart, 2012). It is well known that these properties of the AIS are strictly determined based on cell type and/or brain region (Lorincz and Nusser, 2008; Kuba, 2012). AIS diversity is of particular importance to adjust the excitability of a certain population of neurons in a given neural circuit, thereby coordinating brain function. Nucleus magnocellularis (NM), an avian homolog of mammalian anteroventral cochlear nucleus, is well known for such differentiations of the AIS. NM neurons generate action potentials with high fidelity on receiving phase-locked excitatory inputs from the auditory nerve, and transmit temporal information of sound to higher auditory centers (Trussell, 1999). As in other auditory nuclei, NM is organized tonotopically, in a way that the characteristic frequency (CF) of neurons decreases from rostromedial to caudolateral direction (Rubel and Parks, 1975). NM neurons show different properties along this tonotopic axis (Fukui and Ohmori, 2004; Oline et al., 2016; Wang et al., 2017; Al-Yaari et al., 2020). In particular, the AIS is shorter and accumulates fewer Nav channels at the higher-CF region (Kuba and Ohmori, 2009). This enables individual neurons to generate action potentials in response to the patterns of excitatory input specific to each tonotopic region, ensuring precise and reliable spike output across frequencies. Neuronal activity alters the characteristics of the AIS in various neurons as well as mature NM neurons (Grubb et al., 2011; Yoshimura and Rasband, 2014; Yamada and Kuba, 2016; Jamann et al., 2018). However, it remains unknown how the characteristics of the AIS are determined during development and how this process is regulated by afferent input.
In this study, we examined AIS characteristics at each tonotopic region of NM during development with a particular focus on contributions of afferent input. We found that AIS shortening and accumulation of Nav channels progressed during development, with the shortening augmented and the accumulation suppressed in higher-CF neurons, making sodium conductance smaller in these neurons. Thus, the cytoskeletal and ion channel organization of AIS are differentially regulated, but work synergistically to optimize the sodium conductance in each tonotopic region. Afferent input contributed to this adjustment by augmenting the AIS shortening specifically in higher-CF neurons. Importantly, we examined the periodic submembranous cytoskeleton at the AIS of these neurons, which showed that the shortening occurred via disassembly of the AIS cytoskeleton at its distal end with little alteration of the periodic interval across the AIS.
Materials and Methods
Animals.
Chickens (Gallus domesticus) of either sex between embryonic day 15 (E15) and posthatch day 4 (P4) were used for immunohistochemistry and electrophysiology. The care of experimental animals was in accordance with the regulations on animal experiments at Nagoya University, and the experiments were approved by the institutional committee. The developmental stage of embryos was determined according to the Hamburger and Hamilton (1951) series. Chicks were deeply anesthetized with ether (Nacalai Tesque), and embryos were anesthetized by cooling eggs in ice-cold water.
Classification of tonotopic regions.
We divided the NM into three CF regions, according to the position within the nucleus; the rostromedial one-third of the NM is defined as the high-CF region, the middle one-third as the middle-CF region, and the caudolateral one-third as the low-CF region (Fig. 1A,B). Although a clear relationship between CF and position is found in the NM of late embryos and posthatch chicks (Rubel and Parks, 1975; Lippe and Rubel, 1985), the relationship in early embryos is unknown. Moreover, the CF of neurons may change with development (Lippe, 1995; but see, Jones et al., 2006). Therefore, the CF used here is a relative measure in each age and has no relation to the absolute sound frequency.
Figure 1.
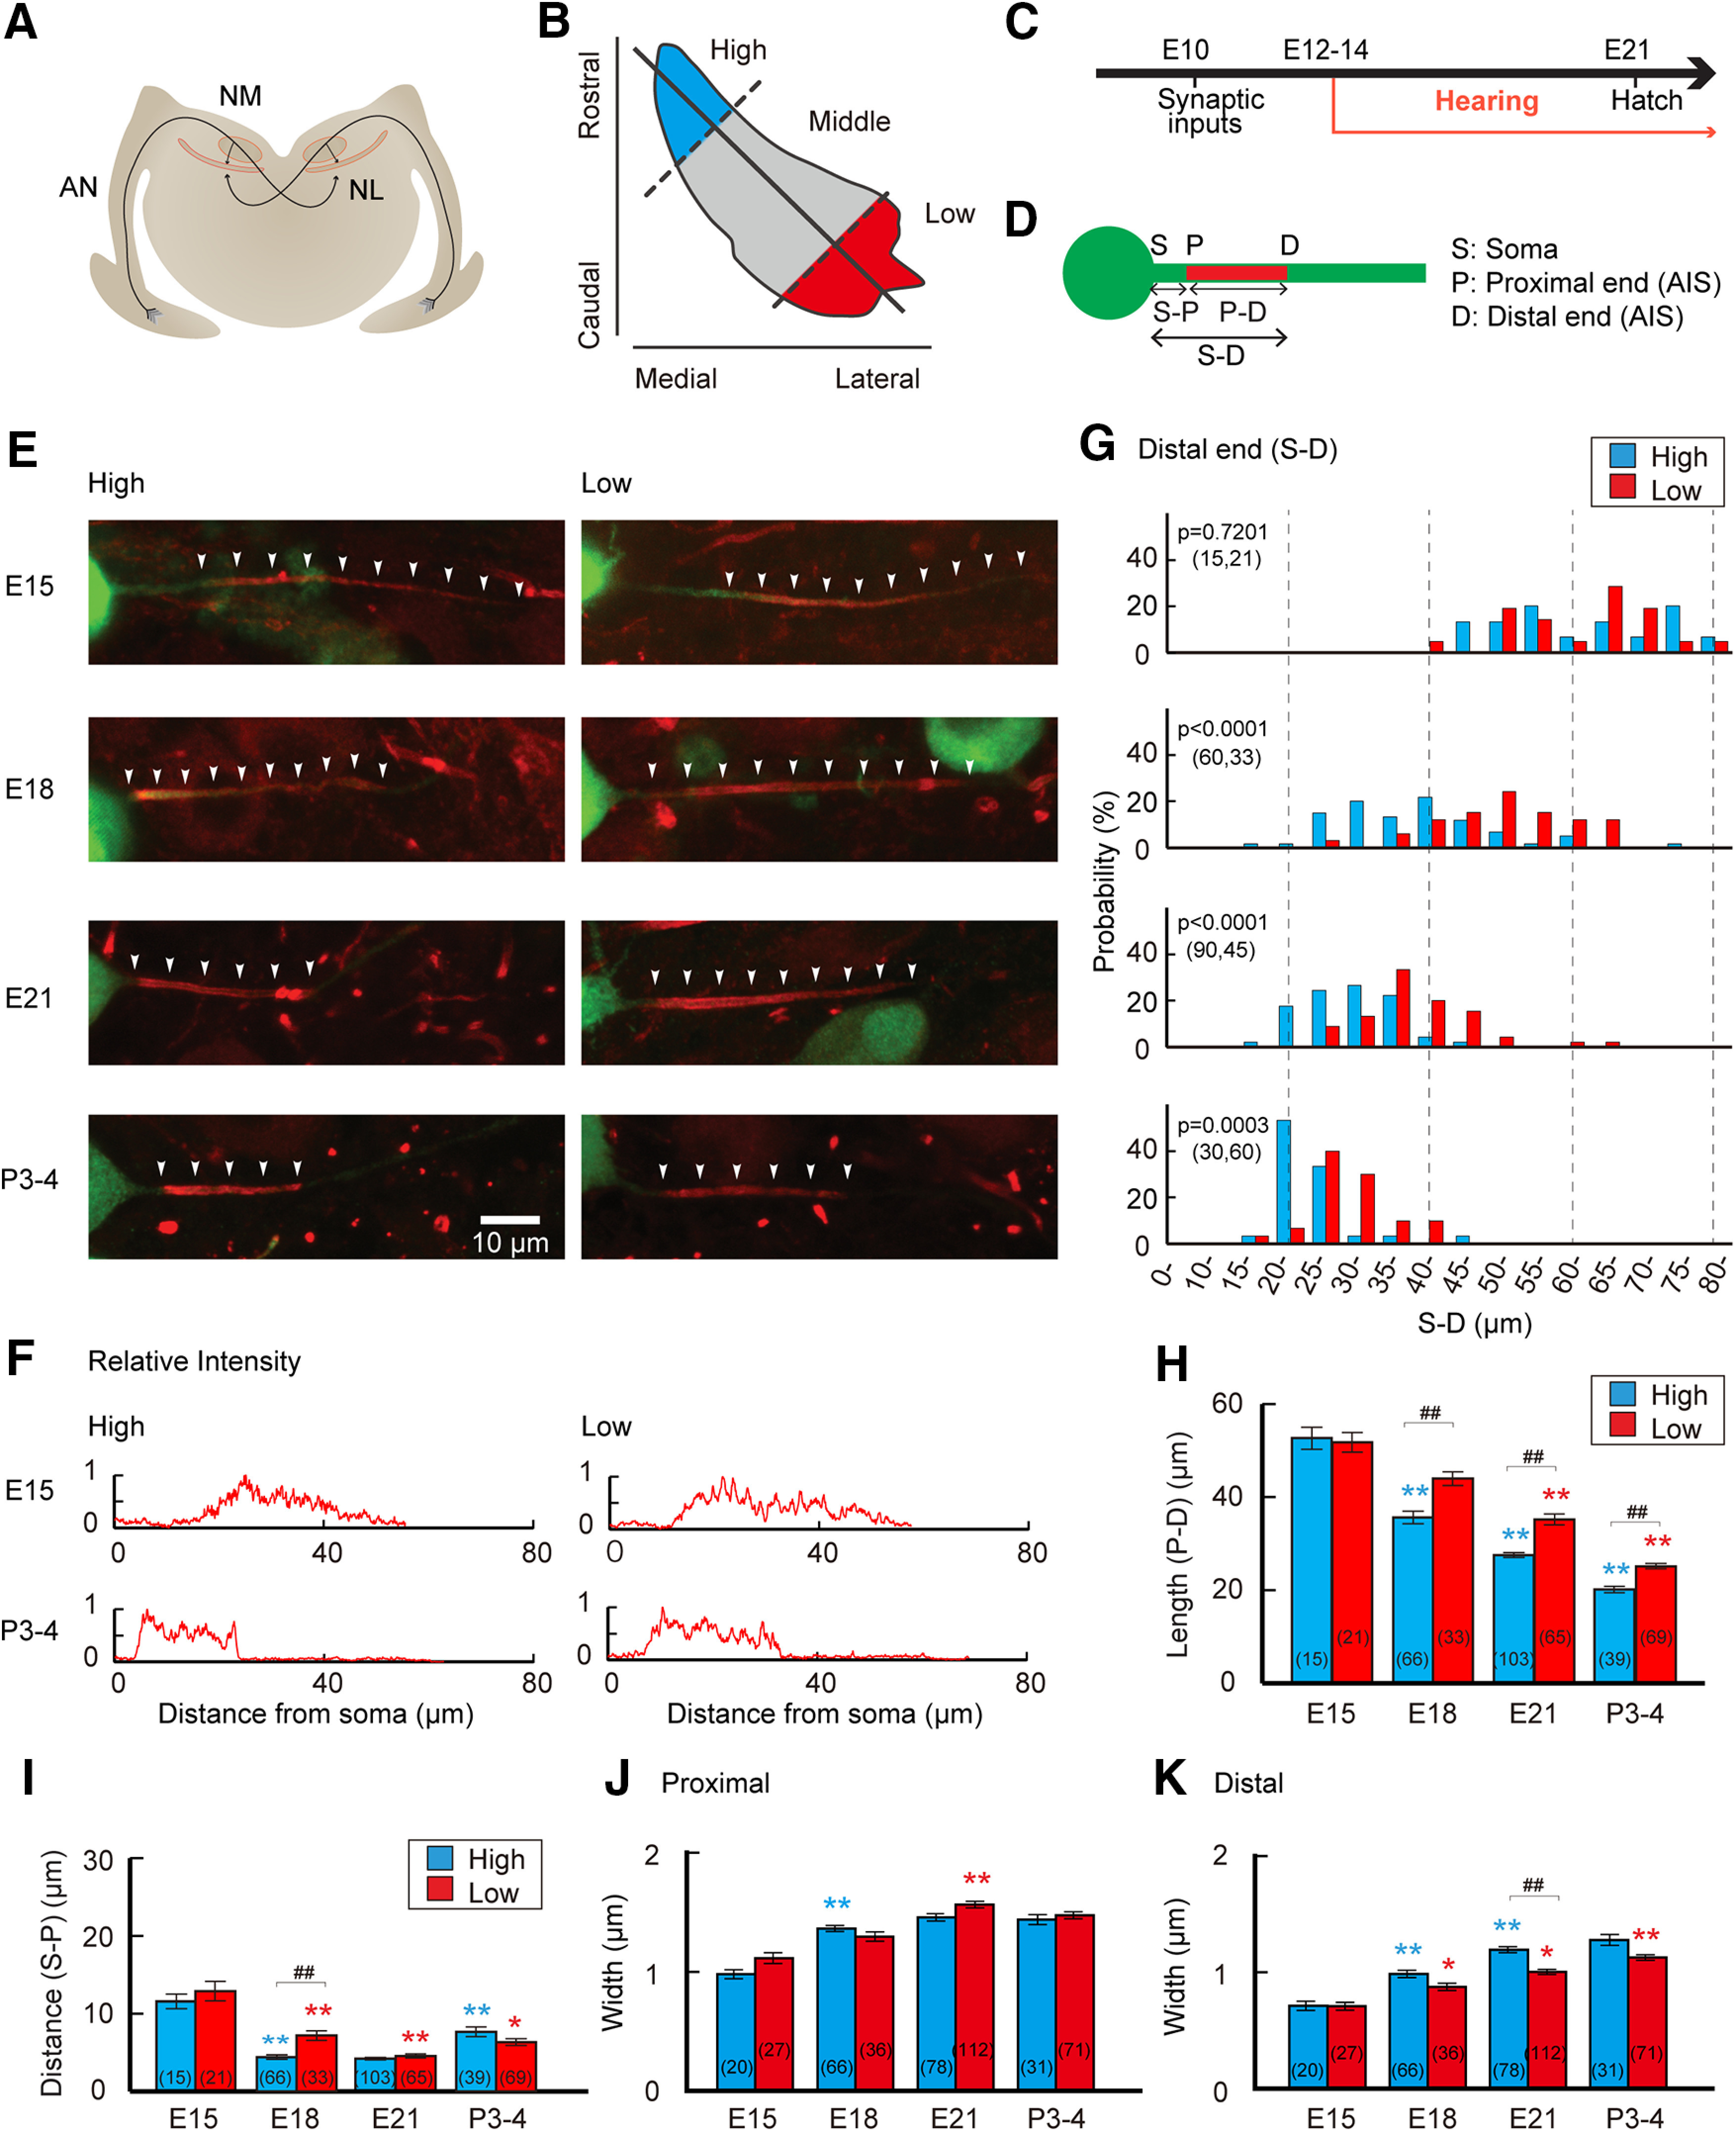
Structural differentiation of the AIS. A, Auditory pathway of the chicken. AN, Auditory nerve; NL, nucleus laminaris. B, Tonotopic regions were based on the position within the NM (Materials and Methods). C, Time course of the development of the avian auditory system. D, Geometric definition of the AIS. E, Distribution of the AIS in high-CF (left) and low-CF (right) regions between E15 and P3–P4. The AIS was immunostained with pan-Nav antibody (red, white arrow heads), while NM neuron (green) was visualized by electrophoretic filling of Alexa Fluor 488 through a patch pipette in acute slices (Materials and Methods). F, Intensity profile of Nav signals at the AIS; E15 (top) and P3–P4 (bottom). G, Histogram of distal end position of the AIS relative to the soma (S–D). Significance was evaluated by Kolmogorov–Smirnov test between high-CF and low-CF regions. H–K, Geometric parameters of the AIS. Length (P–D; H), distance (S–P; I), and widths at proximal (J), and distal (K) ends. Numbers in parenthesis are the number of cells. p < 0.0001 among the groups by Kruskal–Wallis test, in H–K. ##p < 0.01 between tonotopic regions, while *p < 0.05, **p < 0.01 compared with the neighboring younger group by post hoc tests.
Immunohistochemistry.
Guinea pig anti-chick polyclonal Nav1.6 antibody (0.49 µg/ml; Kuba et al., 2006), Nav1.2 antibody (0.68 µg/ml; Kuba et al., 2014), mouse monoclonal pan-Nav antibody (5 µg/ml; Sigma-Aldrich), and rabbit polyclonal ankyrinG antibody (5 µg/ml; Bouzidi et al., 2002) were used for immunohistochemistry. Chicks were perfused transcardially with a periodate-lysine-paraformaldehyde fixative (ml/g body weight), as follows: 1% (w/v) paraformaldehyde, 2.7% (w/v) lysine HCl, 0.21% (w/v) NaIO4, and 0.1% (w/v) Na2HPO4. The brainstem was postfixed for 1.5 h at 4°C. After cryoprotection with 30% (w/w) sucrose in PBS, coronal sections (20–30 µm) were obtained. The sections were incubated overnight with the primary antibodies, then with Invitrogen Alexa Fluor-conjugated secondary antibodies (10 µg/ml; Thermo Fisher Scientific) for 2 h and were observed under a confocal laser-scanning microscope (FV1000, Olympus). Visualization of NM neurons was made with electroporation of dye (Alexa Fluor 488 hydrazide, 4 mm) into a cell via a patch pipette in brain slices. For each image, six to nine confocal planes were Z-stacked with a step of 0.8 µm. Images were analyzed in Fiji (ImageJ). The distal end (D) and proximal end (P) of the AIS were defined as positions at which signals declined to 20% of the maximum. Background was not subtracted. Distance (S–P) and length (P–D) of the AIS were measured between the soma (S) and proximal end, and between the proximal and distal ends, respectively (Fig. 1D). The width of the AIS was measured at positions at 10% from the proximal and distal ends. For the quantification of signal intensity, sections from each animal were coembedded, stained together, and captured with the same microscope setting. The signal intensity of an AIS was measured as an average between proximal and distal ends from >20 AISs in each tonotopic region. The intensity of each AIS was normalized to the average of all AISs in each animal so as to minimize variations in the efficiency of staining among animals, and was used for statistical comparisons. The ratio of signal intensity was calculated in each animal between tonotopic regions.
Super-resolution imaging.
Star 635P-conjugated secondary antibody (5 µg/ml; Abberior Instruments) was used. Super-resolution imaging with stimulated emission depletion (STED) imaging was conducted using an Expert Line STED microscope (Abberior Instruments) with a 640 nm pulsed excitation laser and a 775 nm STED laser (maximum intensity, 1.2 W; pulsed with a 40 MHz repetition rate). The microscopy device was mounted on the camera port of an inverted microscope (IX83, Olympus), equipped with a 100× objective (oil-immersion; numerical aperture, 1.4; Olympus). The pinhole was set to 1.0 Airy units for 650 nm emission. Fluorescence was detected on an avalanche photograph diode, with a detection window Cy5 channel 685/70 nm. Images were deconvolved with the Abberior Instruments software platform Inspector (five cycles of iteration) and those without Z-stack were analyzed in Fiji (ImageJ). Periodicity of signals was defined as the interval between signal peaks. Measurements were made from the intensity profile along the AIS (1–4 µm), and values from three locations were averaged for each AIS.
Electrophysiology.
Coronal brain slices (230–250 µm) were obtained and whole-cell patch-clamp recordings were made as described previously (Kuba et al., 2010). For current-clamp recordings, slices were perfused with the following artificial CSF (in mm): 125 NaCl, 2.5 KCl, 26 NaHCO3, 1.25 NaH2PO4, 2 CaCl2, 1 MgCl2, and 17 glucose, pH 7.3. For voltage-clamp recordings, [Na+]o was decreased to 27.3 mm (ENa = +25.8 mV) by isotonic replacement of Na+ with TEA+ (tetraethylammonium); [Ca2+]o was decreased to 0.5 mm; and 4-aminopyridine (0.2 mm), Cs+ (5 mm), CdCl2 (1 mm), NiCl2 (0.5 mm), SR95531 (10 μm), and DNQX (20 μm) were added to the bath. Pipettes were filled with a K+-based solution (in mm: 113 K-gluconate, 4.5 MgCl2, 0.1 EGTA, 14 Tris2-phosphocreatine, 4 Na2-ATP, 0.3 Tris-GTP, 9 HEPES-KOH, pH 7.2) for current clamp and a Cs+-based solution (in mm: 150 CsCl, 10 NaCl, 0.2 EGTA, and 10 HEPES-CsOH, pH 7.2) for voltage clamp. The electrode capacitance and series resistance (3–7 MΩ) were compensated electronically up to 70%, and data were discarded when the series resistance exceeded 10 MΩ. Recording temperature was 37–38°C for current clamp and ∼20°C for voltage clamp. The liquid junction potential (3.1–8.0 mV) was corrected after the experiments. Data were sampled at 100 kHz and low-pass filtered at 10 kHz.
Spikes were recorded by applying current pulses at an interval of1–2 s with an increment of 40 pA for embryos and 100 pA for posthatch chicks. Threshold current was defined as the minimum current required for spike generation and threshold voltage as the voltage corresponding to an inflection point in the time derivative just above the threshold current. Phase plot of spikes (dV/dt vs membrane voltage relationship) was created at a current just above the threshold current. Steady-state inactivation curve of the sodium current was fitted to a Boltzmann equation, I/Imax = 1/{1 + exp[(Vm – V50)/S]}, where I is the current amplitude, Imax is the maximum current amplitude, Vm is the membrane potential, V50 is a half-inactivation voltage, and S is a slope factor (Kuba and Ohmori, 2009). The amplitude of sodium current was measured at–30 mV in the tail current with the preceding pulses between –100 and–30 mV.
Manipulation of afferent input.
Detailed procedures of manipulating afferent input were described previously (Akter et al., 2018). Afferent input in posthatch animals was deprived monaurally around hatch under anesthesia with subcutaneous injection of chloral hydrate (160 mg/kg; Nacalai Tesque) or pentobarbital (40 mg/kg; Nacalai Tesque) by removing the cochlea with fine forceps after opening the tympanic membrane and oval window, which completely eliminated auditory evoked responses throughout frequencies (Akter et al., 2018). Afferent input in embryos was deprived by removing otocysts bilaterally at E2 (stage 12 or 13), which eliminated both cochlea and auditory nerve bundles (Parks, 1981; Kuba et al., 2014).
Statistics.
Normality of data and equality of variance were evaluated by the Shapiro–Wilk test and F test, respectively. Statistical significance was determined by two-tailed Student's t test or Wilcoxon rank-sum test for comparison between two groups with normal or non-normal distributions, respectively. ANOVA or Kruskal–Wallis test was used for comparison among more than two groups with normal or non-normal distributions, respectively, and post hoc Tukey's test or Steel–Dwass test was used for pairwise comparisons. The level of statistical significance was set at 0.05. Values are presented as the mean ± SE (n = number of cells).
Results
Developmental shortening of the AIS was more prominent in high-CF neurons
We examined the architecture ofthe AIS in NM neurons during development with immunohistochemistry of Nav channels, after visualizing the neurons by injecting Alexa Fluor 488 through a patch pipette in acute slices (Fig. 1). Nav channel signals were clustered on the axon in both high-CF and low-CF neurons at E15, corresponding to the period around hearing onset (Fig. 1C–E). Compared with mature neurons, the AIS was longer, but it did not differ between the high-CF and low-CF neurons in terms of its length (P–D) or distance from the soma (S–P; Fig. 1H,I). The AIS extended slightly toward the soma, making the distance shorter in the developmental stage between E15 and E18 in both neurons (Fig. 1I). This might reflect the initial formation of the AIS, which is known to progress in a proximal direction (Galiano et al., 2012). Indeed, Nav channel immunofluorescence increased gradually at both ends of the AIS at E15, but became more clearly demarcated with maturation (Fig. 1F). Importantly, the distal end of the AIS also moved proximally after E15, and the extent was far larger than that of the proximal end (Fig. 1G). Moreover, the shift was more prominent in high-CF neurons than in low-CF neurons. Accordingly, the length of the AIS decreased to a larger extent in high-CF neurons, and the tonotopic difference became apparent after E18 (Fig. 1H). Interestingly, the position of the distal end varied greatly among cells at E15 regardless of tonotopic region, but this variation became smaller at later periods (Fig. 1G); the variation at 20–80% probability was ∼20 µm, and ∼10 µm at E15 and P3–P4, respectively, suggesting that the final AIS position is determined strictly in mature animals. The width of the AIS was thinner at the distal end of the AIS compared with the proximal end, although both became thicker with age (Fig. 1J,K), presumably because of the maturation of the axon. The AIS was slightly thinner at the distal end in low-CF neurons compared with high-CF neurons after E18, and this could be related to the longer AIS and the tapering of the axon in the neurons.
Periodic structure at the AIS did not differ among ages and tonotopic regions
A periodic submembranous cytoskeleton is known to play fundamental roles in organizing the AIS (Leterrier, 2018). Thus, we used STED super-resolution microscopy to examine the distribution of ankyrinG, the prominent scaffold protein composing the AIS, and to determine whether the reorganization of the AIS included changes in the structure of the periodic cytoskeleton (Fig. 2). The periodic arrangement of ankyrinG observed at E15 was comparable to that reported at the AIS in other types of neurons (Leterrier, 2018) with an interval of ∼170 nm (Fig. 2A–C, top panels). Importantly, the interval was similar between high-CF and low-CF neurons, and it did not change after hatch (Fig. 2A–C, bottom panels) at which the reorganization of the AIS was almost completed. These data demonstrate that the changing location and size of the AIS does not affect the periodicity of the AIS cytoskeleton.
Figure 2.

Periodic submembranous structures at the AIS. A, The AIS imaged by STED microscopy from high-CF (left) and low-CF (right) regions at E15 (top) and P3 (bottom). The AIS was stained with ankyrinG antibody. B, Intensity profile at the box in A. Note that the profile shows periodicity regardless of tonotopic regions and ages. C, Periodic interval of ankyrinG signals. The interval was ∼170 nm in all the conditions. Numbers in parenthesis are the number of AISs. p = 0.9019 among the groups by Kruskal–Wallis test.
Accumulation of AIS molecules was moderate in high-CF neurons
We next compared the density of AIS molecules between high- and low-CF neurons by measuring the intensity of immunosignals (Fig. 3). Intensities of pan-Nav and ankyrinG signals in low-CF neurons were similar to or weaker than those in high-CF neurons at E15, and they showed a significant increase around hatching (E21; Fig. 3A–C). Somatic Nav signals were also weak in low-CF neurons before E21, but the intensity increased to a level similar to that in high-CF neurons around hatch (Fig. 3D). These results suggest that generation as well as axonal targeting of Nav channelproteins is augmented during development, and this is more prominent in low-CF neurons than in high-CF neurons.
Figure 3.
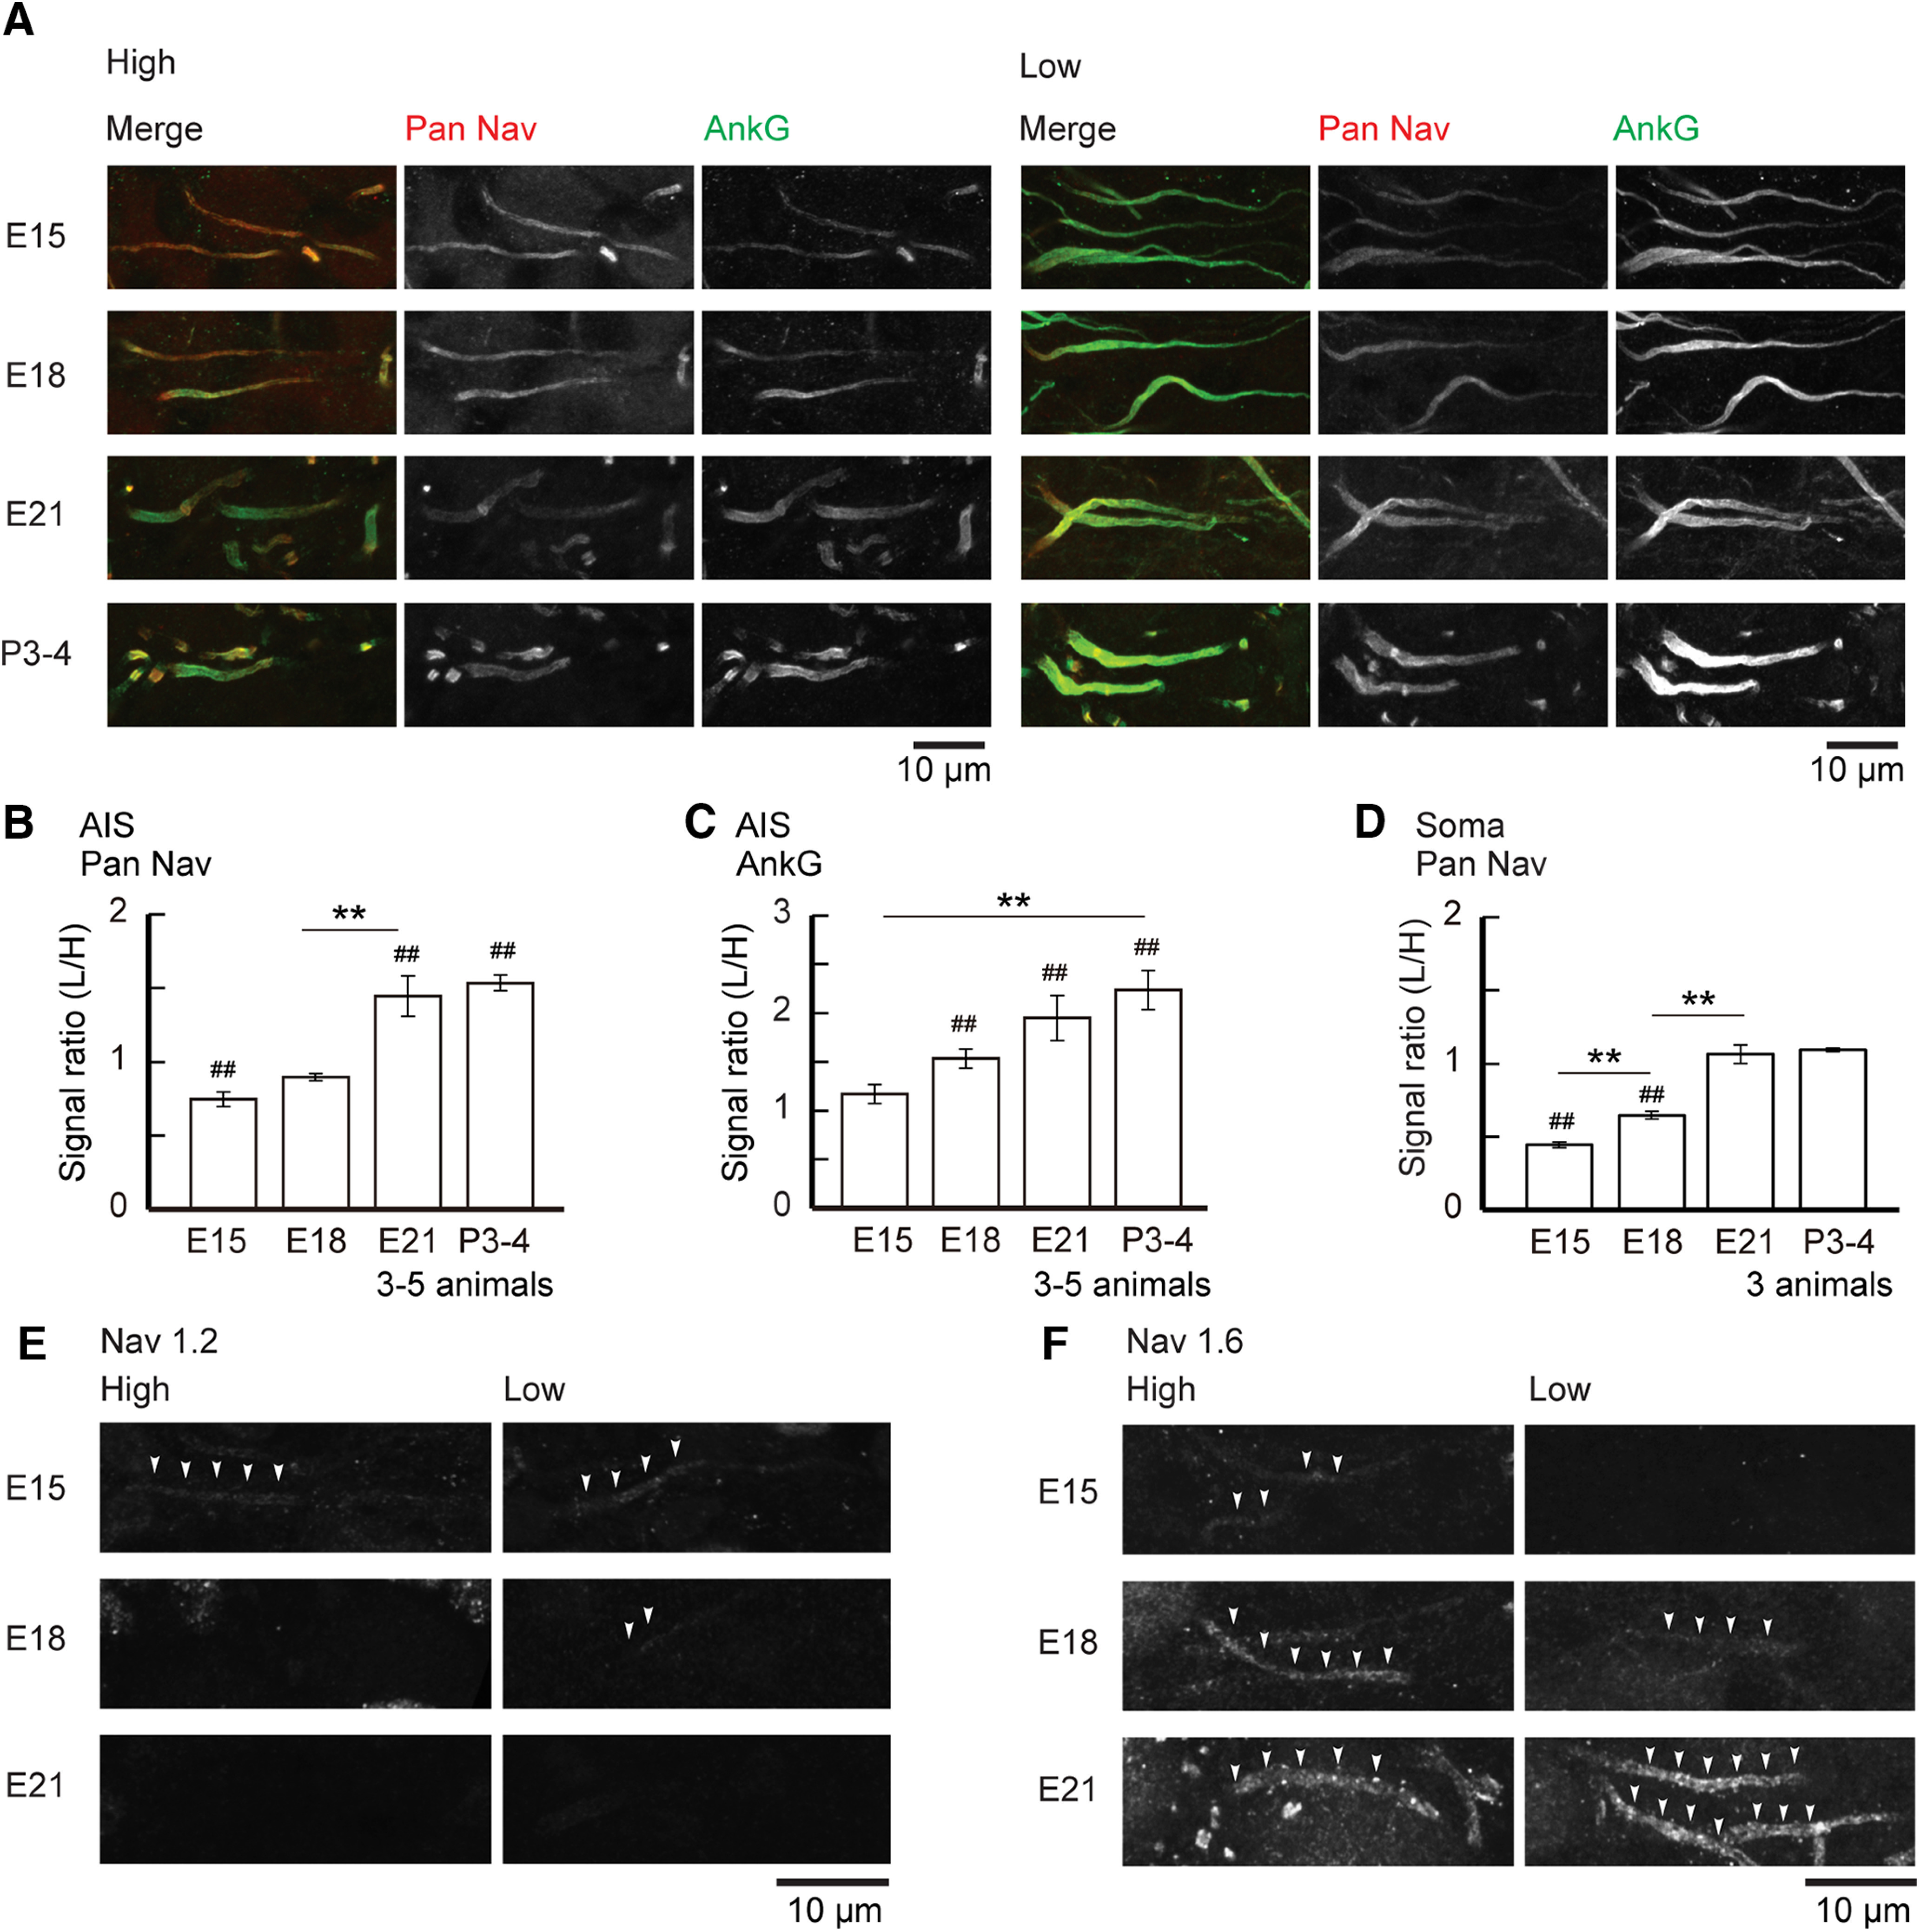
Differentiation of Nav channel expression at the AIS. A, Double immunostaining of pan-Nav (red) and ankyrinG (green) in high-CF (left) and low-CF (right) regions from the same animal between E15 and P3–P4. Both signals became stronger in the low-CF region than in the high-CF region with maturation. B–D, Signal intensity ratio of low-CF region to high-CF region; pan-Nav (B) and ankyrinG (C) at the AIS, and pan-Nav (D) at the soma. Normalized signal intensity before calculating the ratio was used for statistical comparisons (Materials and Methods). E, F, Immunostaining of Nav1.2 (E) and Nav1.6 (F) in high-CF (left) and low-CF (right) regions. Note that Nav1.2 was dominant at E15, but it was completely replaced with Nav1.6 by E21. F(3,26) = 0.202, p = 0.8944; F(1,26) = 24.631, p < 0.0001; F(3,26) = 98.822, p < 0.0001 for age, tonotopy, and interaction, respectively, in B; F(3,22) = 0.8, p = 0.5069; F(1,22) = 185.147, p < 0.0001; F(3,22) = 12.646, p < 0.0001 in C; F(3,16) = 5.612, p = 0.0079; F(1,16) = 300.905, p < 0.0001; F(3,16) = 185.905, p < 0.0001 in D by two-way ANOVA. ##p < 0.01 between tonotopic regions, while **p < 0.01 between ages by post hoc tests.
We then examined the expression of Nav1.2 and Nav1.6 during development (Fig. 3E,F). In both high-CF and low-CF neurons, Nav1.2 was expressed at E15, and it was replaced with Nav1.6 by E21. Notably, this replacement was slightly delayed in low-CF neurons compared with high-CF neurons; Nav1.6 was already observed at E15 and Nav1.2 disappeared completely by E18 in high-CF neurons, whereas Nav1.6 was weak and Nav1.2 remained even at E18 in low-CF neurons.
Development of sodium current was saturated before hatching in high-CF neurons
We next recorded sodium current at the soma in acute slices under voltage clamp (Fig. 4). We applied a preceding pulse (30 ms) between –100 and –30 mV with a 5 mV step from a holding voltage of –90 mV, and evaluated sodium current at–30 mV (Fig. 4A). The amplitude of the sodium current was the largest when the preceding pulse was hyperpolarized, and it decreased with depolarization regardless of ages after E15. The maximum amplitude did not differ between high-CF and low-CF neurons at E15, while it increased with development to a larger extent in low-CF neurons, making the tonotopic difference of the current apparent around hatching (P1–P4; Fig. 4C). We evaluated the voltage dependence of inactivation of the sodium current by plotting the amplitude against the preceding pulse (Fig. 4B). The curve showed a positive shift at E15, particularly in low-CF neurons, while the slope did not differ significantly between tonotopic regions (Fig. 4D,E; but see Hong et al., 2016). The level of space clamp could not account for the positive shift of the curve at E15, because the thickness of the axon and the distribution of axonal Nav channels did not differ greatly between neurons (Fig. 1). It is known that Nav1.6 has more negative voltage dependence values for activation and inactivation than Nav1.2 (Rush et al., 2005). Thus, one possible explanation could be that the shift was related to the delayed replacement of Nav1.2 in the low-CF neurons (Fig. 3E,F). Consistent with this hypothesis, after E18 the voltage dependence did not differ between high-CF and low-CF neurons, the time when Nav1.2 was replaced by Nav1.6. The decay phase of sodium current accelerated with age, which might reflect the faster inactivation kinetics of Nav1.6 compared with Nav1.2 (Zhou and Goldin, 2004), but it was not different between high-CF and low-CF neurons. The decay time constant measured with a prepulse of –70 mV was 1.62 ± 0.05 ms (n = 7) at E15 and 1.08 ± 0.12 ms (n = 13) at P1–P4 in high-CF neurons (p = 0.0397 by Steel–Dwass test), whereas it was 1.65 ± 0.21 ms (n = 6) at E15 and 1.00 ± 0.08 ms (n = 17) at P3–P4 in low-CF neurons (p = 0.0262 by Steel–Dwass test; p < 0.0001 by Kruskal–Wallis test).
Figure 4.
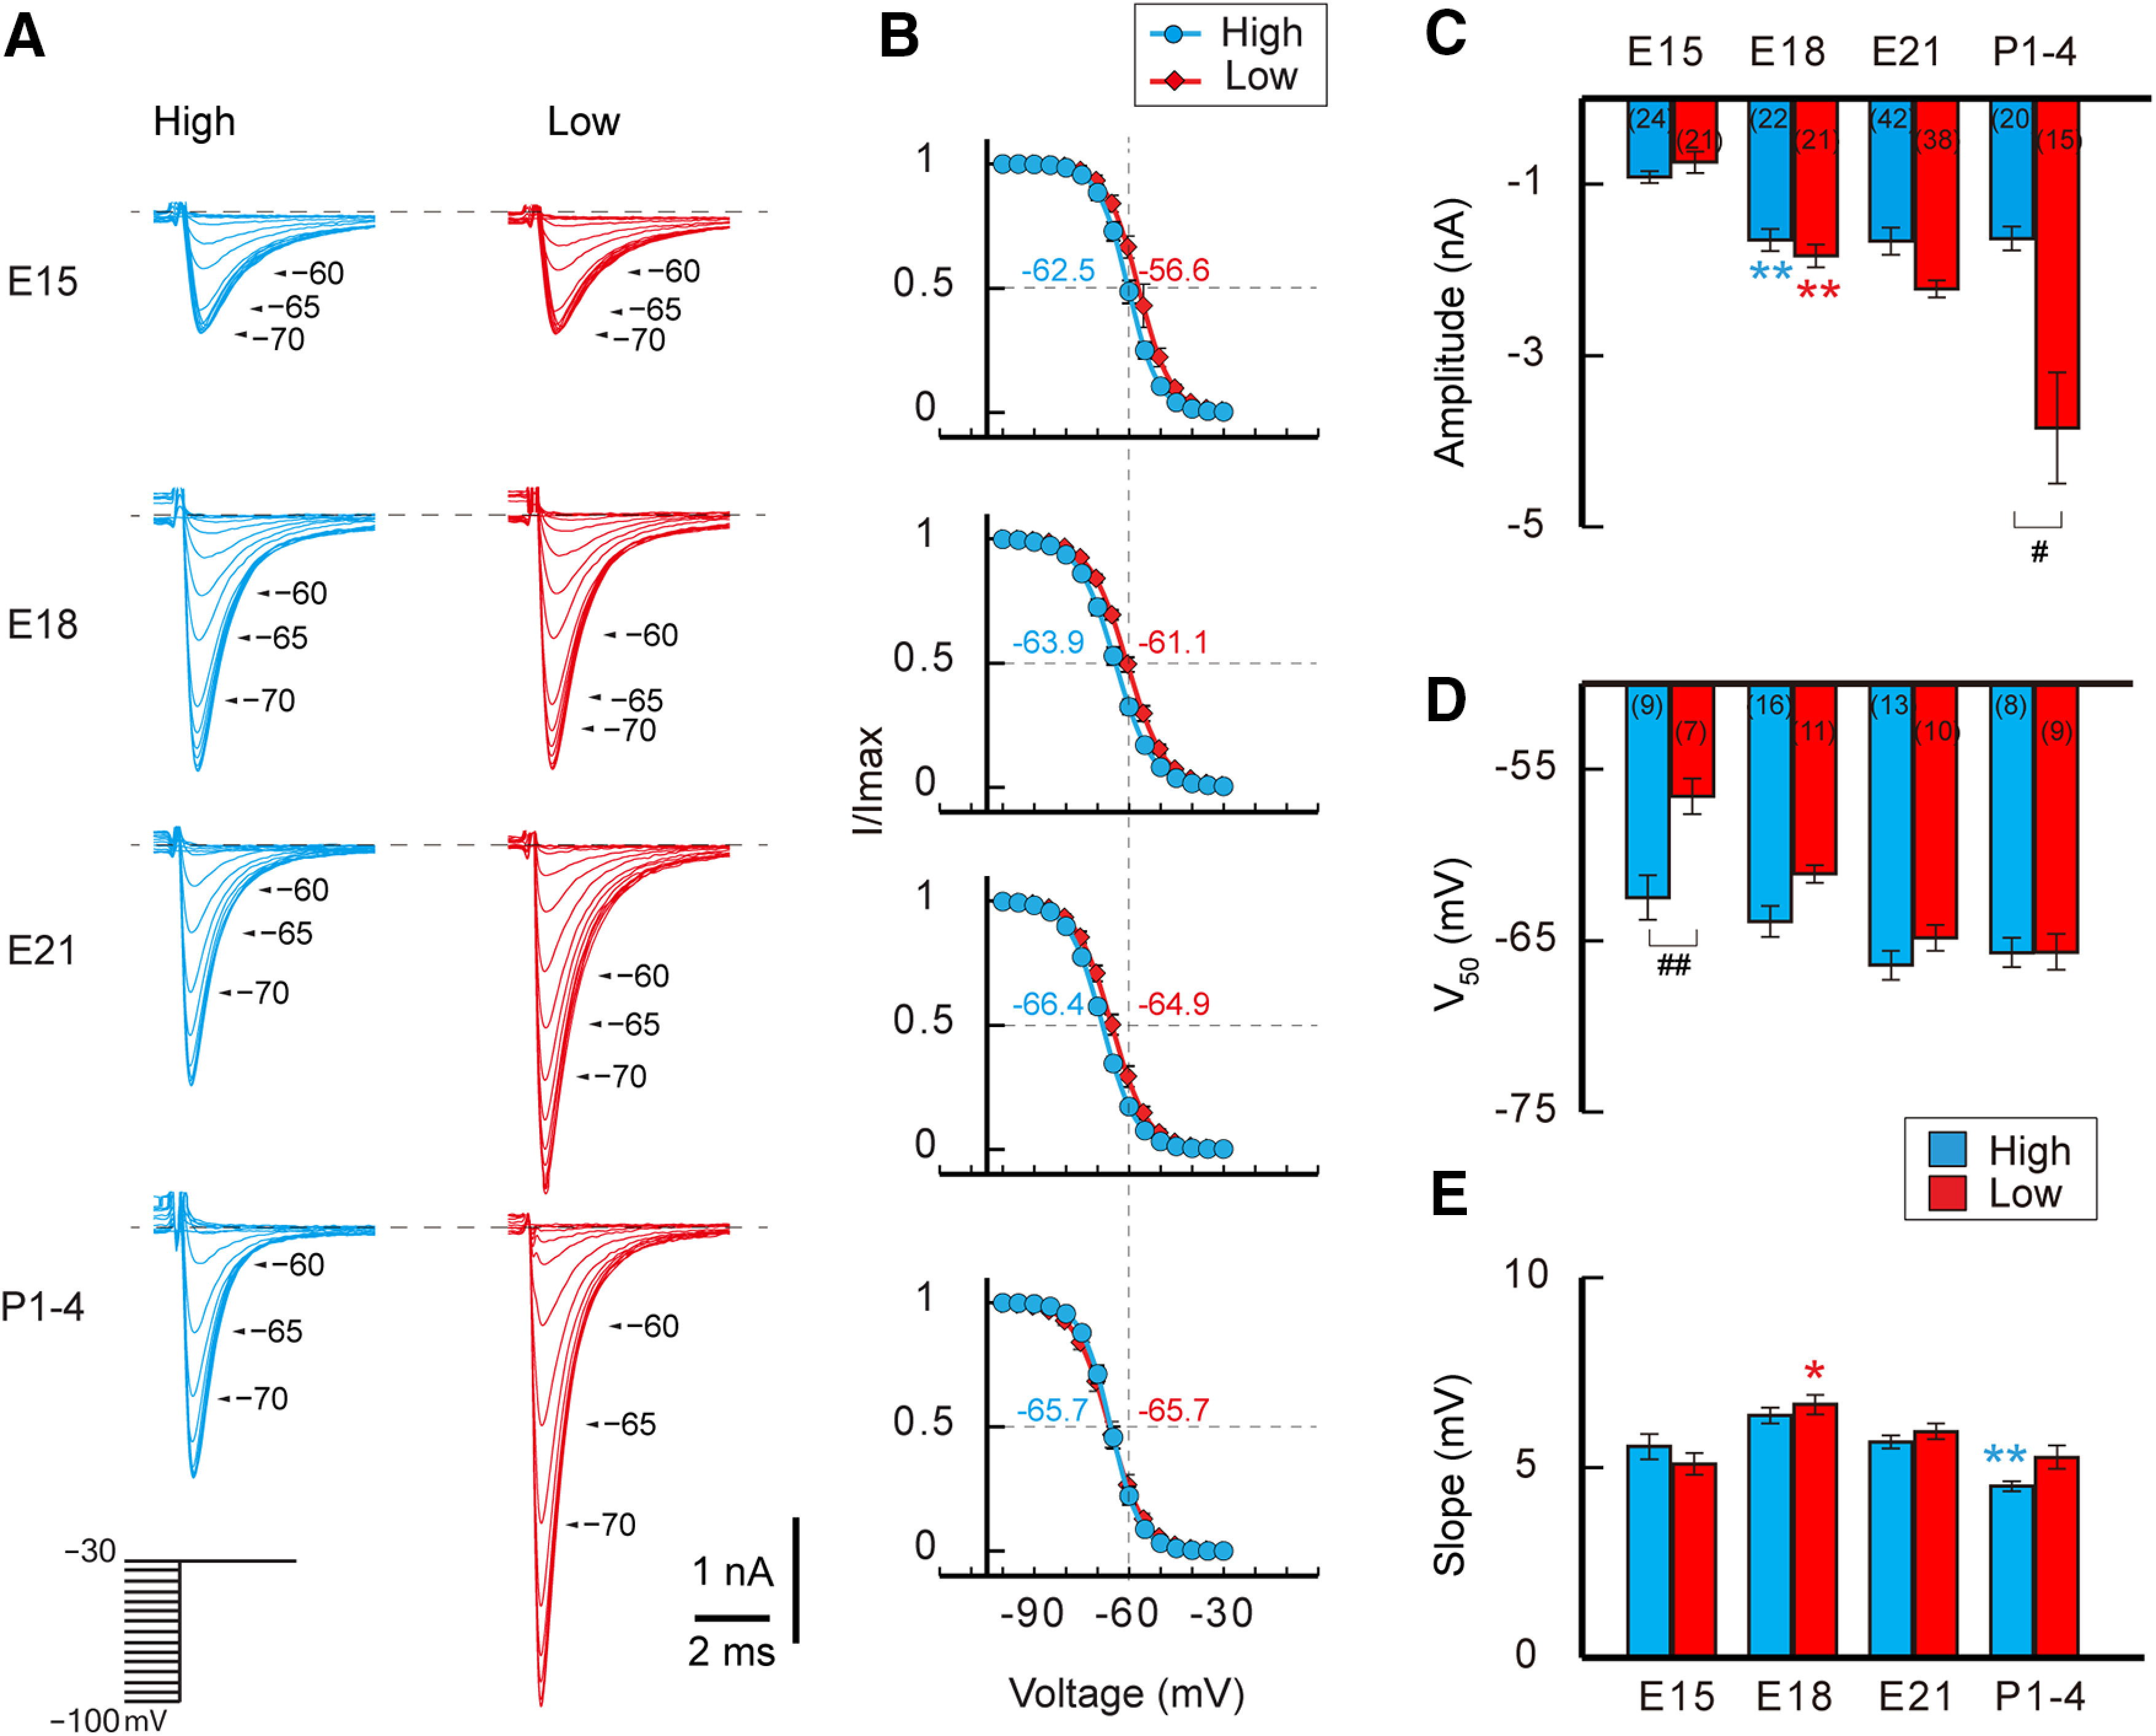
Development of sodium current. A, Whole-cell sodium currents at –30 mV with a 30 ms prepulse from –100 to –30 mV between E15 and P1–P4. High-CF (left, blue) and low-CF (right, red) neurons. B, Voltage dependence of sodium current inactivation. Values were fitted to a Boltzmann equation (see Materials and Methods) and V50 is specified near the curves. C–E, Amplitude (C), V50 (D), and slope factor (E) of sodium current. Note that the amplitude increased with maturation, and the extent was larger in low-CF neurons. The positive V50 at E15 might reflect the predominance of Nav1.2 at the age. p < 0.0001 among the groups in C and E by Kruskal–Wallis test, while F(3,75) = 17.866, p < 0.0001; F(1,75) = 15.162, p = 0.0002; F(3,75) = 3.196, p = 0.0282 were for age, tonotopy, and interaction, respectively, in D by two-way ANOVA. Numbers in parentheses are the number of cells. #p < 0.05, ##p < 0.01 between tonotopic regions, while *p < 0.05, **p < 0.01 were compared with the neighboring younger group by post hoc tests.
Developmental lowering of spike threshold was moderate in high-CF neurons
We examined spikes in NM neurons by injecting a rectangular current into the soma through a patch pipette under current clamp (Fig. 5). In both high-CF and low-CF neurons, a single spike or a few spikes were induced at the onset of current injection (Fig. 5A). However, the amplitude of spikes changed with age in a tonotopic region-dependent manner; it increased in low-CF neurons, but not in high-CF neurons (Fig. 5C). The maximum dV/dt of spikes showed similar differential changes during development with the increase being more extensive in low-CF neurons (Fig. 5D), suggesting that the greater increase of sodium current in the neurons underlies the differential changes in spike amplitude. In support of this idea, the threshold voltage of spikes decreased with age in both neurons, and the extent was larger in the low-CF neurons (Fig. 5E). It is important to note that there were some discrepancies between spike amplitude and sodium current, particularly in high-CF neurons. The spike amplitude remained constant between E15 and E18 despite the increase in sodium current, and it rather decreased after hatching despite the constant sodium current. These changes might be because of the prominent increase of shunting conductance during development (Fig. 5, legend; Akter et al., 2018) as well as the acceleration of inactivation kinetics of the sodium current (Fig. 4; Leão et al., 2005). Indeed, the half-amplitude width of spikes decreased between E15 and P3–P4, from 0.72 ± 0.04 ms (n = 24) to 0.29 ± 0.01 ms (n = 13) in high-CF neurons (p = 0.0002 by Steel-Dwass test) and from 1.23 ± 0.07 ms (n = 15) to 0.44 ± 0.02 ms (n = 9) in low-CF neurons (p = 0.0015 by Steel–Dwass test; p < 0.0001 by Kruskal–Wallis test).
Figure 5.
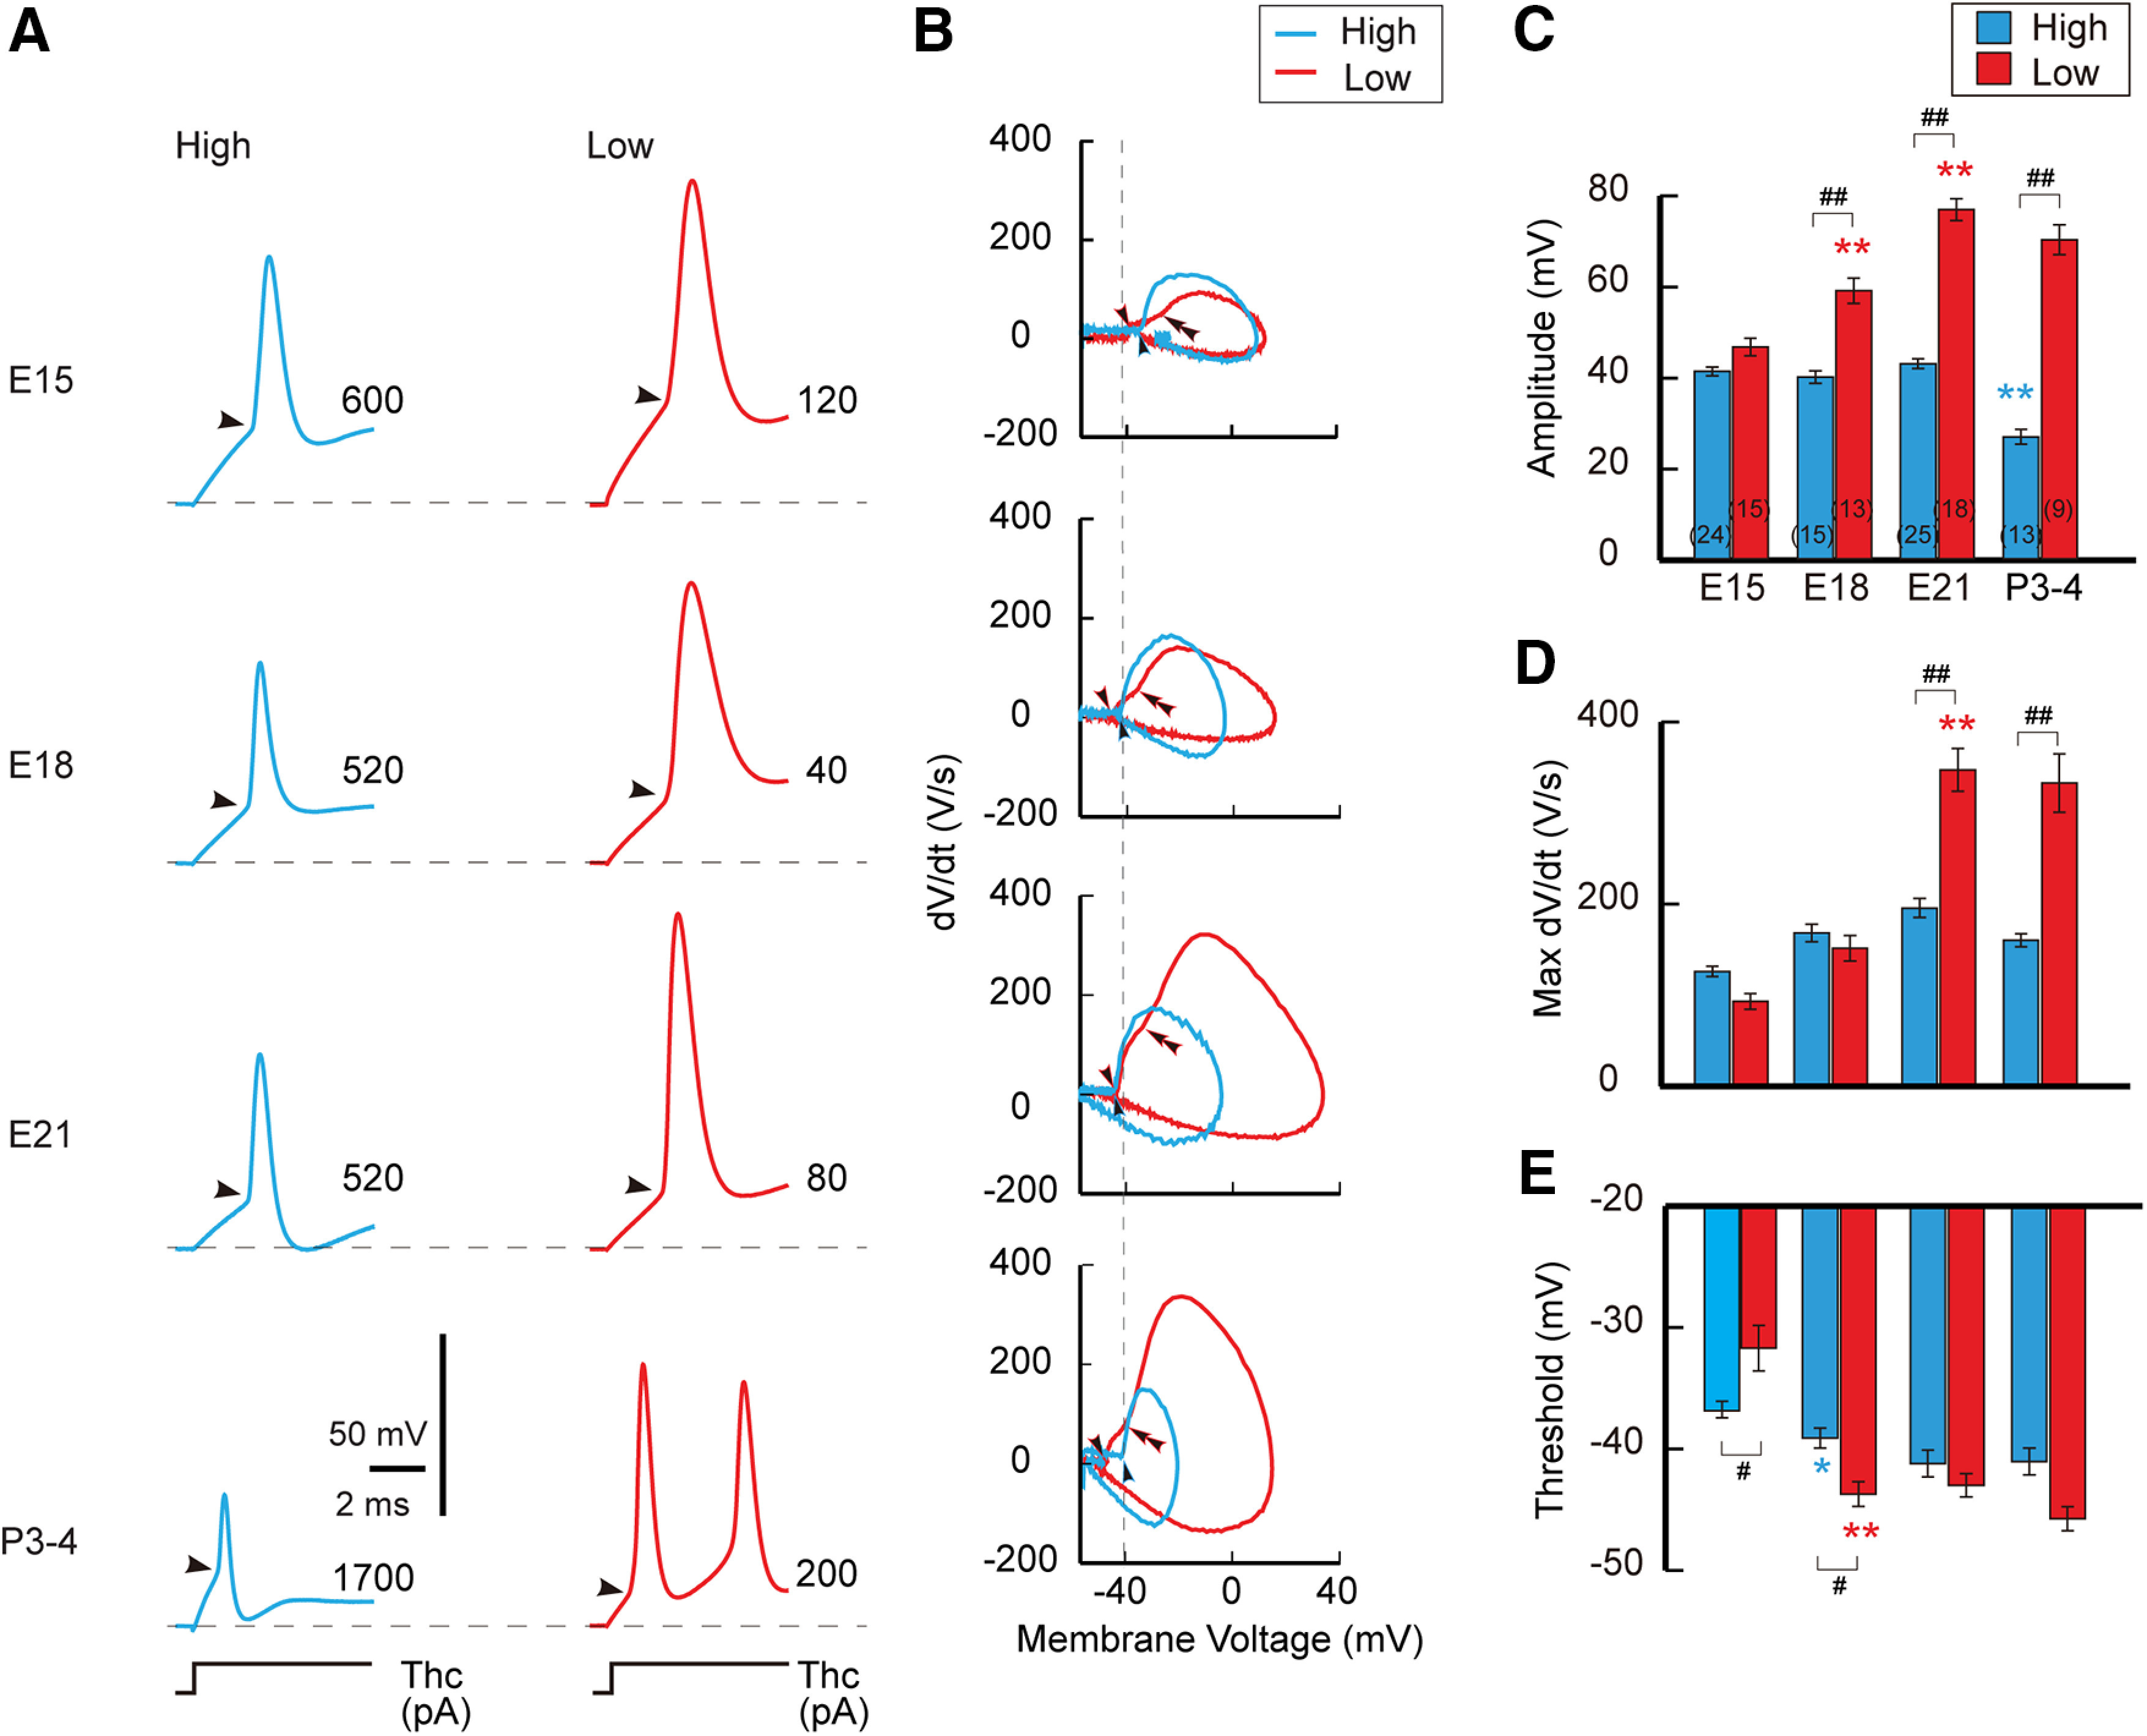
Development of membrane excitability. A, Spike responses to somatic current injection in high-CF (left, blue) and low-CF (right, red) neurons between E15 and P3–P4. Depolarizing current (70 ms) was increased with a 40 pA step in embryos and with a 100 pA step in posthatch, and a trace just above threshold current was shown. The membrane potential was held at –68 mV. Injected current is specified at the right in each panel. B, dV/dt and membrane potential relationship (phase plot) of action potential in A. Arrowheads and double arrowheads indicate thresholds for axonal and somatic components, respectively. Note the biphasic upstroke of action potential in low-CF neurons, presumably reflecting the large sodium conductance at the AIS. C–E, Amplitude (C), maximum dV/dt (D), and threshold (E) of spikes. The increase of max dV/dt and the decrease of threshold would reflect the increase of sodium current during development. On the other hand, the decrease of spike amplitude would be attributed in part to the decrease of input resistance via an increase of Kv1 current during the period, which is more prominent in high-CF neurons; it was 156, 87, 59, and 22 MΩ at E15, E18, E21, and P3–P5, respectively, for high-CF neurons, whereas it was 405, 159, 93, and 40 MΩ for low-CF neurons (Akter et al., 2018). Numbers in parentheses are the number of cells. F(3,138) = 22.152, p < 0.0001; F(1,138) = 313.384, p < 0.0001; F(3,138) = 38.402, p < 0.0001 for age, tonotopy, and interaction, respectively, in C; F(3,138) = 69.9, p < 0.0001; F(1,138) = 12.211, p = 0.0006; F(3,138) = 23.9, p < 0.0001 in D; F(3,123) = 27.886, p < 0.0001; F(1,123) = 1.074, p = 0.302; F(3,123) = 9.862, p < 0.0001 in E, by two-way ANOVA. #p < 0.05, ##p < 0.01 between tonotopic regions, while *p < 0.05, **p < 0.01 compared with the neighboring younger group by post hoc tests.
Interestingly, when dV/dt values of spikes were plotted against membrane potential (the spike phase plot), two rising components were apparent in low-CF neurons, and the onset of the first component became more negative after hatching (Fig. 5B). The first component is considered to arise from axonal axial current flowing to the soma during spikes at the AIS, whereas the second component occurs via subsequent sodium influx during spikes in the soma (Coombs et al., 1957). Thus, the negative shift of the first component suggests that the sodium current increased at the AIS in low-CF neurons during this period. In high-CF neurons, on the other hand, the phase plot showed only a single rising component. This might occur because the shunting conductance of the Kv1 current was too large (Akter et al., 2018), making it difficult to separate the two components in the neurons. Consistently, the first component became smaller even in low-CF neurons after hatching, presumably because of the increase in Kv1 current during this period.
Deprivation of activity reduced the AIS shortening specifically in high-CF neurons
The reorganization of the AIS progressed after E15, corresponding to the period around hearing onset. Since structural plasticity of the AIS occurs in mature NM neurons (Kuba et al., 2010), we asked whether the reorganization of the AIS depended on afferent input (Figs. 6, 7). We first deprived afferent input during the embryonic period by removing bilateral otocysts at E2, and examined the AIS at E21 (Fig. 6A). The location of the distal end of the AIS was still distributed more proximally in high-CF neurons than in low-CF neurons (Fig. 6B,C). However, the tonotopic difference of the AIS length became insignificant after otocyst removal, while the distance was slightly shorter in high-CF neurons (Fig. 6D,E). The signal intensity of AIS molecules remained higher in low-CF neurons compared with high-CF neurons, and the AIS was still positive to Nav1.6 but not to Nav1.2 in both neurons (Fig. 6F–K). These observations indicate that the shortening of the AIS depends, in part, on afferent input, whereas the accumulation of AIS molecules is independent of afferent input during embryonic period.
Figure 6.
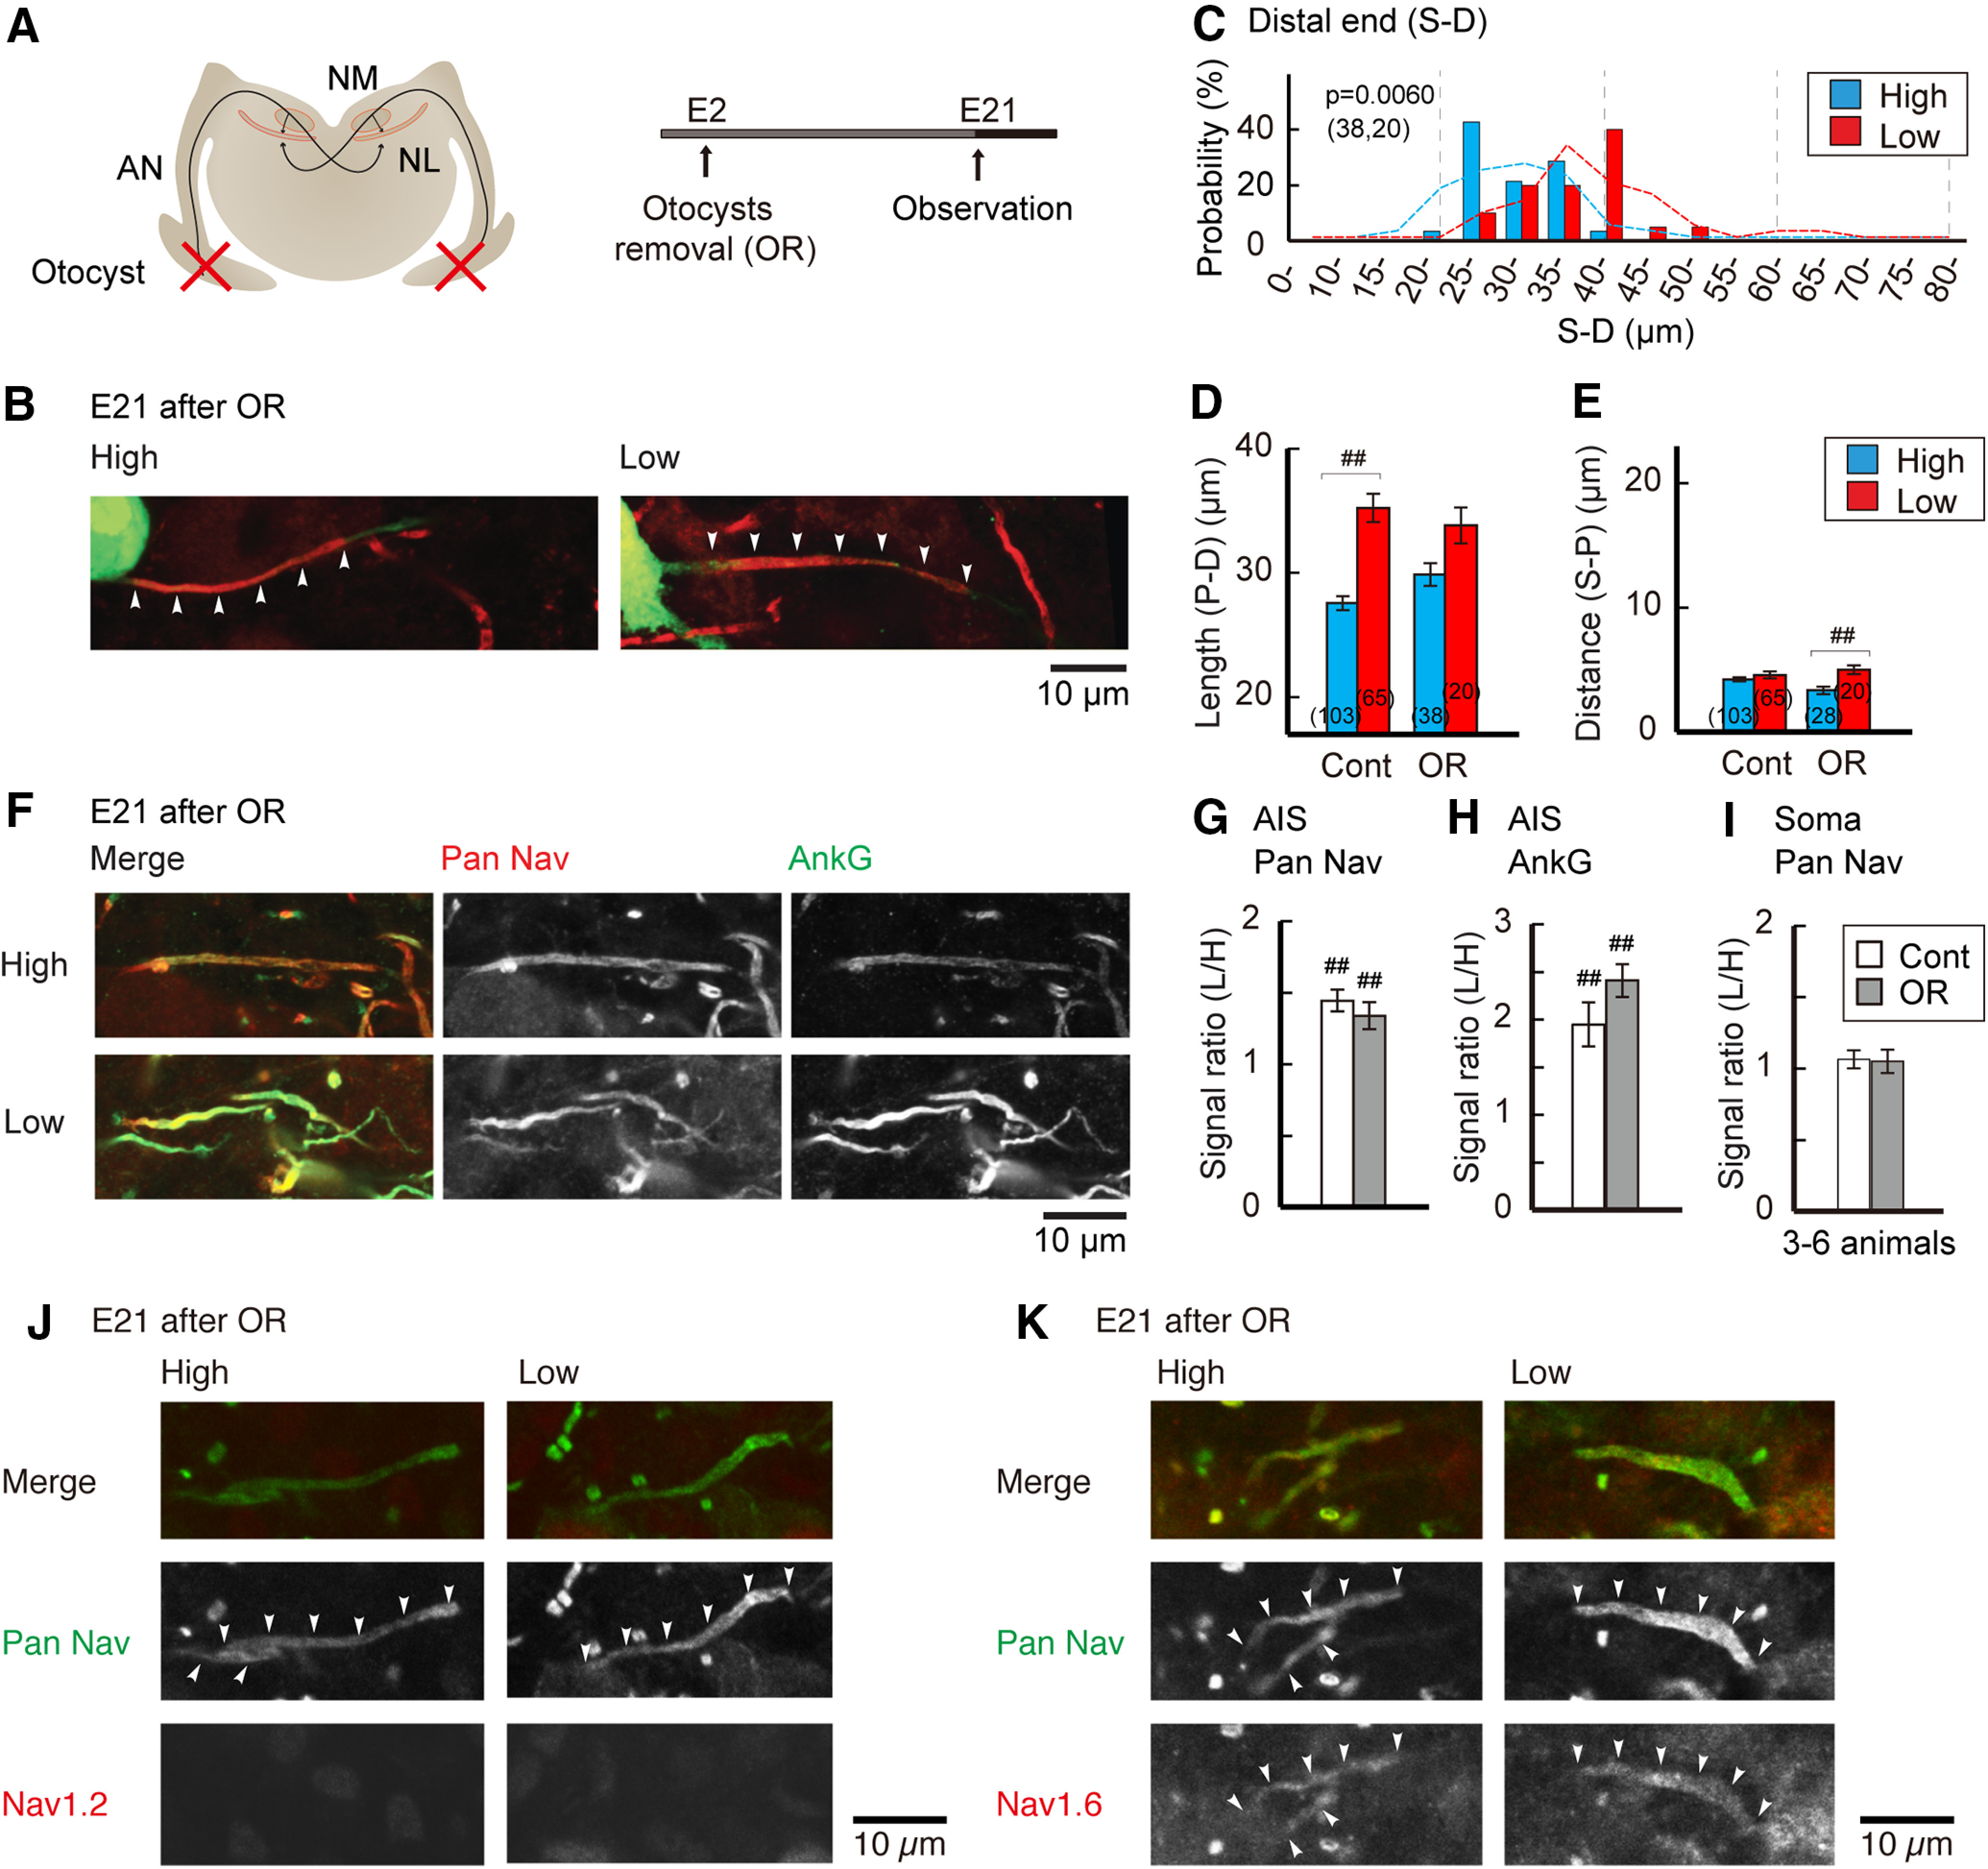
Effects of auditory deprivation during embryonic period. A, Auditory input was deprived by bilateral otocyst removal at E2. B, Distribution of the AIS at E21 in otocyst-deprived animals. C, Histogram of AIS distal end position relative to the soma (S–D). Broken lines indicate distributions of E21 control in Figure 1. D, E, Geometric parameters of the AIS; Length (P–D; D) and distance (S–P; E). Controls are E21 in Figure 1. Numbers in parentheses are the number of cells. F, Double immunostaining of pan-Nav (red) and ankyrinG (green) in high-CF (top) and low-CF (bottom) regions from the same animal. G–I, Signal intensity ratio of low-CF region to high-CF region. Pan-Nav (G) and ankyrinG (H) at the AIS, and pan-Nav (I) at the soma. Controls are E21 in Figure 3. Normalized signal intensity before calculating the ratio was used for statistical comparisons (Materials and Methods). J, K, Immunostaining of Nav1.2 (J) and Nav1.6 (K) in high-CF (left) and low-CF (right) regions. p < 0.0001 in D and p = 0.0128 in E among the groups by Kruskal–Wallis test. F(1,16) = 0.018, p = 0.8964; F(1,16) = 85.302, p < 0.0001; F(1,16) = 1.442, p = 0.2473 for treatment, tonotopy, and interaction, respectively, in G; F(1,12) = 0.523, p = 0.4834; F(1,12) = 211.564, p < 0.0001; F(1,12) = 4.704, p = 0.0509, in H; F(1,10) = 0.0003, p = 0.9875; F(1,10) = 2.487, p = 0.1459; F(1,10) = 0.06, p = 0.8108, in I, by two-way ANOVA. ##p < 0.01 between tonotopic regions by post hoc tests.
Figure 7.
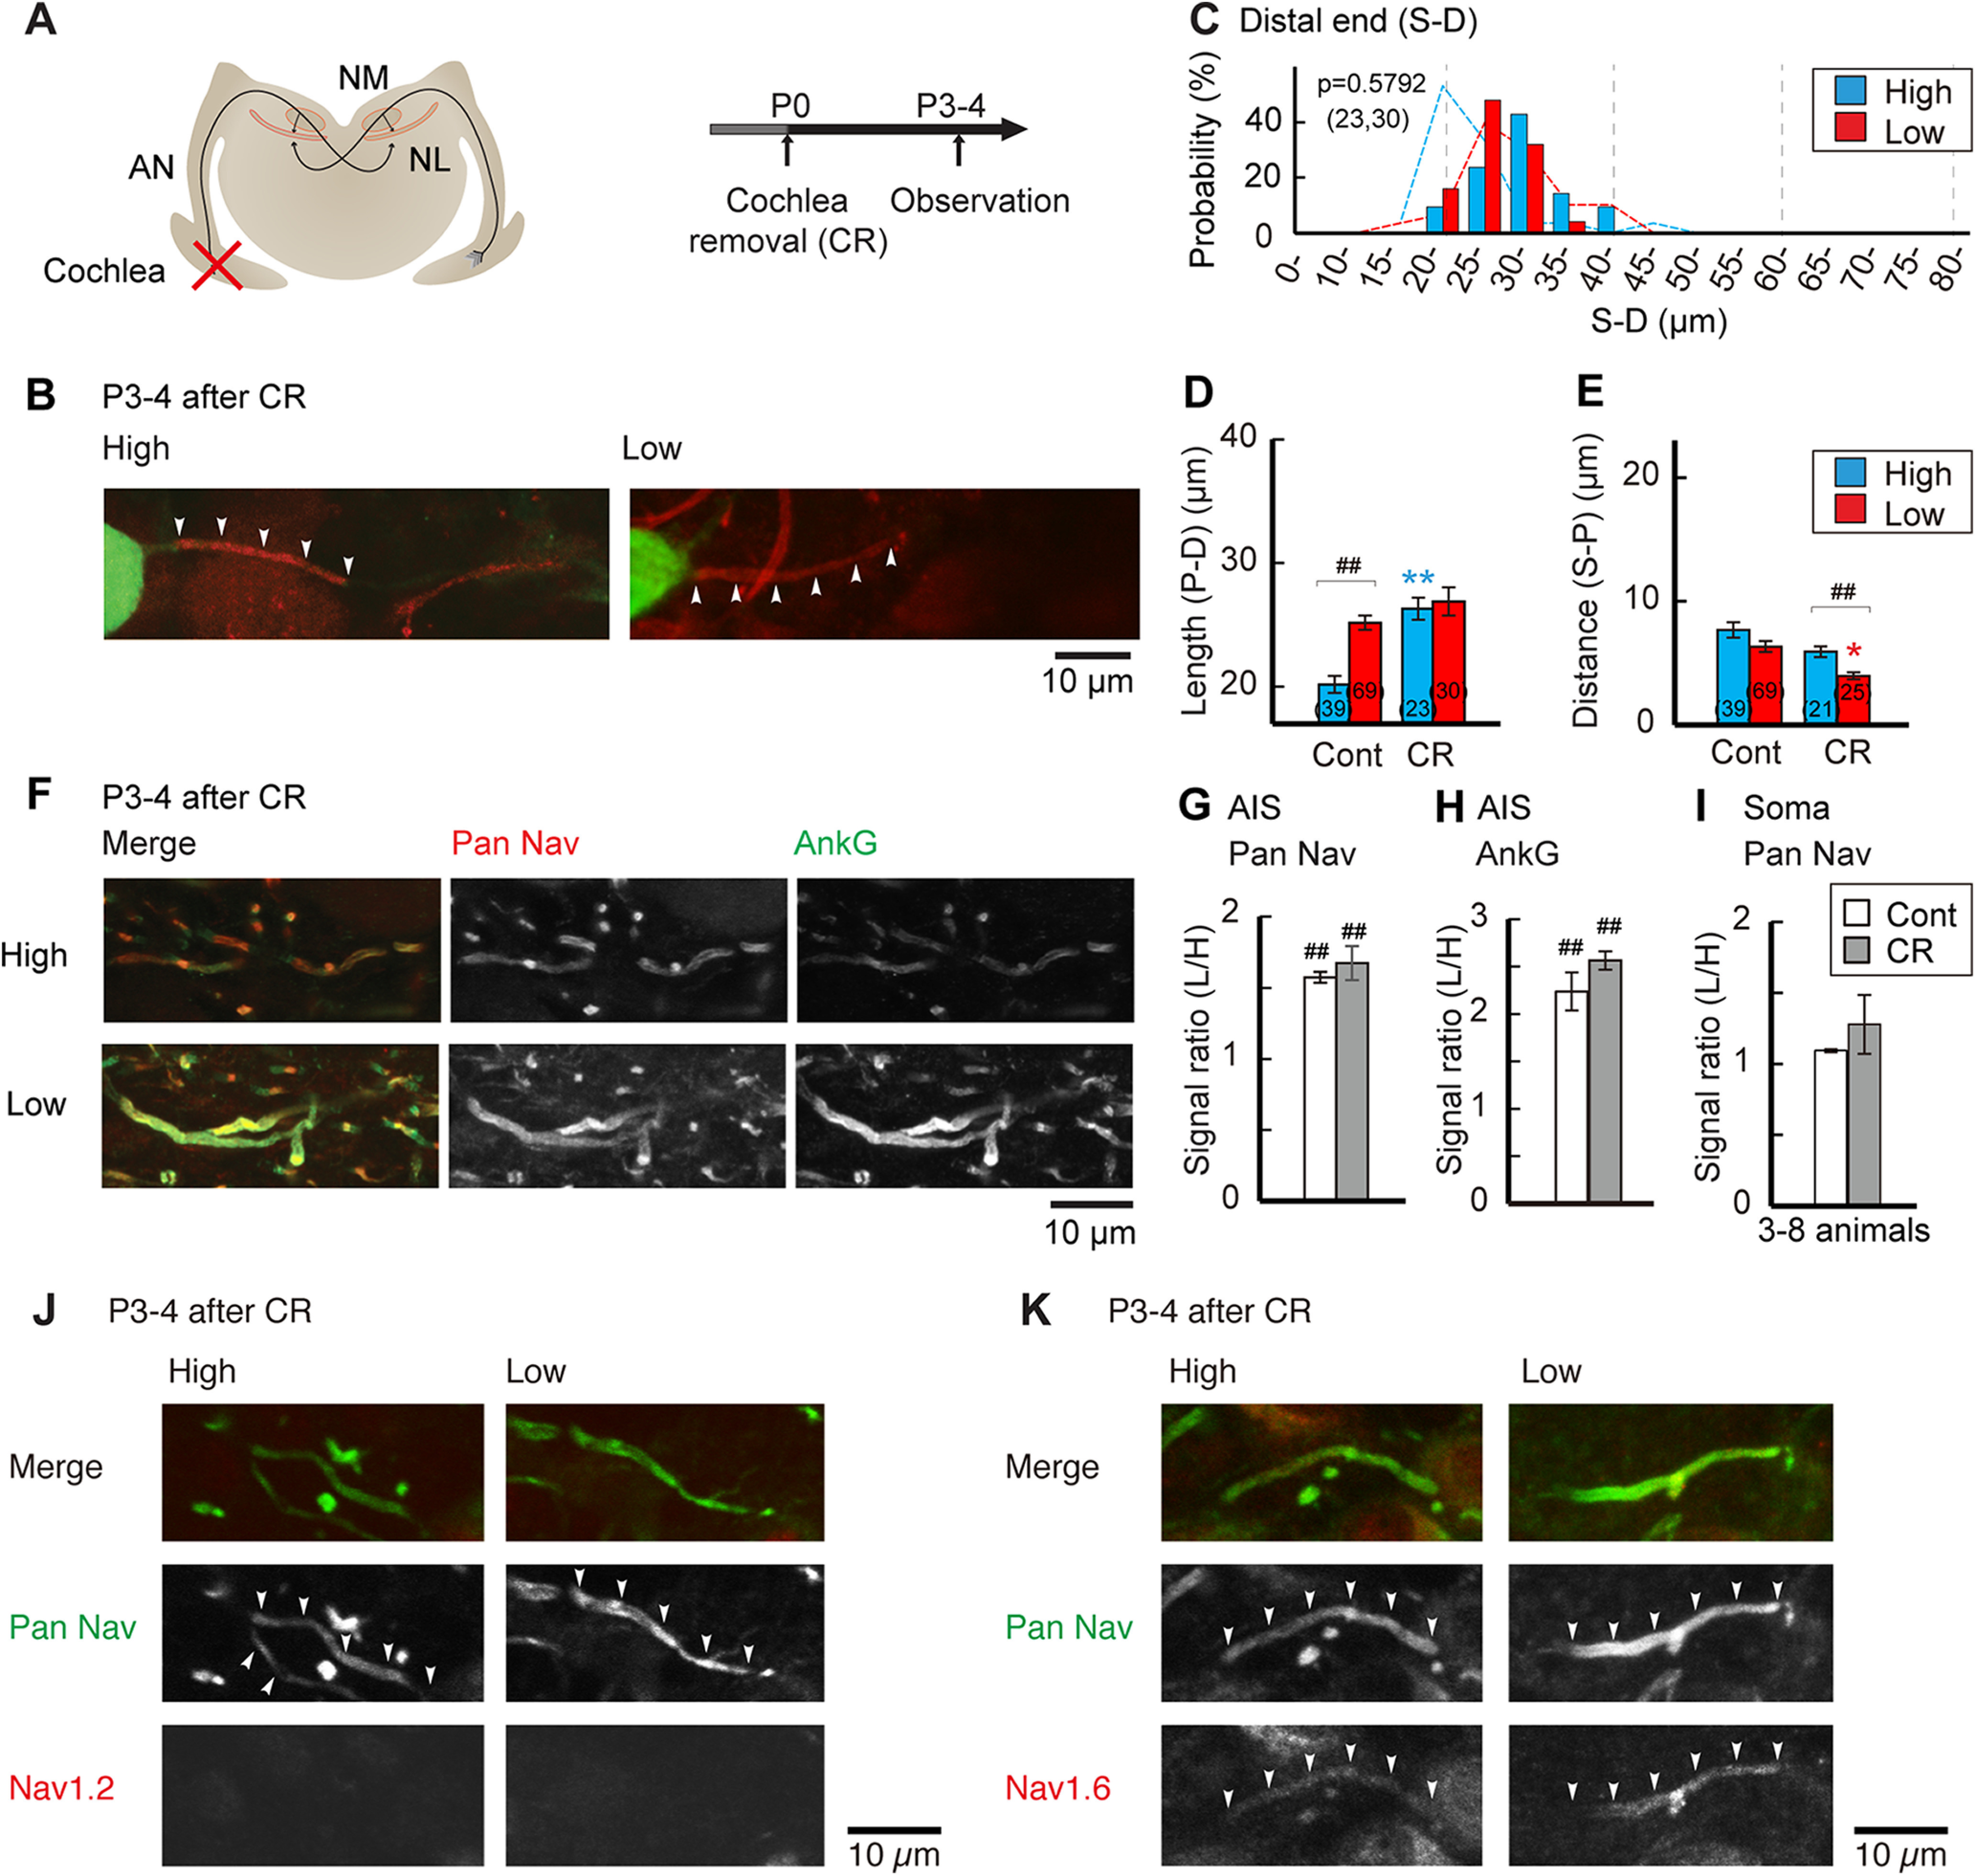
Effects of auditory deprivation during early posthatch period. A, Auditory input was deprived by cochlea removal at P0. B, Distribution of the AIS at P3–P4 in cochlea-removed animals. C, Histogram of AIS distal end position relative to the soma (S–D). Broken lines indicate distributions of P3–P4 control in Figure 1. D, E, Geometric parameters of the AIS; length (P–D; D) and distance (S–P; E). Controls are P3–P4 in Figure 1. Numbers in parentheses are the number of cells. F, Double immunostaining of pan-Nav (red) and ankyrinG (green) in high-CF (top) and low-CF (bottom) regions from the same animal. G–I, Signal intensity ratio of low-CF region to high-CF region. Pan-Nav (G) and ankyrinG (H) at the AIS, and pan-Nav (I) at the soma. Controls are P3–P4 in Figure 3. Normalized signal intensity before calculating the ratio was used for statistical comparisons (Materials and Methods). J, K, Immunostaining of Nav1.2 (J) and Nav1.6 (K) in high-CF (left) and low-CF (right) regions. p < 0.0001 among the groups in D and E by Kruskal–Wallis test. F(1,22) = 0.139, p = 0.7133; F(1,22) = 242.213, p < 0.0001; F(1,22) = 1.654, p = 0.2118 for treatment, tonotopy, and interaction, respectively, in G; F(1,12) = 0.484, p = 0.4998; F(1,12) = 336.287, p < 0.0001; F(1,12) = 3.282, p = 0.0951, in H; F(1,10) = 0.043, p = 0.8401; F(1,10) = 4.772, p = 0.0583; F(1,10) = 0.748, p = 0.4075, in I by two-way ANOVA. *p < 0.05, **p < 0.01 between control and deprived; ##p < 0.01 between tonotopic regions by post hoc tests.
We next deprived afferent input during the posthatch period by removing cochlea around hatching (E22/P0) and assessed the AIS characteristics at P3 (Fig. 7A). The removal of cochlea shifted the location of the distal end of the AIS away from the soma specifically in high-CF neurons, making it similar between high-CF and low-CF neurons (Fig. 7B,C), while the distance was slightly shorter in low-CF neurons (Fig. 7E). Accordingly, the tonotopic difference in the length of the AIS disappeared after cochlea removal (Fig. 7D), indicating that AIS shortening depends on afferent input after hatching. The immunofluorescence intensity of AIS molecules was still higher in low-CF neurons than in high-CF neurons, with little difference in the subtype of Nav channels (Fig. 7F–K). These results suggest that cochlea removal would have little, if any, effect on the accumulation of these molecules, which was similar to observations in mature animals (Kuba et al., 2010, 2015).
Discussion
Structural and functional maturation of the AIS in NM
The AIS in NM neurons undergoes the following structural reorganization during development (Fig. 8A,C): the distal end of the AIS moves closer to the soma after hearing onset, with a similar slight shift of the proximal end. Together, these changes shorten the AIS. The extent of this shortening is augmented in higher-CF neurons, causing the tonotopic difference in AIS length within the nucleus. Notably, deprivation of afferent input reduces AIS shortening specifically in the higher-CF neurons, and this eliminates the difference in AIS length in posthatch animals. Thus, the structural reorganization of the AIS depends on afferent input to a different degree in a tonotopic region-specific manner. Together, these changes shape the mature geometry of AIS in NM.
Figure 8.
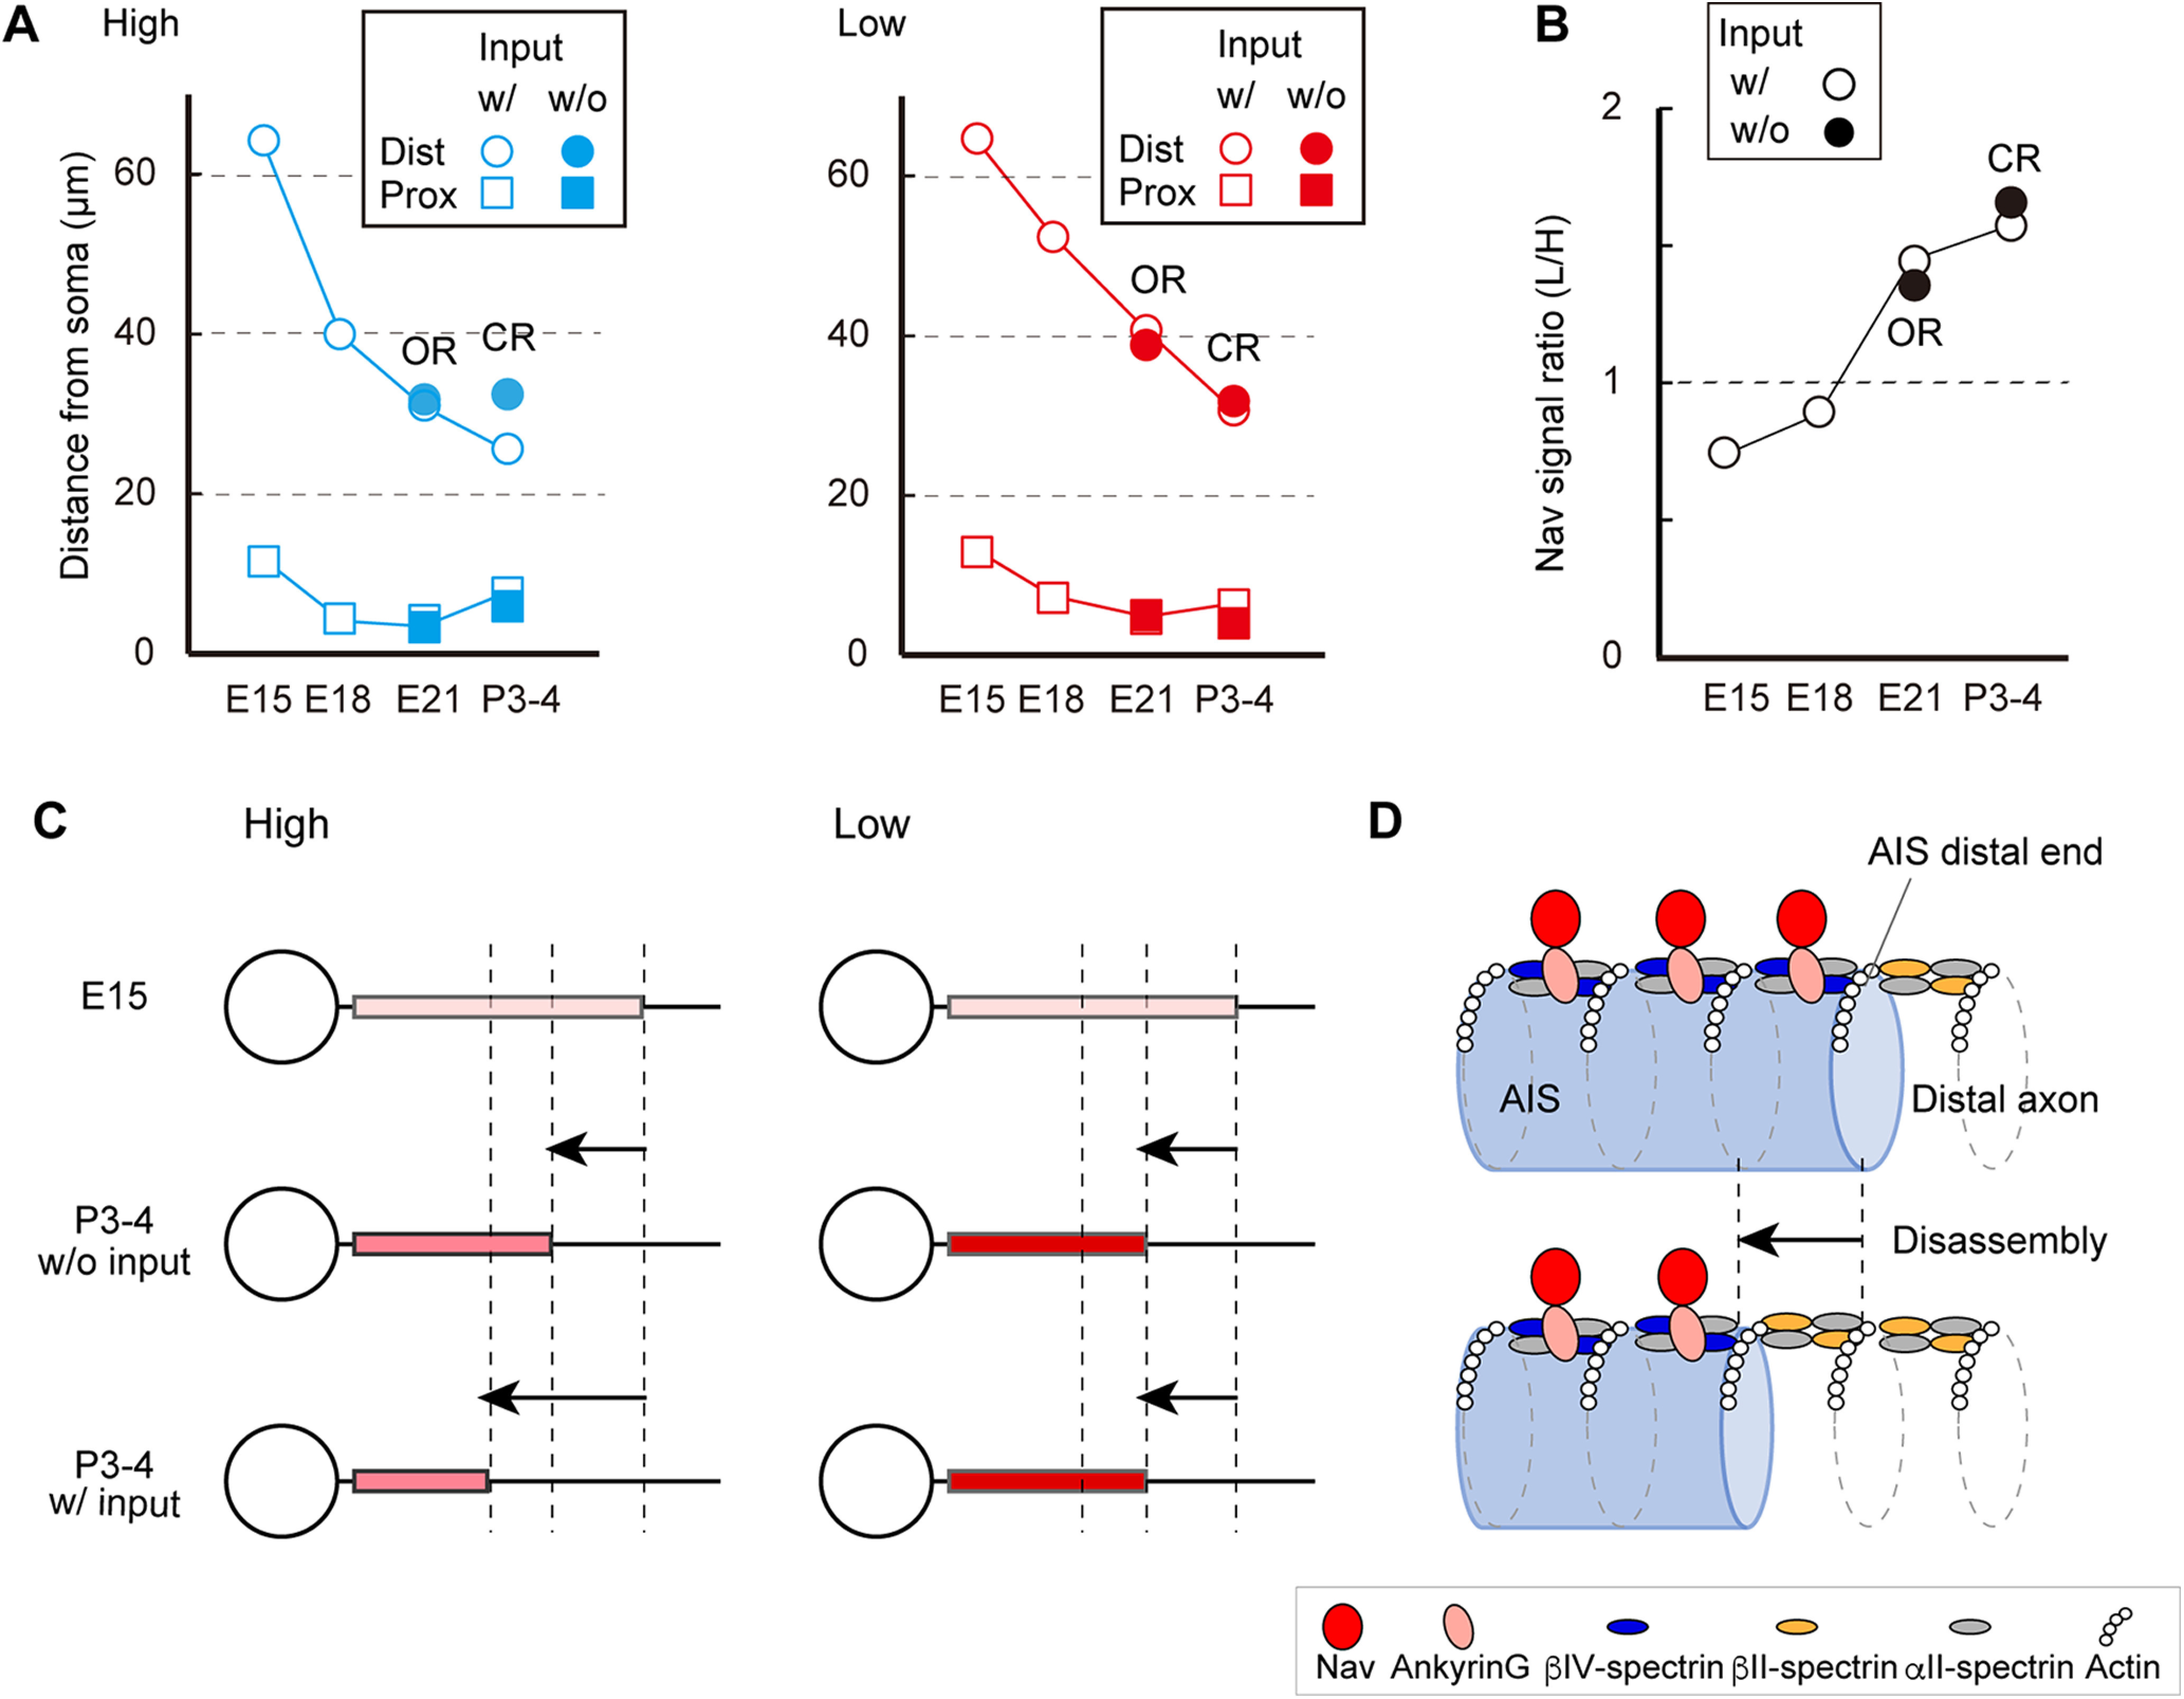
Developmental refinement of the AIS in NM. A, Position of distal and proximal ends of the AIS during development in high-CF (left) and low-CF (right) neurons. Values were from Figures 1, 6, and 7. Input-dependent change is shown as a difference between with and without auditory input deprivation. B, Ratio of pan-Nav signal intensity between low-CF and high-CF neurons. Values were from Figures 3, 6, and 7. C, Development of the AIS in high-CF (left) and low-CF (right) neurons. Lighter red indicates lower density of sodium channels at the AIS. Length of the AIS was shortened to a larger extent in high-CF neurons, which was driven in part by afferent input, whereas accumulation of Nav channels progressed to a larger extent in low-CF neurons, but it was independent of afferent input. D, Shortening of the AIS would occur via disassembly of the distal part of the AIS rather than changing the periodicity of submembranous structure (Discussion).
In addition to the structural reorganization, AIS Nav channel density increases during development (Fig. 8B,C). This lowers the spike threshold at both tonotopic regions (Figs. 4, 5). Moreover, the accumulation was regulated tonotopically and was less robust in higher-CF neurons. Combining these changes in Nav channel density with the reduction in AIS length makes the sodium current smaller in these neurons. These results suggest that the structural and functional reorganization of AIS work synergistically to adjust the neuronal output in each tonotopic region. The accumulation of Nav channels was not driven by afferent input, since the tonotopic difference in Nav channel immunofluorescence intensity remained unchanged after removing either otocysts or cochlea. Furthermore, the subtype of Nav channels switched from Nav1.2 to Nav1.6 during channel accumulation, as in other excitatory neurons (Boiko et al., 2003; Osorio et al., 2005; Kuba et al., 2014), and this occurred independently of afferent input (Figs. 6, 7).
Molecular basis of structural and functional maturation of the AIS
Super-resolution microscopy techniques have revealed that submembranous cytoskeletons of the axon show a periodic pattern: actin rings are arranged at an interval of ∼190 nm via an interaction with spectrin tetramers (Xu et al., 2013; Leterrier, 2018). The tetramers at the AIS consist of αII-spectrins and βIV-spectrins (Zhong et al., 2014; Huang et al., 2017), the latter of which binds to ankyrinG and enables the accumulation of Nav channels (Berghs et al., 2000), whereas those at the distal axon consist of αII-spectrins and βII-spectrins (Ogawa et al., 2006; Galiano et al., 2012). Importantly, these periodic nanostructures at the AIS were observed in most cases in dissociated neuron cultures, although the extracellular environment is distinct from that in vivo. In this study, we show that the periodic nanostructure was similarly observed at the AIS in tissues, confirming that the periodic arrangement is fundamental to the AIS in vivo. Interestingly, however, the periodic interval was ∼170 nm in this study, which was slightly shorter than that reported in dissociated cultures (∼190 nm) but close to that in retinal tissues (∼180 nm; Schlüter et al., 2019), raising the possibility that the periodic interval of actin rings is shorter in vivo than in vitro. This might be associated with a species difference of spectrin or with the fact that spectrin has spring-like flexibility and can change its length depending on the environment (Brown et al., 2015). More importantly, the present study revealed that the periodicity of the submembranous nanostructure did not change during the structural reorganization of the AIS, suggesting that the shortening could be mediated by disassembly of the AIS at its distal end rather than a dynamic alteration of the periodic interval itself (Fig. 8D). This is consistent with a report that the developmental switch in βIV-spectrin isoforms does not affect the periodicity of the AIS cytoskeleton (Yoshimura et al., 2017).
What mechanism could disassemble cytoskeletons specifically at the distal end of the AIS? Given that ankyrinG is the master organizer to accumulate βIV-spectrin at the AIS (Rasband, 2010), and that maintenance of ankyrinG at the AIS requires interaction with neurofascin186 and/or microtubules (Leterrier et al., 2011; Zonta et al., 2011; Fréal et al., 2016, 2019), the mechanism may reflect regulated interactions between ankyrinG and other AIS proteins. Alternatively, it could be regulated by the splicing of ankyrinG that affects its affinity for βIV-spectrin (Jacko et al., 2018). It is known that distribution of the AIS correlates with the size of dendritic trees (Gulledge and Bravo, 2016; Hamada et al., 2016). Since dendrites of NM neurons are pruned to a different extent according to tonotopic region during development (Jhaveri and Morest, 1982; Akter et al., 2018), another important question would be whether and how molecules related to this dendritic pruning affect the AIS.
The accumulation of Nav channels at the AIS increased during development, and this occurred in parallel with the accumulation of ankyrinG (Figs. 3–5). In addition, these molecules are transported to the AIS as a complex by anterograde trafficking via KIF5B (Barry et al., 2014), while each spectrin tetramer has at least two binding sites for ankyrinG (Leterrier, 2018), which enables additional insertion of ankyrinG into the submembranous structure. Thus, we speculate that the accumulation of Nav channels primarily reflects an increase in ankyrinG at the AIS, which might occur via increased production, trafficking, and/or reduced endocytosis. Alternatively, the accumulation of Nav channels could occur through regulating their interaction with ankyrinG via phosphorylation by CK2 (Bréchet et al., 2008; Hien et al., 2014), GSK3β (Tapia et al., 2013), or CaMKII (Hund et al., 2010).
Activity dependence of AIS reorganization is determined in a cell-specific manner
The shortening of the AIS depends on afferent input as well as tonotopic region, whereas the accumulation of Nav channels was solely dependent on tonotopic region, suggesting that they are driven by different mechanisms. Importantly, the afferent input-dependent shortening of the AIS occurred specifically in higher-CF neurons, which was essential to differentiate AIS length among tonotopic regions in mature animals. However, the level of afferent input may not account for this difference of AIS shortening, because the threshold of auditory evoked responses decreases after hearing onset, but it remains high for higher-frequency sound (Saunders et al., 1973; Jones et al., 2006). This suggests that the intrinsic properties of neurons, rather than the level of input, are responsible for the difference in AIS shortening. A similar tonotopic variation in the efficiency of activity dependence was observed in the expression of Kv1.1: higher efficiency in higher-CF neurons augmented the expression and contributed to shape the tonotopic gradient of Kv1.1 channels (Akter et al., 2018; Adachi et al., 2019).
Functional implications of afferent input-dependent AIS reorganization
Membrane excitability of NM neurons increases during development via accumulation of Nav channels at the AIS, whereas afferent input further optimizes excitability by adjusting AIS length and hence overall sodium conductance at each tonotopic region. In low-CF neurons, synaptic input from bouton terminals is small and the convergence of multiple inputs is required to exceed spike threshold. This slows the rise of the synaptic potential, which causes sodium current inactivation and potassium current activation. Therefore, a large sodium conductance is important for the neurons to maintain their excitability during this convergence (Kuba and Ohmori, 2009), which may further increase the reliability and precision of output during ongoing stimuli (Madeja, 2000; Kim et al., 2013). On the other hand, in higher-CF neurons, synaptic input from an end-bulb terminal is large enough to trigger a spike. Therefore, the small sodium conductance may suppress aberrant spike generation and improve the fidelity of output. Given that the large input causes robust sodium entry, the small sodium conductance is also beneficial from a metabolic viewpoint; it prevents excess sodium entry during spikes and saves the energy consumed by Na+/K+-ATPase that is required to maintain ion gradients. Thus, afferent input-dependent shortening of the AIS fine-tunes membrane excitability as well as metabolic cost, thereby ensuring temporal coding of NM neurons across frequencies. Since Na+/K+-ATPase binds to ankyrinG (Kordeli et al., 1995) and is accumulated in the axon of auditory neurons (Kim et al., 2007), it is important to ask in the future how Na+/K+-ATPase is distributed at the AIS and how the AIS shortening affects the distribution.
Similar afferent input-dependent cytoskeletal reorganization of the AIS is reported in other auditory and sensory neurons during development, such as retinal ganglion cells (Schlüter et al., 2019), pyramidal neurons in visual cortex (Gutzmann et al., 2014), neurons in medial nucleus of trapezoid body (Kim et al., 2019) of mice, and neurons in nucleus laminaris of chickens (Kuba et al., 2014). Thus, the cytoskeletal reorganization of the AIS may be a universal mechanism for sensory systems to adjust the output of neurons according to environment. Finally, our study suggests that cytoskeletal reorganization and ion channel enrichment are differentially regulated during neuronal maturation; this difference coordinates membrane excitability and neuronal output to facilitate a functioning neural circuit.
Footnotes
This work was supported by Japan Society for the Promotion of Science KAKENHI Grants 18H02541 and 19H04747 (to H. Kuba) and 15K21769 and 20K07334 (to H. Kawabe); by the Ohsumi Frontier Science Foundation (to H. Kawabe); by the Takeda Science Foundation (to H. Kuba); and by The Uehara Memorial Foundation (to H. Kawabe). We thank Dr. M.N. Rasband for editing the manuscript.
The authors declare no competing financial interests.
References
- Adachi R, Yamada R, Kuba H (2019) Tonotopic differentiation of coupling between Ca2+ and Kv1.1 expression in brainstem auditory circuit. iScience 13:199–213. 10.1016/j.isci.2019.02.022 [DOI] [PMC free article] [PubMed] [Google Scholar]
- Akter N, Adachi R, Kato A, Fukaya R, Kuba H (2018) Auditory input shapes tonotopic differentiation of Kv1.1 expression in avian cochlear nucleus during late development. J Neurosci 38:2967–2980. 10.1523/JNEUROSCI.2472-17.2018 [DOI] [PMC free article] [PubMed] [Google Scholar]
- Al-Yaari M, Yamada R, Kuba H (2020) Excitatory–inhibitory synaptic coupling in avian nucleus magnocellularis. J Neurosci 40:619–631. 10.1523/JNEUROSCI.1124-19.2019 [DOI] [PMC free article] [PubMed] [Google Scholar]
- Barry J, Gu Y, Jukkola P, O'Neill B, Gu H, Mohler PJ, Rajamani KT, Gu C (2014) Ankyrin-G directly binds to kinesin-1 to transport voltage-gated Na+ channels into axons. Dev Cell 28:117–131. 10.1016/j.devcel.2013.11.023 [DOI] [PMC free article] [PubMed] [Google Scholar]
- Berghs S, Aggujaro D, Dirkx R Jr, Maksimova E, Stabach P, Hermel JM, Zhang JP, Philbrick W, Slepnev V, Ort T, Solimena M (2000) βIV spectrin, a new spectrin localized at axon initial segments and nodes of Ranvier in the central and peripheral nervous system. J Cell Biol 151:985–1001. 10.1083/jcb.151.5.985 [DOI] [PMC free article] [PubMed] [Google Scholar]
- Boiko T, Van Wart A, Caldwell JH, Levinson R, Trimmer JS, Matthews G (2003) Functional specialization of the axon initial segment by isoform-specific sodium channel targeting. J Neurosci 23:2306–2313. 10.1523/JNEUROSCI.23-06-02306.2003 [DOI] [PMC free article] [PubMed] [Google Scholar]
- Bouzidi M, Tricaud N, Giraud P, Kordeli E, Caillol G, Deleuze C, Couraud F, Alcaraz G (2002) Interaction of the Nav1.2a subunit of the voltage-dependent sodium channel with nodal ankyrinG. In vitro mapping of the interacting domains and association in synaptosomes. J Biol Chem 277:28996–29004. 10.1074/jbc.M201760200 [DOI] [PubMed] [Google Scholar]
- Bréchet A, Fache MP, Brachet A, Ferracci G, Baude A, Irondelle M, Pereira S, Leterrier C, Dargent B (2008) Protein kinase CK2 contributes to the organization of sodium channels in axonal membranes by regulating their interactions with ankyrin G. J Cell Biol 183:1101–1114. 10.1083/jcb.200805169 [DOI] [PMC free article] [PubMed] [Google Scholar]
- Brown JW, Bullitt E, Sriswasdi S, Harper S, Speicher DW, McKnight CJ (2015) The physiological molecular shape of spectrin: a compact supercoil resembling a Chinese finger trap. PLoS Comput Biol 11:e1004302. 10.1371/journal.pcbi.1004302 [DOI] [PMC free article] [PubMed] [Google Scholar]
- Coombs JS, Curtis DR, Eccles JC (1957) The generation of impulses in motoneurones. J Physiol 139:232–249. 10.1113/jphysiol.1957.sp005888 [DOI] [PMC free article] [PubMed] [Google Scholar]
- Fréal A, Fassier C, Le Bras B, Bullier E, De Gois S, Hazan J, Hoogenraad CC, Couraud F (2016) Cooperative interactions between 480 kDa ankyrin-G and EB proteins assemble the axon initial segment. J Neurosci 36:4421–4433. 10.1523/JNEUROSCI.3219-15.2016 [DOI] [PMC free article] [PubMed] [Google Scholar]
- Fréal A, Rai D, Tas RP, Pan X, Katrukha EA, van de Willige D, Stucchi R, Aher A, Yang C, Altelaar AFM, Vocking K, Post JA, Harterink M, Kapitein LC, Akhmanova A, Hoogenraad CC (2019) Feedback-driven assembly of the axon initial segment. Neuron 104:305–321. 10.1016/j.neuron.2019.07.029 [DOI] [PMC free article] [PubMed] [Google Scholar]
- Fukui I, Ohmori H (2004) Tonotopic gradients of membrane and synaptic properties for neurons of the chicken nucleus magnocellularis. J Neurosci 24:7514–7523. 10.1523/JNEUROSCI.0566-04.2004 [DOI] [PMC free article] [PubMed] [Google Scholar]
- Galiano MR, Jha S, Ho TS, Zhang C, Ogawa Y, Chang KJ, Stankewich MC, Mohler PJ, Rasband MN (2012) A distal axonal cytoskeleton forms an intra-axonal boundary that controls axon initial segment assembly. Cell 149:1125–1139. 10.1016/j.cell.2012.03.039 [DOI] [PMC free article] [PubMed] [Google Scholar]
- Grubb MS, Shu Y, Kuba H, Rasband MN, Wimmer VC, Bender KJ (2011) Short- and long-term plasticity at the axon initial segment. J Neurosci 31:16049–16055. 10.1523/JNEUROSCI.4064-11.2011 [DOI] [PMC free article] [PubMed] [Google Scholar]
- Gulledge AT, Bravo JJ (2016) Neuron morphology influences axon initial segment plasticity. eNeuro 3:ENEURO.0085-15.2016 10.1523/ENEURO.0085-15.2016 [DOI] [PMC free article] [PubMed] [Google Scholar]
- Gutzmann A, Ergül N, Grossmann R, Schultz C, Wahle P, Engelhardt M (2014) A period of structural plasticity at the axon initial segment in developing visual cortex. Front Neuroanat 8:11. 10.3389/fnana.2014.00011 [DOI] [PMC free article] [PubMed] [Google Scholar]
- Hamada MS, Goethals S, de Vries SI, Brette R, Kole MH (2016) Covariation of axon initial segment location and dendritic tree normalizes the somatic action potential. Proc Natl Acad Sci U S A 113:14841–14846. 10.1073/pnas.1607548113 [DOI] [PMC free article] [PubMed] [Google Scholar]
- Hamburger V, Hamilton HL (1951) A series of normal stages in the development of the chick embryo. J Morphol 88:49–92. [PubMed] [Google Scholar]
- Hien YE, Montersino A, Castets F, Leterrier C, Filhol O, Vacher H, Dargent B (2014) CK2 accumulation at the axon initial segment depends on sodium channel Nav1. FEBS Lett 588:3403–3408. 10.1016/j.febslet.2014.07.032 [DOI] [PubMed] [Google Scholar]
- Hong H, Rollman L, Feinstein B, Sanchez JT (2016) Developmental profile of ion channel specializations in the avian nucleus magnocellularis. Front Cell Neurosci 10:80. [DOI] [PMC free article] [PubMed] [Google Scholar]
- Huang CY, Zhang C, Ho TS, Oses-Prieto J, Burlingame AL, Lalonde J, Noebels JL, Leterrier C, Rasband MN (2017) αII spectrin forms a periodic cytoskeleton at the axon initial segment and is required for nervous system function. J Neurosci 37:11311–11322. 10.1523/JNEUROSCI.2112-17.2017 [DOI] [PMC free article] [PubMed] [Google Scholar]
- Hund TJ, Koval OM, Li J, Wright PJ, Qian L, Snyder JS, Gudmundsson H, Kline CF, Davidson NP, Cardona N, Rasband MN, Anderson ME, Mohler PJ (2010) A βIV-spectrin/CaMKII signaling complex is essential for membrane excitability in mice. J Clin Invest 120:3508–3519. 10.1172/JCI43621 [DOI] [PMC free article] [PubMed] [Google Scholar]
- Jacko M, Weyn-Vanhentenryck SM, Smerdon JW, Yan R, Feng H, Williams DJ, Pai J, Xu K, Wichterle H, Zhang C (2018) Rbfox splicing factors promote neuronal maturation and axon initial segment assembly. Neuron 97:853–868. 10.1016/j.neuron.2018.01.020 [DOI] [PMC free article] [PubMed] [Google Scholar]
- Jamann N, Jordan M, Engelhardt M (2018) Activity-dependent axonal plasticity in sensory systems. Neuroscience 368:268–282. 10.1016/j.neuroscience.2017.07.035 [DOI] [PubMed] [Google Scholar]
- Jhaveri S, Morest DK (1982) Sequential alterations of neuronal architecture in nucleus magnocellularis of the developing chicken: a Golgi study. Neuroscience 7:837–853. 10.1016/0306-4522(82)90046-x [DOI] [PubMed] [Google Scholar]
- Jones TA, Jones SM, Paggett KC (2006) Emergence of hearing in the chicken embryo. J Neurophysiol 96:128–141. 10.1152/jn.00599.2005 [DOI] [PubMed] [Google Scholar]
- Kim JH, Sizov I, Dobretsov M, von Gersdorff H (2007) Presynaptic Ca2+ buffers control the strength of a fast post-tetanic hyperpolarization mediated by the α3 Na+/K+-ATPase. Nat Neurosci 10:196–205. 10.1038/nn1839 [DOI] [PubMed] [Google Scholar]
- Kim JH, Renden R, von Gersdorff H (2013) Dysmyelination of auditory afferent axons increases the jitter of action potential timing during high-frequency firing. J Neurosci 33:9402–9407. 10.1523/JNEUROSCI.3389-12.2013 [DOI] [PMC free article] [PubMed] [Google Scholar]
- Kim EJ, Feng C, Santamaria F, Kim JH (2019) Impact of auditory experience on the structural plasticity of the AIS in the mouse brainstem throughout the lifespan. Front Cell Neurosci 13:456. 10.3389/fncel.2019.00456 [DOI] [PMC free article] [PubMed] [Google Scholar]
- Kole MH, Stuart GJ (2012) Signal processing in the axon initial segment. Neuron 73:235–247. 10.1016/j.neuron.2012.01.007 [DOI] [PubMed] [Google Scholar]
- Kordeli E, Lambert S, Bennett V (1995) AnkyrinG. A new ankyrin gene with neural-specific isoforms localized at the axonal initial segment and node of Ranvier. J Biol Chem 270:2352–2359. 10.1074/jbc.270.5.2352 [DOI] [PubMed] [Google Scholar]
- Kuba H. (2012) Structural tuning and plasticity of the axon initial segment in auditory neurons. J Physiol 590:5571–5579. 10.1113/jphysiol.2012.237305 [DOI] [PMC free article] [PubMed] [Google Scholar]
- Kuba H, Ohmori H (2009) Roles of axonal sodium channels in precise auditory time coding at nucleus magnocellularis of the chick. J Physiol 587:87–100. 10.1113/jphysiol.2008.162651 [DOI] [PMC free article] [PubMed] [Google Scholar]
- Kuba H, Ishii TM, Ohmori H (2006) Axonal site of spike initiation enhances auditory coincidence detection. Nature 444:1069–1072. 10.1038/nature05347 [DOI] [PubMed] [Google Scholar]
- Kuba H, Oichi Y, Ohmori H (2010) Presynaptic activity regulates Na+ channel distribution at the axon initial segment. Nature 465:1075–1078. 10.1038/nature09087 [DOI] [PubMed] [Google Scholar]
- Kuba H, Adachi R, Ohmori H (2014) Activity-dependent and activity-independent development of the axon initial segment. J Neurosci 34:3443–3453. 10.1523/JNEUROSCI.4357-13.2014 [DOI] [PMC free article] [PubMed] [Google Scholar]
- Kuba H, Yamada R, Ishiguro G, Adachi R (2015) Redistribution of Kv1 and Kv7 enhances neuronal excitability during structural axon initial segment plasticity. Nat Commun 6:8815. 10.1038/ncomms9815 [DOI] [PMC free article] [PubMed] [Google Scholar]
- Leão RM, Kushmerick C, Pinaud R, Renden R, Li GL, Taschenberger H, Spirou G, Levinson SR, von Gersdorff H (2005) Presynaptic Na+ channels: locus, development, and recovery from inactivation at a high-fidelity synapse. J Neurosci 25:3724–3738. [DOI] [PMC free article] [PubMed] [Google Scholar]
- Leterrier C. (2018) The axon initial segment: an updated viewpoint. J Neurosci 38:2135–2145. 10.1523/JNEUROSCI.1922-17.2018 [DOI] [PMC free article] [PubMed] [Google Scholar]
- Leterrier C, Vacher H, Fache M-P, d'Ortoli SA, Castets F, Autillo-Touati A, Dargent B (2011) End-binding proteins EB3 and EB1 link microtubules to ankyrin G in the axon initial segment. Proc Natl Acad Sci U S A 108:8826–8831. 10.1073/pnas.1018671108 [DOI] [PMC free article] [PubMed] [Google Scholar]
- Lippe WR. (1995) Relationship between frequency of spontaneous bursting and tonotopic position in the developing avian auditory system. Brain Res 703:205–213. 10.1016/0006-8993(95)01096-3 [DOI] [PubMed] [Google Scholar]
- Lippe WR, Rubel EW (1985) Ontogeny of tonotopic organization of brain stem auditory nuclei in the chicken: implications for development of the place principle. J Comp Neurol 237:273–289. 10.1002/cne.902370211 [DOI] [PubMed] [Google Scholar]
- Lorincz A, Nusser Z (2008) Cell-type-dependent molecular composition of the axon initial segment. J Neurosci 28:14329–14340. 10.1523/JNEUROSCI.4833-08.2008 [DOI] [PMC free article] [PubMed] [Google Scholar]
- Madeja M. (2000) Do neurons have a reserve of sodium channels for the generation of action potentials? A study on acutely isolated CA1 neurons from the guinea-pig hippocampus. Eur J Neurosci 12:1–7. 10.1046/j.1460-9568.2000.00871.x [DOI] [PubMed] [Google Scholar]
- Ogawa Y, Schafer DP, Horresh I, Bar V, Hales K, Yang Y, Susuki K, Peles E, Stankewich MC, Rasband MN (2006) Spectrins and ankyrinB constitute a specialized paranodal cytoskeleton. J Neurosci 26:5230–5239. 10.1523/JNEUROSCI.0425-06.2006 [DOI] [PMC free article] [PubMed] [Google Scholar]
- Oline SN, Ashida G, Burger RM (2016) Tonotopic optimization for temporal processing in the cochlear nucleus. J Neurosci 36:8500–8515. 10.1523/JNEUROSCI.4449-15.2016 [DOI] [PMC free article] [PubMed] [Google Scholar]
- Osorio N, Alcaraz G, Padilla F, Couraud F, Delmas P, Crest M (2005) Differential targeting and functional specialization of sodium channels in cultured cerebellar granule cells. J Physiol 569:801–816. 10.1113/jphysiol.2005.097022 [DOI] [PMC free article] [PubMed] [Google Scholar]
- Parks TN. (1981) Changes in the length and organization of nucleus laminaris dendrites after unilateral otocyst ablation in chick embryos. J Comp Neurol 202:47–57. 10.1002/cne.902020105 [DOI] [PubMed] [Google Scholar]
- Rasband MN. (2010) The axon initial segment and the maintenance of neuronal polarity. Nat Rev Neurosci 11:552–562. 10.1038/nrn2852 [DOI] [PubMed] [Google Scholar]
- Rubel EW, Parks TN (1975) Organization and development of brain stem auditory nuclei of the chicken: tonotopic organization of n. magnocellularis and n. laminaris. J Comp Neurol 164:411–434. 10.1002/cne.901640403 [DOI] [PubMed] [Google Scholar]
- Rush AM, Dib-Hajj SD, Waxman SG (2005) Electrophysiological properties of two axonal sodium channels, Nav1.2 and Nav1.6, expressed in mouse spinal sensory neurones. J Physiol 564:803–815. 10.1113/jphysiol.2005.083089 [DOI] [PMC free article] [PubMed] [Google Scholar]
- Saunders JC, Coles RB, Gates R (1973) The development of auditory evoked responses in the cochlea and cochlear nuclei of the chick. Brain Res 63:59–74. 10.1016/0006-8993(73)90076-0 [DOI] [PubMed] [Google Scholar]
- Schlüter A, Rossberger S, Dannehl D, Janssen JM, Vorwald S, Hanne J, Schultz C, Mauceri D, Engelhardt M (2019) Dynamic regulation of synaptopodin and the axon initial segment in retinal ganglion cells during postnatal development. Front Cell Neurosci 13:318. 10.3389/fncel.2019.00318 [DOI] [PMC free article] [PubMed] [Google Scholar]
- Tapia M, Del Puerto A, Puime A, Sánchez-Ponce D, Fronzaroli-Molinieres L, Pallas-Bazarra N, Carlier E, Giraud P, Debanne D, Wandosell F, Garrido JJ (2013) GSK3 and β-catenin determines functional expression of sodium channels at the axon initial segment. Cell Mol Life Sci 70:105–120. 10.1007/s00018-012-1059-5 [DOI] [PMC free article] [PubMed] [Google Scholar]
- Trussell LO. (1999) Synaptic mechanisms for coding timing in auditory neurons. Annu Rev Physiol 61:477–496. 10.1146/annurev.physiol.61.1.477 [DOI] [PubMed] [Google Scholar]
- Wang X, Hong H, Brown DH, Sanchez JT, Wang Y (2017) Distinct neural properties in the low frequency region of the chicken cochlear nucleus magnocellularis. eNeuro 4:ENEURO.0016-17.2017 10.1523/ENEURO.0016-17.2017 [DOI] [PMC free article] [PubMed] [Google Scholar]
- Xu K, Zhong G, Zhuang X (2013) Actin, spectrin, and associated proteins form a periodic cytoskeletal structure in axons. Science 339:452–456. 10.1126/science.1232251 [DOI] [PMC free article] [PubMed] [Google Scholar]
- Yamada R, Kuba H (2016) Structural and functional plasticity at the axon initial segment. Front Cell Neurosci 10:250. 10.3389/fncel.2016.00250 [DOI] [PMC free article] [PubMed] [Google Scholar]
- Yoshimura T, Rasband MN (2014) Axon initial segments: diverse and dynamic neuronal compartments. Curr Opin Neurobiol 27:96–102. 10.1016/j.conb.2014.03.004 [DOI] [PMC free article] [PubMed] [Google Scholar]
- Yoshimura T, Stevens SR, Leterrier C, Stankewich MC, Rasband MN (2017) Developmental changes in expression of βIV spectrin splice variants at axon initial segments and nodes of Ranvier. Front Cell Neurosci 10:304. 10.3389/fncel.2016.00304 [DOI] [PMC free article] [PubMed] [Google Scholar]
- Zhong G, He J, Zhou R, Lorenzo D, Babcock HP, Bennett V, Zhuang X (2014) Developmental mechanism of the periodic membrane skeleton in axons. Elife 3:e04581 10.7554/eLife.04581 [DOI] [PMC free article] [PubMed] [Google Scholar]
- Zhou W, Goldin AL (2004) Use-dependent potentiation of the Nav1.6 sodium channel. Biophys J 87:3862–3872. 10.1529/biophysj.104.045963 [DOI] [PMC free article] [PubMed] [Google Scholar]
- Zonta B, Desmazieres A, Rinaldi A, Tait S, Sherman DL, Nolan MF, Brophy PJ (2011) A critical role for neurofascin in regulating action potential initiation through maintenance of the axon initial segment. Neuron 69:945–956. 10.1016/j.neuron.2011.02.021 [DOI] [PMC free article] [PubMed] [Google Scholar]