INTRODUCTION:
Long-term glycemic variability is associated with various adverse health outcomes in patients with diabetes mellitus (DM). However, the relationship between glycemic variability and gastric cancer remains unclear. We aimed to investigate the association between glycemic variability and gastric cancer incidence in individuals without DM.
METHODS:
We used the Korean National Health Insurance Service data sets of claims and health checkups and included 202,562 individuals without DM. Fasting plasma glucose (FPG) variability was measured using the variability independent of the mean (VIM), coefficient of variation, SD, and average successive variability. The association between FPG variability and gastric cancer incidence was analyzed using Cox regression adjusting for age, sex, body mass index, smoking status, alcohol consumption, regular exercise, income level, family history of cancer, mean FPG level, and number/mean interval of FPG measurements.
RESULTS:
In total, 1,920 patients developed gastric cancer (0.95%) within a median follow-up of 5.6 (5.3, 6.4) years. The fully adjusted hazard ratio and 95% confidence interval for gastric cancer were 1.26 and 1.18–1.34, respectively, in the highest quartile of FPG variability assessed by VIM compared with that in the lowest quartile. Similar results were obtained in the normal and impaired fasting glucose groups and when using the variability indexes, including coefficient of variation, SD, and average successive variability. There was a sequential increase in the incidence of gastric cancer according to the increase in the deciles of FPG variability (P for linear trend <0.001). A 1-SD increase in FPG variability assessed by VIM was significantly associated with a 10.0% increase in gastric cancer risk in the fully adjusted model.
DISCUSSION:
In a DM-free population, high variability in visit-to-visit FPG levels was independently associated with an increased risk of gastric cancer.
INTRODUCTION
Gastric cancer is the fifth commonest type of cancer and the second leading cause of cancer-related deaths worldwide (1,2). Despite a recent increase in the number of tests performed for screening gastric cancer, including endoscopic examinations and measurement of serum carcinoembryonic antigen levels, the gastric cancer mortality rate has not decreased significantly (3). Thus, early detection of and risk stratification for gastric cancer are necessary to reduce morbidity and mortality.
There are several known risk factors for gastric cancer: sex, age, ethnicity, smoking status, and Helicobacter pylori infection (4,5). In addition, metabolic disturbances such as obesity, metabolic syndrome, and diabetes mellitus (DM) also increase gastric cancer risk (6–9). Their common pathological conditions, including hyperglycemia and hyperinsulinemia (or insulin resistance), increase cell proliferation, angiogenesis, and oxidative DNA damage (6,8,10). Hyperglycemia itself promotes epithelial mesenchymal transition, which is associated with cancer progression and metastasis (11).
Beyond hyperglycemia, growing evidence has emphasized the influence of glycemic variability on the incidence of diabetic complications and all-cause or cardiovascular mortality independent of glycemic control in individuals with DM (12). Fluctuations in glucose levels increase oxidative stress, endothelial dysfunction, and subclinical inflammation, promoting organ damage (13). However, whether glycemic variability increases gastric cancer risk in individuals without DM remains unknown.
We aimed to examine the relationship between visit-to-visit glycemic variability and gastric cancer risk in adults without DM using a large nationwide population-based cohort.
METHODS
Data source
Claims and health checkup data from the National Health Insurance Service–National Sample Cohort (NHIS-NSC) were used. The NHIS is a single-payer health care system for all Korean residents managed by the Korean government, covering approximately 98% of the Korean population (14). The NSC is a representative sample cohort of about 2.2% of the total Korean population, allocated using systematical stratified random sampling. Biannual health checkups are provided without additional cost to those aged at least 40 years. All employers are responsible for arranging examinations; for self-employed individuals, a post mail is sent biannually instructing them to visit the assigned health examination center after overnight fasting for at least 8 hours (14). Detailed information and the quality of this cohort have been reported previously (14–18). The claims data set comprises data on sociodemographic variables; diagnosis statements defined by the International Classification of Diseases, 10th Revision (ICD-10); prescriptions; and hospital visit dates. The health checkup data set includes data of biannual health examinations for all eligible participants, including anthropometric measurements, questionnaires on lifestyle and behavior, and regular blood test parameters (including fasting glucose levels). Researchers can analyze NHIS-NSC data if their study is approved by the review committee.
Study population
Since these cohort data were obtained in 2002, to maximize the number of participants and to minimize the differences in duration variability measurement, we selected individuals aged ≥40 years at baseline who underwent at least 1 health checkup between 2006 and 2008 (index year) and had more than 2 health checkups during the 5 years before the index year. The time point of the last health checkup between 2006 and 2008 was considered as the baseline. Of the 300,241 patients within the index year, we excluded those previously diagnosed with DM (n = 70,569), with any type of cancer (n = 18,662), and with missing data for at least 1 variable (n = 19,533); thus, 202,562 individuals were eligible for inclusion (see Figure 1, Supplementary Digital Content 1, http://links.lww.com/CTG/A368). The protocols were approved by the NHIS review committee and the Korea University institutional review board (IRB no. 2019GR0038). The requirement for obtaining informed consent was waived by the IRB because the NHIS provided the researchers with anonymous, deidentified information.
Assessment of glycemic variability
Glycemic variability was determined as visit-to-visit intraindividual fasting plasma glucose (FPG) variability during the 5 years before the baseline. Fasting glucose levels were measured in all participants at least thrice. We used 4 variability indexes to verify the consistency of the hypothesis: (i) variability independent of the mean (VIM), determined using the following formula: 100 × SD/meanβ (β; the regression coefficient based on the natural logarithm of the SD over the natural logarithm of the mean), (ii) coefficient of variation (CV), (iii) SD, and (iv) average successive variability (ASV), which is the average absolute difference between successive values and was determined using the following formula: |Glu1 − Glu2| + |Glu2 − Glu3|+ ··· + |GluN-1 − GluN|/N − 1 (N, the number of measurements) (19). The higher the values of FPG-SD, CV, VIM, and ASV, the greater is the visit-to-visit glycemic fluctuation.
Definitions and measurements
DM was defined using ICD-10 codes E10–14 or a fasting glucose level ≥126 g/dL. Cancer was defined as at least 1 claim for any type of cancer, with an ICD-10 code beginning with the letter C. Gastric ulcers were defined under the ICD-10 code K25 and duodenal ulcers under the code K26. Normal fasting glucose (NFG) levels were defined as fasting glucose levels <100 mg/dL, whereas impaired fasting glucose (IFG) levels were defined as fasting glucose levels between 100 and 125 mg/dL at baseline. The mean fasting glucose level was defined as the average of all fasting glucose measurements in the index year and within the previous 5 years.
Self-report questionnaires were used to evaluate smoking status, alcohol consumption, regular exercise, and family history of any cancer type. Current smoking was defined as the use of any tobacco product in the index year. Heavy alcohol consumption was defined as alcohol consumption on at least 3 d/wk. Regular exercise was defined as moderate-intensity exercise performed at least 3 d/wk. Low income was defined as a monthly income in the lowest 20% of the total population distribution. All participants underwent physical examinations (height, weight, and blood pressure); venous blood samples were drawn for glucose measurements after overnight fasting for at least 8 hours. Hospitals conducting the examinations underwent regular quality control checks by external quality assessment supervised according to the Korean Association of Quality Assurance for Clinical Laboratory guidelines (11).
Outcomes and follow-up
The end point was gastric cancer incidence based on hospitalization records for gastric cancer (ICD-10 C16) as a major diagnosis. Gastric cancer subsites were identified as noncardia (ICD-10 C16.0) or cardia (C16.1–16.9). The study population was followed up from the baseline to the date of gastric cancer diagnosis, death, or the end of the study period (December 31, 2013).
Statistical analyses
Baseline characteristics were presented as mean ± SD or median (25th and 75th) for continuous variables and as numbers (%) for categorical variables. Participants were grouped into quartiles or deciles according to fasting glucose variability; differences in baseline characteristics were determined using analysis of variance or χ2 tests. Gastric cancer incidence was calculated as the number of incident cases divided by the total follow-up duration (person-years). The cumulative incidence of gastric cancer according to FPG variability was analyzed using Kaplan-Meier estimates. A Cox proportional hazards model was used to calculate the hazard ratio (HR), with its corresponding confidence intervals (CIs), for gastric cancer with multivariable adjustments. Model 1 was adjusted for age, sex, and body mass index. Model 2 was additionally adjusted for smoking status, alcohol consumption, regular exercise, income level, family cancer history, mean fasting glucose levels, and number/mean interval of FPG measurements. Variance of inflation factor (VIF) was calculated to test collinearity of independence of variables including FPG variability and mean fasting glucose and all VIFs with variables were <10.0. In addition, baseline fasting glucose levels were stratified into NFG and IFG levels, and the same analysis was performed. We tested the proportionality of the subdistribution hazard assumption using Schoenfeld residuals; there was no violation of the assumption.
A sensitivity analysis was conducted to test the robustness of our results, using 5 exclusion criteria. First, we excluded individuals who developed gastric cancer within 2 years of the baseline measurement to minimize the possibility of reversal causality. Second, we excluded individuals diagnosed with gastric or duodenal ulcers at baseline as these can be considered as premalignant lesions. Third, we excluded individuals who had IFG at least once during 5 years before the baseline because IFG itself might significantly increase cancer risk. Fourth, we excluded individuals who developed DM from the index year to the end of follow-up. Fifth, we excluded individuals who developed IFG or DM from the index year to the follow-up period. In addition, we conducted a separate analysis of the incidence of cardia vs noncardia gastric cancer to determine whether glycemic variability had a differential impact on the development of cardia and noncardia cancer. The cardia subtype is closely related to gastroesophageal reflux and obesity, whereas noncardia cancer is strongly related to H. pylori infection (20). We presumed that the association between fasting glucose variability and gastric cancer incidence varies according to anatomical site. The Statistical Analysis System software (Version 9.3; SAS Institute, Cary, NC) was used to perform all analyses. A P value <0.05 was considered significant.
RESULTS
Baseline characteristics of the study population
In total, 202,562 participants were included, of which 52,806 (26.1%) had IFG. The median follow-up duration was 5.6 (5.3–6.4) years. In over 1,175,552 person-years of observation, 1,920 participants developed gastric cancer. FPG levels of each subject were measured 3 to 6 times (3 times n = 124,958, 4 times 22,173, 5 times 20,138, and 6 times 35,293).
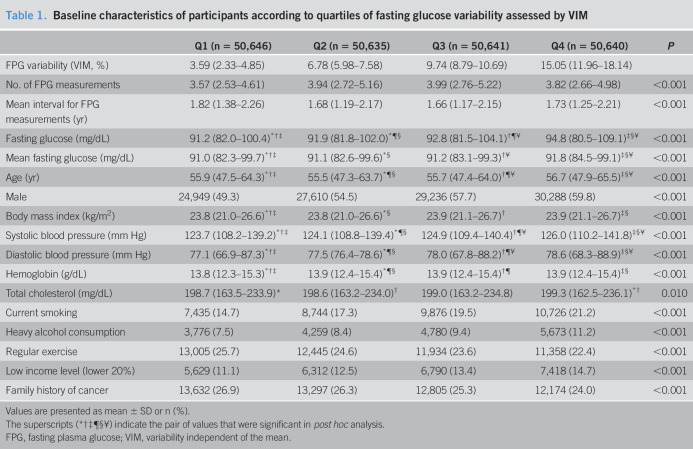
Participants with higher quartiles of FPG variability had higher baseline fasting and mean fasting glucose levels, were more likely to be male, had higher rates of smoking and alcohol consumption, and had lower rates of regular exercise (Table 1). Total cholesterol levels were not significantly different among the 4 groups. Baseline characteristics according to the quartiles of other variables defined using CV, SD, and ASV showed similar trends (data not shown). Participants who developed gastric cancer had higher FPG variability, but fasting glucose levels were not significantly different. Those who developed gastric cancer were older, mostly male, had higher systolic blood pressure, lower total cholesterol levels, and higher rates of smoking and heavy alcohol consumption (see Table 1, Supplementary Digital Content 2, http://links.lww.com/CTG/A368).
Table 1.
Baseline characteristics of participants according to quartiles of fasting glucose variability assessed by VIM
Values are presented as mean ± SD or n (%).
The superscripts (*†‡¶§¥) indicate the pair of values that were significant in post hoc analysis.
FPG, fasting plasma glucose; VIM, variability independent of the mean.
Gastric cancer risk according to glycemic variability
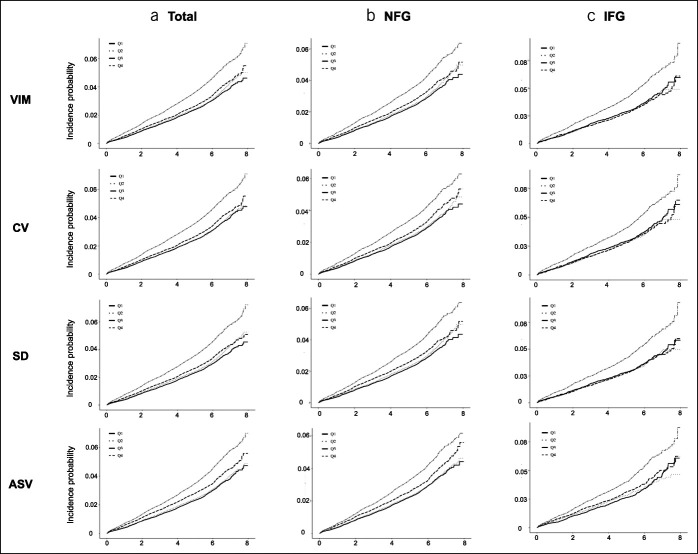
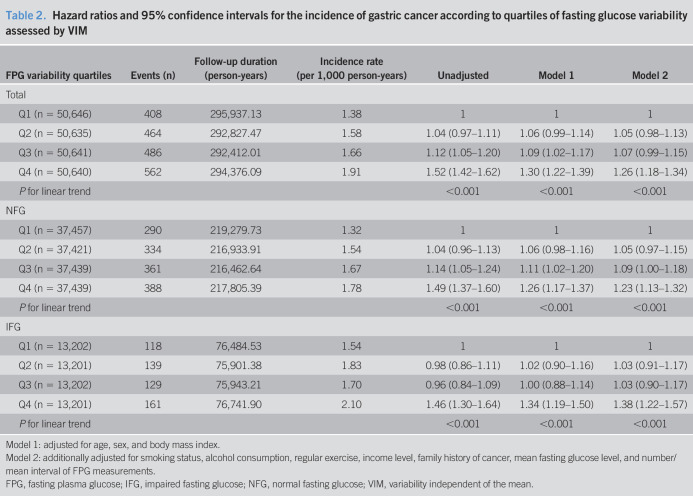
In total, 1,920 (0.95%) patients had newly diagnosed gastric cancer within a median follow-up of 5.6 years. Kaplan-Meier curves demonstrated that the cumulative gastric cancer incidence increased progressively with increasing quartiles of FPG variability in individuals without DM; similar trends were seen in both the NFG and IFG groups (Figure 1). Gastric cancer risk progressively increased with increasing quartiles of FPG variability, compared with the lowest quartile, after fully adjusting for confounding factors, including age, sex, and body mass index (HR: 1.30, 95% CI: 1.22–1.39, model 1) (Table 2). Similar trends of increasing gastric cancer incidence were seen after additionally adjusting for smoking status, alcohol consumption, regular exercise, income level, family cancer history, mean fasting glucose levels, and number/mean interval of FPG measurements (HR: 1.26, 95% CI: 1.18–1.34, model 2). The HR for gastric cancer increased in both the NFG and IFG groups along with the quartiles of FPG variability after full adjustment for confounding factors, including baseline glucose levels. Similar results were obtained when the attained age was used as the time scale (see Table 2, Supplementary Digital Content 2, http://links.lww.com/CTG/A368). Similar trends were observed when using other indexes of variability, such as CV, SD, and ASV (see Tables 3–5, Supplementary Digital Content 2, http://links.lww.com/CTG/A368).
Figure 1.
Cumulative incidence of gastric cancer according to quartiles of fasting glucose assessed by VIM, CV, SD, and ASV in the (a) total (b) NFG and (c) IFG groups. ASV, average successive variability; CV, coefficient of variation; IFG, impaired fasting glucose; NFG, normal fasting glucose; VIM, variability independent of the mean.
Table 2.
Hazard ratios and 95% confidence intervals for the incidence of gastric cancer according to quartiles of fasting glucose variability assessed by VIM
Model 1: adjusted for age, sex, and body mass index.
Model 2: additionally adjusted for smoking status, alcohol consumption, regular exercise, income level, family history of cancer, mean fasting glucose level, and number/mean interval of FPG measurements.
FPG, fasting plasma glucose; IFG, impaired fasting glucose; NFG, normal fasting glucose; VIM, variability independent of the mean.
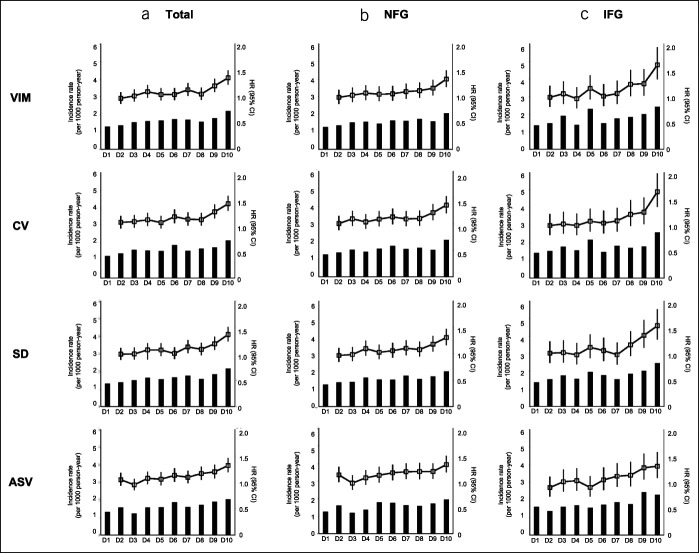
We also analyzed gastric cancer incidence according to deciles of FPG variability to confirm the linear association (Figure 2). Those in the highest decile of FPG variability showed a 35.6% increased risk of gastric cancer (HR: 1.36, 95% CI: 1.23–1.50) compared with those in the lowest quartile after full adjustment for confounding factors. The risk increased by 60% in the IFG group (HR: 1.60, 95% CI: 1.33–1.93) (see Table 6, Supplementary Digital Content 2, http://links.lww.com/CTG/A368). Similar results were obtained when variability was analyzed using CV, SD, and ASV (see Tables 7–9, Supplementary Digital Content 2, http://links.lww.com/CTG/A368). Furthermore, the fully adjusted HR for gastric cancer development was 1.10 (95% CI: 1.07–1.12, P < 0.001) according to a 1-SD increase in FPG variability assessed using VIM.
Figure 2.
Incidence and adjusted hazard ratios of gastric cancer according to deciles of fasting glucose variability assessed by VIM, CV, SD, and ASV in the (a) total (b) NFG and (c) IFG groups. Adjusted for age, sex, body mass index, smoking status, alcohol consumption, regular exercise, income level, family cancer history, and mean fasting glucose levels. ASV, average successive variability; CV, coefficient of variation; IFG, impaired fasting glucose; NFG, normal fasting glucose; VIM, variability independent of the mean.
Sensitivity analyses
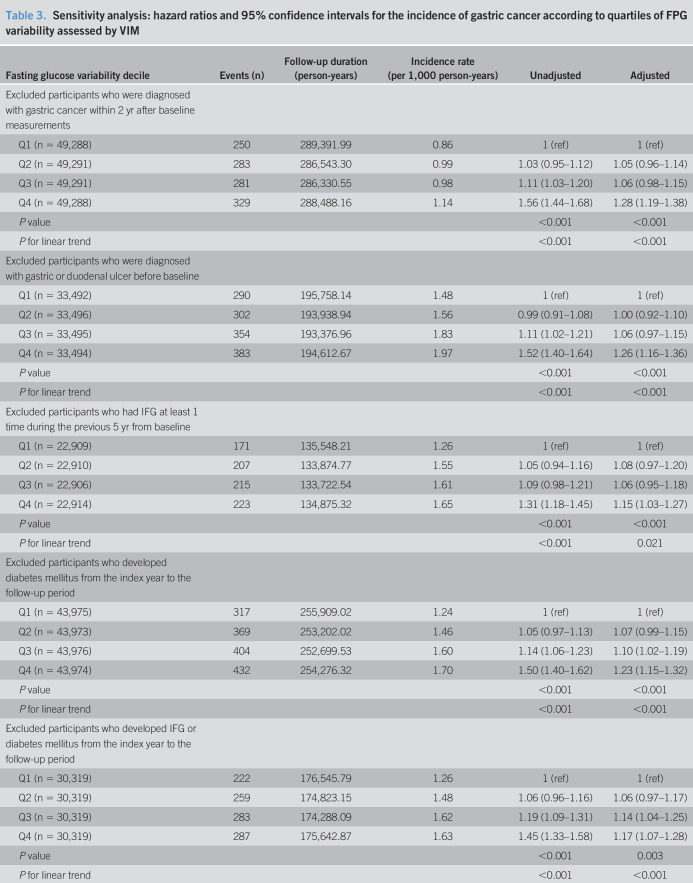
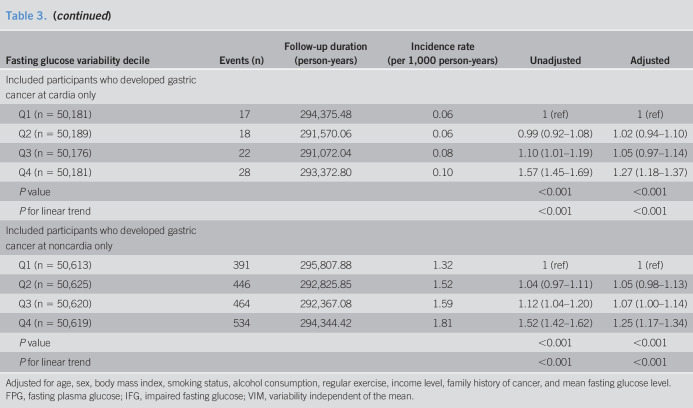
We conducted several sensitivity analyses to establish the robustness of the association between FPG variability and gastric cancer (Table 3). The results were nearly identical after excluding participants diagnosed with gastric cancer within 2 years after the baseline measurements, who were diagnosed with gastric or duodenal ulcers before the baseline, who had IFG at least once during 5 years before the baseline, or who developed IFG and/or DM from the index year to the end of follow-up. In the subgroup analysis according to anatomical site, similar results were obtained after adjusting for confounding factors, including mean fasting glucose levels.
Table 3.
Sensitivity analysis: hazard ratios and 95% confidence intervals for the incidence of gastric cancer according to quartiles of FPG variability assessed by VIM
Adjusted for age, sex, body mass index, smoking status, alcohol consumption, regular exercise, income level, family history of cancer, and mean fasting glucose level.
FPG, fasting plasma glucose; IFG, impaired fasting glucose; VIM, variability independent of the mean.
DISCUSSION
In this nationwide cohort of 202,562 individuals without DM from the general population, we found that FPG variability assessed using VIM was associated with an increased gastric cancer risk for the first time. The association remained significant after adjusting for multiple variables and using different variability indexes. Similar results were obtained after excluding individuals diagnosed with gastric cancer within 2 years after the baseline measurements, individuals with gastric or duodenal ulcers before the baseline measurement, or individuals with IFG at least once during 5 years before the baseline measurement. This effect was more prominent in individuals with IFG; the association between glycemic variability and gastric cancer incidence did not differ according to the cardia or noncardia subtypes.
In addition to the traditional risk factors of gastric cancer, metabolic disorders including obesity, metabolic syndrome, and hyperglycemia were presumed to affect the risks associated with carcinogenesis of the stomach (9,21). Many studies have examined the association between DM and gastric cancer, but the results were inconsistent and differed depending on the characteristics of the study population, such as sex and ethnicity. In the DM-free population analyzed in this study, baseline fasting glucose levels were not significantly different between patients with gastric cancer and controls. Contrastingly, glycemic variability was significantly higher in patients with gastric cancer than in those without. This finding implied that fasting glucose levels, per se, have little impact, but variability in these levels may have a significant role in the carcinogenesis of the stomach in a nondiabetic population.
Long-term glycemic variability is a marker of glucose homeostasis, and increased variability implies increased glucose fluctuation. Glycemic variability has been extensively studied in diabetic models; the results have indicated its impact on the development and progression of diabetic complications and mortality, similar to that seen with chronic hyperglycemia (12,22). A few studies have investigated the relationship between glycemic variability and cancer, but those studies were conducted only in individuals with DM. Muggeo et al. (23) reported that in 1,400 patients with type 2 diabetes, glycemic variability increased the rates of malignancy-related, all-cause, and cardiovascular disease–related mortalities. Contrastingly, Takao et al. (24) demonstrated that HbA1C variability was not associated with cancer mortality but was related to all-cause and non–cancer-related mortalities in a 16-year follow-up study of 754 patients with type 2 diabetes. Interestingly, in the latter study, the mean HbA1C value was related to cancer mortality (24), suggesting that the effect of glycemic variability on cancer progression might be attenuated by chronic hyperglycemia in the subjects with DM. In a recent prospective cohort analysis, the positive association between glycemic variability and mortality was significant and more obvious in individuals without DM than in those with DM (25). However, no studies have investigated the association between glycemic variability and cancer in nondiabetic populations. Furthermore, previous studies did not determine cancer incidence but instead focused only on cancer mortality. The effect of glycemic variability on cancer incidence might be different from its effect on cancer mortality. Recently, Saito et al. (26) reported that higher glycemic variability showed a dose-dependent association with later tumorigenesis in 2,640 patients with DM. However, they evaluated all cancer types without considering site- or organ-specific cancers and included a relatively small sample of patients with DM.
To date, no study has examined the association between glycemic variability and gastric cancer risk in a DM-free population. Our results indicated that higher FPG variability significantly increased gastric cancer risk in a large-scale general population without DM after adjusting for multiple variables. There are several possible hypotheses for this observation. First, glycemic variability indicates the extent of oxidative stress and systemic inflammation. Glucose oscillation induces more oxidative stress than consistent hyperglycemia, resulting in enhanced collagen synthesis and accelerated apoptosis in human umbilical vein endothelial cells (27). During periods of high glycemic variability, superoxide production via NADPH oxidase activity is induced in the mitochondria (28), and the AKT signaling pathway is inhibited by the increase in nuclear factor kappa B and caspase-3 expression (29). Therefore, overproduction of reactive oxygen species and inflammatory cytokines might cause DNA damage in the gastric mucosa and interfere with repair, exacerbating the gastric cancer risk (10). Second, high glycemic variability reflects irregular eating habits or consumption of foods with a high glycemic index. Evidence indicates that dietary factors play a critical role in gastric oncogenesis (30). Irregular meal patterns disturb energy metabolism, lowering postprandial energy expenditure, although the mean energy intake does not differ (31). Augustin et al. (32) reported that the odds ratio for gastric cancer in the highest quartile of glycemic load was 1.99 (95% CI: 1.47–2.55) compared with that in the lowest quartile group. Bertuccio et al. (33) found similar results that in the highest quintile of glycemic load: the odds ratio for gastric cancer was 2.5 (95% CI: 1.3–4.9) compared with that in the lowest quintile. In a recent meta-analysis, a high glycemic load increased gastric cancer risk, especially in the Asian subgroup (19). Third, glycemic variability causes the apoptosis of pancreatic β cells (34), which may result in the deterioration of glycemic control and subsequent progression of complications. Meanwhile, glycemic instability itself might be a marker of β-cell dysfunction in at-risk individuals before diabetes onset. Furthermore, elevated gastric cancer risk was observed in a Japanese population with higher insulin and C peptide levels caused by abnormal glucose homeostasis (35).
One of the biggest strengths of this study is that it examined a nationwide population. Furthermore, variability was examined over 5 years from the index year, with a subsequent follow-up period of >5 years for gastric cancer incidence. Moreover, we used several indexes of variability, which have distinct characteristics. VIM is independent of the mean level but dependent on the sample size. CV is a unitless measure of standardized variation, SD is a measure of absolute variation, and ASV is relatively stable in sample size (36–38). These consistent results using different indexes of variability strongly suggest that glycemic variability might have an impact on gastric cancer incidence.
There are several limitations to this study. First, because we used health insurance claims data, there could be a discrepancy with the actual diagnosis. Nevertheless, in Korea, cancer registration is strictly performed by a specially trained registry staff, and several studies have validated the accuracy of cancer diagnosis using ICD-10 codes and demonstrated high sensitivity and specificity (39,40). Second, although the results were adjusted for possible factors affecting gastric cancer, there are several other factors that we did not adjust for, including H. pylori infection, use of medical drugs (proton pump inhibitors), HbA1C levels, and diet pattern. To minimize their effects, we adjusted for the mean fasting glucose levels and performed several sensitivity analyses, leading to similar results. Third, only participants older than 40 years who underwent regular health checkups in Korea were included; thus, it is hard to generalize these findings to other populations or consider it as representative of the Korean population. Finally, this study was a retrospective cohort study and not an intervention study; hence, we could not conclude whether improving diet, modifying lifestyle, performing regular exercise, and stopping smoking can improve FPG variability and reduce gastric cancer risk.
In conclusion, higher FPG variability significantly increased the development of gastric cancer in individuals without DM independent of other risk factors, including mean fasting glucose levels. Our results indicate that reducing glycemic variability might be important in preventing gastric cancer, even in the general population. Further studies are warranted to validate these results and explore the underlying mechanisms mediating FPG variability and gastric cancer risk.
CONFLICTS OF INTEREST
Guarantor of the article: Hye Jin Yoo, MD, PhD.
Specific author contributions: Hye Jin Yoo, MD, PhD, and Geum Joon Cho, MD, PhD, contributed equally to this work. S.-h.H., J.A.K., Y.-B.L., E.R., K.M.C., S.H.B., G.J.C., and H.J.Y. conceptualized and designed the work. E.N., J.K., and S.Y.H. acquired and analyzed the data. S.-h.H. and H.J.Y. interpreted the results. S.-h.H. drafted the manuscript, whereas G.J.C. and H.J.Y. revised the manuscript. G.J.C. and H.J.Y. equally supervised all the processes of manuscript preparation. All authors read and approved the final version of the manuscript.
Financial support: H. J. Yoo was supported by the Basic Science Research Program through the National Research Foundation of Korea funded by the Ministry of Education (2018R1D1A1B07047587). This research was supported by a grant from the Establish R&D Platform Project through the Korea University Medical Center and Korea University Guro Hospital, funded by the Korea University Guro Hospital (grant number: O1903761).
Potential competing interests: None to report.
Study Highlights.
WHAT IS KNOWN
✓ Metabolic disturbances such as DM and metabolic syndrome increase the risk of gastric cancer.
✓ Long-term glycemic variability is associated with various adverse health outcomes in patients with DM.
✓ The relationship between glycemic variability and gastric cancer remains unclear in individuals without DM.
WHAT IS NEW HERE
✓ This is the first study to demonstrate that higher glycemic variability significantly increased gastric cancer risk in individuals without DM.
✓ The association remained significant after adjusting for multiple variables and using different variability indexes.
✓ The effect was more prominent in individuals with IFG.
✓ No differences were observed in glycemic variability and gastric cancer incidence according to cardia or noncardia subtypes.
✓ Reducing glycemic variability might prevent gastric cancer even in individuals without DM.
Supplementary Material
Footnotes
SUPPLEMENTARY MATERIAL accompanies this paper at http://links.lww.com/CTG/A368, http://links.lww.com/CTG/A369
REFERENCES
- 1.Fitzmaurice C, Fitzmaurice C, Akinyemiju TF, et al. Global, regional, and national cancer incidence, mortality, years of life lost, years lived with disability, and disability-adjusted life-years for 29 cancer groups, 1990 to 2016: A systematic analysis for the global burden of disease study. JAMA Oncol 2018;4:1553–68. [DOI] [PMC free article] [PubMed] [Google Scholar]
- 2.Jemal A, Bray F, Center MM, et al. Global cancer statistics. CA Cancer J Clin 2011;61:69–90. [DOI] [PubMed] [Google Scholar]
- 3.Ferro A, Peleteiro B, Malvezzi M, et al. Worldwide trends in gastric cancer mortality (1980–2011), with predictions to 2015, and incidence by subtype. Eur J Cancer 2014;50:330–44. [DOI] [PubMed] [Google Scholar]
- 4.Uemura N, Okamoto S, Yamamoto S, et al. Helicobacter pylori infection and the development of gastric cancer. N Engl J Med 2001;345:784–9. [DOI] [PubMed] [Google Scholar]
- 5.Karimi P, Islami F, Anandasababathy S, et al. Gastric cancer: Descriptive epidemiology, risk factors, screening, and prevention. Cancer Epidemiol Biomarkers Prev 2014;23:700–13. [DOI] [PMC free article] [PubMed] [Google Scholar]
- 6.Aleman JO, Eusebi LH, Ricciardiello L, et al. Mechanisms of obesity-induced gastrointestinal neoplasia. Gastroenterology 2014;146:357–73. [DOI] [PMC free article] [PubMed] [Google Scholar]
- 7.Miao ZF, Xu H, Xu YY, et al. Diabetes mellitus and the risk of gastric cancer: A meta-analysis of cohort studies. Oncotarget 2017;8:44881–92. [DOI] [PMC free article] [PubMed] [Google Scholar]
- 8.Bianchini F, Kaaks R, Vainio H. Overweight, obesity, and cancer risk. Lancet Oncol 2002;3:565–74. [DOI] [PubMed] [Google Scholar]
- 9.Yang P, Zhou Y, Chen B, et al. Overweight, obesity and gastric cancer risk: Results from a meta-analysis of cohort studies. Eur J Cancer 2009;45:2867–73. [DOI] [PubMed] [Google Scholar]
- 10.Kim YJ, Kim EH, Hahm KB. Oxidative stress in inflammation-based gastrointestinal tract diseases: Challenges and opportunities. J Gastroenterol Hepatol 2012;27:1004–10. [DOI] [PubMed] [Google Scholar]
- 11.Jun SH, Song J, Song WH. Annual report on the external quality assessment scheme for clinical chemistry in Korea (2015). J Lab Med Qual Assur 2016;38:111–9. [Google Scholar]
- 12.Gorst C, Kwok CS, Aslam S, et al. Long-term glycemic variability and risk of adverse outcomes: A systematic review and meta-analysis. Diabetes Care 2015;38:2354–69. [DOI] [PubMed] [Google Scholar]
- 13.Monnier L, Mas E, Ginet C, et al. Activation of oxidative stress by acute glucose fluctuations compared with sustained chronic hyperglycemia in patients with type 2 diabetes. JAMA 2006;295:1681–7. [DOI] [PubMed] [Google Scholar]
- 14.Lee J, Lee JS, Park SH, et al. Cohort profile: The National Health Insurance Service-National Sample Cohort (NHIS-NSC), South Korea. Int J Epidemiol 2017;46:e15. [DOI] [PubMed] [Google Scholar]
- 15.Cheol Seong S, Kim YY, Khang YH, et al. Data resource profile: The National Health Information Database of the National Health Insurance Service in South Korea. Int J Epidemiol 2017;46:799–800. [DOI] [PMC free article] [PubMed] [Google Scholar]
- 16.Seong SC, Kim YY, Park SK, et al. Cohort profile: The National Health Insurance Service-National Health Screening Cohort (NHIS-HEALS) in Korea. BMJ Open 2017;7:e016640. [DOI] [PMC free article] [PubMed] [Google Scholar]
- 17.Lee YW, Jeon BR, Kim JG, et al. Annual report on the external quality assessment scheme for routine clinical chemistry in Korea (2016). J Lab Med Qual Assur 2017;39:61–75. [Google Scholar]
- 18.Song SO, Jung CH, Song YK, et al. Background and data configuration process of a nationwide population-based study using the Korean national health insurance system. Diabetes Metab J 2014;38:395–403. [DOI] [PMC free article] [PubMed] [Google Scholar]
- 19.Bangalore S, Fayyad R, Messerli FH, et al. Relation of variability of low-density lipoprotein cholesterol and blood pressure to events in patients with previous myocardial infarction from the IDEAL trial. Am J Cardiol 2017;119:379–87. [DOI] [PubMed] [Google Scholar]
- 20.Balakrishnan M, George R, Sharma A, et al. Changing trends in stomach cancer throughout the world. Curr Gastroenterol Rep 2017;19:36. [DOI] [PMC free article] [PubMed] [Google Scholar]
- 21.Li S, Wang J, Zhang B, et al. Diabetes mellitus and cause-specific mortality: A population-based study. Diabetes Metab J 2019;43:319–41. [DOI] [PMC free article] [PubMed] [Google Scholar]
- 22.Park KH, Kim U, Choi KU, et al. Hemorheologic alterations in patients with type 2 diabetes mellitus presented with an acute myocardial infarction. Diabetes Metab J 2018;42:155–63. [DOI] [PMC free article] [PubMed] [Google Scholar]
- 23.Muggeo M, Zoppini G, Bonora E, et al. Fasting plasma glucose variability predicts 10-year survival of type 2 diabetic patients: The Verona Diabetes Study. Diabetes Care 2000;23:45–50. [DOI] [PubMed] [Google Scholar]
- 24.Takao T, Matsuyama Y, Yanagisawa H, et al. Association between HbA1c variability and mortality in patients with type 2 diabetes. J Diabetes Complicat 2014;28:494–9. [DOI] [PubMed] [Google Scholar]
- 25.Echouffo-Tcheugui JB, Zhao S, Brock G, et al. Visit-to-visit glycemic variability and risks of cardiovascular events and all-cause mortality: The ALLHAT study. Diabetes Care 2019;42:486–93. [DOI] [PMC free article] [PubMed] [Google Scholar]
- 26.Saito Y, Noto H, Takahashi O, et al. Visit-to-visit hemoglobin A1c variability is associated with later cancer development in patients with diabetes mellitus. Cancer J 2019;25:237–40. [DOI] [PubMed] [Google Scholar]
- 27.Jones SC, Saunders HJ, Qi W, et al. Intermittent high glucose enhances cell growth and collagen synthesis in cultured human tubulointerstitial cells. Diabetologia 1999;42:1113–9. [DOI] [PubMed] [Google Scholar]
- 28.Maeda M, Hayashi T, Mizuno N, et al. Intermittent high glucose implements stress-induced senescence in human vascular endothelial cells: Role of superoxide production by NADPH oxidase. PLoS One 2015;10:e0123169. [DOI] [PMC free article] [PubMed] [Google Scholar]
- 29.Ying C, Liu T, Ling H, et al. Glucose variability aggravates cardiac fibrosis by altering AKT signalling path. Diab Vasc Dis Res 2017;14:327–35. [DOI] [PubMed] [Google Scholar]
- 30.Lissowska J, Gail MH, Pee D, et al. Diet and stomach cancer risk in Warsaw, Poland. Nutr Cancer 2004;48:149–59. [DOI] [PubMed] [Google Scholar]
- 31.Farshchi HR, Taylor MA, Macdonald IA. Decreased thermic effect of food after an irregular compared with a regular meal pattern in healthy lean women. Int J Obes Relat Metab Disord 2004;28:653–60. [DOI] [PubMed] [Google Scholar]
- 32.Augustin LS, Gallus S, Negri E, et al. Glycemic index, glycemic load and risk of gastric cancer. Ann Oncol 2004;15:581–4. [DOI] [PubMed] [Google Scholar]
- 33.Bertuccio P, Praud D, Chatenoud L, et al. Dietary glycemic load and gastric cancer risk in Italy. Br J Cancer 2009;100:558–61. [DOI] [PMC free article] [PubMed] [Google Scholar]
- 34.Del Guerra S, Grupillo M, Masini M, et al. Gliclazide protects human islet beta-cells from apoptosis induced by intermittent high glucose. Diabetes Metab Res Rev 2007;23:234–8. [DOI] [PubMed] [Google Scholar]
- 35.Hidaka A, Sasazuki S, Goto A, et al. Plasma insulin, C-peptide and blood glucose and the risk of gastric cancer: The Japan Public Health Center-based prospective study. Int J Cancer 2015;136:1402–10. [DOI] [PubMed] [Google Scholar]
- 36.Dolan E, O'Brien E. Blood pressure variability: Clarity for clinical practice. Hypertension 2010;56:179–81. [DOI] [PubMed] [Google Scholar]
- 37.Liu X. Managing cardiovascular risk in hypertension: Methodological issues in blood pressure data analysis. Thesis, Università degli Studi di Milano-Bicocca, 2017.
- 38.Bangalore S, Breazna A, DeMicco DA, et al. Visit-to-visit low-density lipoprotein cholesterol variability and risk of cardiovascular outcomes: Insights from the TNT trial. J Am Coll Cardiol 2015;65:539–48. [DOI] [PubMed] [Google Scholar]
- 39.Hwang YJ, Kim N, Yun CY, et al. Validation of administrative big database for colorectal cancer searched by international classification of disease 10th codes in Korean: A retrospective big-cohort study. J Cancer Prev 2018;23:183–90. [DOI] [PMC free article] [PubMed] [Google Scholar]
- 40.Oh CM, Won YJ, Jung KW, et al. Cancer statistics in Korea: Incidence, mortality, survival, and prevalence in 2013. Cancer Res Treat 2016;48:436–50. [DOI] [PMC free article] [PubMed] [Google Scholar]
Associated Data
This section collects any data citations, data availability statements, or supplementary materials included in this article.


