. 2020 Aug 14;9:e57277. doi: 10.7554/eLife.57277

Figure 4. 3D-map of extension-less variant DHBc_Δ78–122 R124E (DHBcR124EΔ) in comparison to DHBc.

(a) Segment of the DHBcR124EΔ capsid colored by the radial position. The Fourier-Shell correlation and local resolution analysis is shown in Figure 4—figure supplement 1. (b) Equatorial slice through the EM-density of DHBcR124EΔ. All spikes show narrow cross sections (arrows). A shell of diffuse density underneath the protein shell is highlighted by a white arch. (c) Close-up along the two-fold symmetry axis of a surface representation of DHBcR124EΔ (left) and DHBc (right) color-coded with the differences between the two maps. The color key is given below. Positive densities (additional density in DHBc) are shown in red and negative densities in blue (additional density in DHBcR124EΔ. (d) Model of DHBc (grey) and DHBcR124EΔ in color: chain A blue, chain B cyan, chain C yellow, chain D red are superposed). The common cores of DHBc and DHBcR124EΔ are virtually indistinguishable with an overall RMSD of 0.6 Å. The G2SG2 linker that replaces the extension domain in DHBcR124EΔ is unresolved.

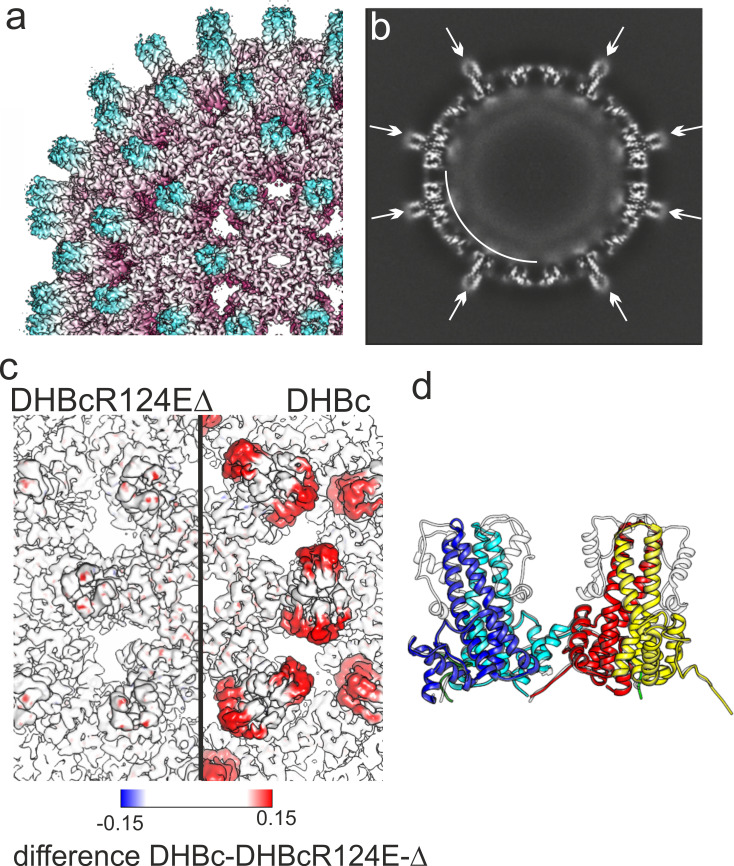
Figure 4.

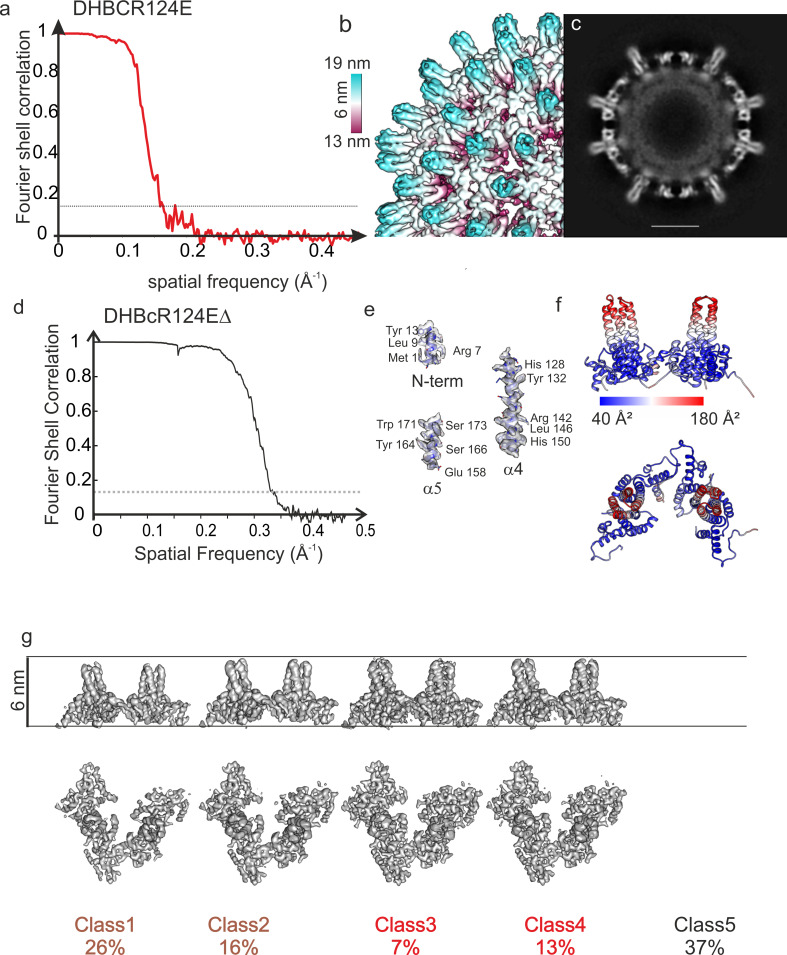
Figure 4—figure supplement 1. Structural characterization of DHBcR124E and DHBcR124EΔ.

Figure 4—figure supplement 1.

(a) Fourier Shell correlation after gold standard refinement of DHBCR124E. The dashed, grey line indicates a Fourier-Shell Correlation of 0.143, which was used as threshold for determining the resolution of 6 Å. (b) Close-up of the surface representation of the image reconstruction of DHBcR124E showing narrow spikes. The surface is colored according to the radius as indicated by the color key. The length of the color key indicates 6 nm. (c) Equatorial slice of the image reconstruction in (b). There is no density visible for the extension domain indicating high flexibility. The scale bar indicates 10 nm. (d) Analysis of DHBcR124EΔ CLPs: Fourier Shell Correlation of CLPs of DHBcR124EΔ after gold standard refinement. The dashed line indicates a FSC of 0.143. The FSC-curve falls below the 0.143 threshold at a spatial frequency of 1/3 Å. (e) Selected areas of the map and model to highlight the quality of the side chain density. (f) Model of DHBcR124EΔ colored with the local B-factors from ADP-refine of Phenix. The color key is given below. The tips of the spikes have much higher B-factors than the rest of the subunit, suggesting high flexibility of the upper part of the helical bundle preceding the G2SG2 linker. (g) Surface representations of 3D-class averages from classification of the asymmetric units. All class averages are represented with the same density threshold. Class number and relative class occupancy are given below. At the chosen threshold Class5 shows no density and is indicative of holes at the respective regular positions in the capsids. Class1 (3.4 Å resolution) and class2 (3.3 Å resolution) are somewhat less dense than class3 (3.2 Å resolution) and class4 (2.9 Å resolution). The radial displacement between the four classes is less than 1 Å.