Abstract
Objective
Infection with Epstein-Barr virus (EBV) has been associated with clinical activity and risk of developing MS. The purpose of this study is to investigate the impact of glatiramer acetate (GA) therapy on EBV-specific immune responses and disease course.
Methods
We characterized EBV-specific CD8 T lymphocytes and B cells during disease-modifying treatments in 2 groups of patients with MS. We designed a 2-pronged approach consisting of a cross-sectional study (39 untreated patients, 38 patients who had undergone 12 months of GA treatment, and 48 healthy donors compatible for age and sex with the patients with MS) and a 12-month longitudinal study (35 patients treated with GA). CD8 EBV-specific T cells and B lymphocytes were studied using pentamers and multiparametric flow cytometry.
Results
We find that treatment with GA enhances viral recognition by inducing an increased number of circulating virus-specific CD8 T cells (p = 0.0043) and by relieving their features of exhaustion (p = 0.0053) and senescence (p < 0.0001, p = 0.0001). B cells, phenotypically and numerically tracked along the 1-year follow-up study, show a steady decrease in memory B-cell frequencies (p = 0.025), paralleled by an increase of the naive B subset.
Conclusion
GA therapy acts as a disease-modifying therapy restoring homeostasis in the immune system, including anti-EBV responses.
Epstein-Barr virus (EBV) is a ubiquitous herpesvirus that persists within B cells in a latency state.1 The infection is usually kept under control by EBV-specific CD8 T lymphocytes, and it has been suggested that the defective control of EBV by T lymphocytes plays a role in the pathogenesis of MS,2,3 a disease in which dysregulation of the immune system leads to demyelination in the CNS.4,5 EBV-infected B cells are also found in ectopic follicles in the meninges of patients with MS but not in other inflammatory neurologic diseases.3,6 However, pathogenic processes linking EBV infection and MS are still unclear.
During several chronic viral infections, virus-specific CD8 T cells become functionally exhausted. These cells are unable to mount their effector activities useful to defeat the infection.7,8 This functional impairment is associated with the expression of inhibitory receptors, which negatively regulate lymphocyte function.9
We have previously shown that disease activity is closely linked to the number of circulating CD8 T cells recognizing either lytic or latent EBV antigens.10 In the present study, we expanded the pentamers' panel used in the previous work, and we extended our investigations to provide a phenotypic and functional characterization of EBV-specific CD8 T cells.
Moreover, recent studies have revealed a substantial role for B cells in MS, which may also involve their interaction with T cells, rather than the sole production of antibodies. Thus, we broadened our study to include the characterization of B cells focusing on their expression of markers of differentiation and on their ability to interact with T cells.
Glatiramer acetate (GA) is a first-line therapeutic against the relapsing-remitting form of MS (RRMS) in which it acts by immunomodulatory mechanisms, which also touch T and B cells, interfering with the disease course.11,12 Here, we show that GA treatment revives antiviral T-cell responses and determines a shift in B-cell phenotypic distribution with an increase of naive and a reduction of memory cells.
Methods
Ethics statement
Peripheral blood samples were collected after obtaining written informed consent from the study participants, in accordance with the Helsinki Declaration. The study protocol was reviewed and approved by the local ethics committees of the recruitment centers, San Camillo-Forlanini Hospital and Sant'Andrea Hospital. Reference number: 2015-000922-12.
Study population and sample preparation
A total of 112 patients with a clinical diagnosis of RRMS established according to the McDonald's criteria (McDonald, 2017) were included in this study. Among these, 38 were treated with GA at 20 mg for at least 1 year (range 1–5 years), and 39 were untreated patients (i.e., free of therapy the time of sampling for at least the previous 6 months). In addition, 35 patients with RRMS were monitored longitudinally for 1 year, and blood was drawn at 3 (T1), 6 (T2), and 12 (T3) months after initiation of GA therapy (40 mg), preceded by 6-month washout from any previous therapy. Patients' characteristics are summarized in table 1. Patients were supervised, both clinically and radiologically with scheduled follow-up every 6 months for at least 1 year to define the state of remission of the disease (no evidence of disease activity [NEDA] patients). Among the 39 untreated patients, 8 patients had evidence of disease activity (EDA patients). EDA were defined both clinically and with MRI in 60% of patients, whereas the remaining 40% were assessed only clinically. The blood was always drawn immediately after ascertaining the clinical symptoms and before steroid treatment. The control group included 48 samples from healthy donors (HDs) matched for age and sex with patients.
Table 1.
Demographic and clinical characteristics of analyzed subjects
Haplotype characterization, pentamer, antibodies, and functional assays
Haplotype characterization was performed as described in supplementary material (links.lww.com/NXI/A301). Phycoerythrin-conjugated Pro5 (MHC) Class I Pentamers loaded with the immunodominant peptides listed in table e-1 (links.lww.com/NXI/A302) were used as described in supplementary material.
To define the phenotypic and functional properties of pentamer+ CD8 T cells and B cells, we used the antibodies listed in supplementary material (links.lww.com/NXI/A301).
The ProMix EBV Peptide Pool (ProImmune, Oxford, United Kingdom), consisting of the 26 peptides listed in table e-2 (links.lww.com/NXI/A303), was used in the functional assay described in supplementary material (links.lww.com/NXI/A301).
Statistical analysis
Statistical analyses for continuous variables were performed using the Student t test. All variables were inspected for normal distribution. p Value summaries of parametric variables were calculated with ordinary 1-way analysis of variance (ANOVA), and the Tukey post hoc test was used for multiple comparisons. Kruskal-Wallis followed by Dunn multiple comparison tests were used for nonparametric variables (GraphPad Prism, v6.2). Differences between categorical variables were evaluated by the Pearson χ2 test. Statistical significance was inferred for p values less than 0.05.
Data availability
Deidentified data can be made available on request.
Results
Prevalence and frequency of virus-specific CD8 T cells
We studied CD8 T cells specific for immunodominant peptides deriving from latent and lytic phases of the viral EBV cycle and restricted by the MHC class I molecules expressed by donors of our cohort, as described in table e-3 (links.lww.com/NXI/A304). As a control, pentamers loaded with peptides derived from the human cytomegalovirus (CMV) pp65 and IE1 proteins were also used.
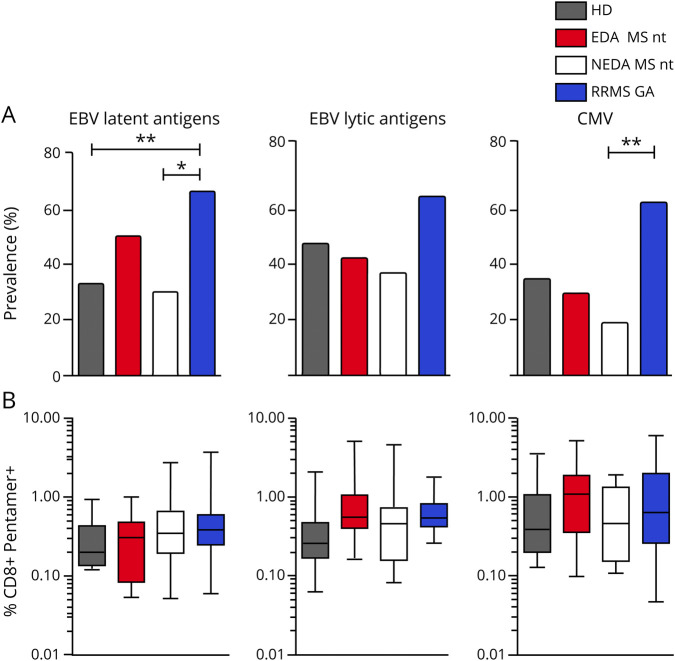
We initially investigated the prevalence of EBV-specific CD8+ T-cell responses in our cohort (figure 1A), namely the proportion of individuals with positive pentamer staining specific for at least 1 EBV epitope.
Figure 1. Prevalence and frequencies of pentamer-positive individuals among patients with MS and in HDs.
(A) The prevalence of individuals positive for pentamers recognizing CD8 T cells specific for latent and lytic EBV antigens as well as for CMV antigens is reported for patients with RRMS without treatment (n = 37, 8 EDA and 29 NEDA), patients with RRMS receiving GA therapy (n = 35), and healthy donors (n = 48). Total bar heights account for the percentage of positive subjects. p Values were calculated with the Pearson χ2 test. (B) Box and whisker plots show the frequencies of CD8 T cells specific for EBV latent (number of subjects: HD = 16, EDA = 4, NEDA = 9, and GA = 23) and lytic (number of subjects: HD = 23, EDA = 3, NEDA = 8, and GA = 14) antigens assessed by the MHC-I pentamer technology. Also, the frequency of CMV-specific lymphocytes is shown (number of subjects: HD = 16, EDA = 2, NEDA = 5, and GA = 19). Patients are stratified according to disease activity and treatment. Boxes indicate interquartile ranges, whereas whiskers indicate total ranges. p Values were calculated with the Kruskal-Wallis nonparametric test and Dunn multiple comparison test. *p < 0.05; **p < 0.01. CMV = cytomegalovirus; EBV = Epstein-Barr virus; EDA = evidence of activity activity; GA = glatiramer acetate; HD = healthy donor; NEDA = no evidence of disease activity; nt = not treated; RRMS = relapsing-remitting MS.
Furthermore, to investigate on the possible correlation between anti-EBV immune response and disease exacerbations, the cohort of untreated patients with RRMS was stratified based on disease activity (EDA and NEDA).
We find that untreated NEDA patients with RRMS are characterized by a lower prevalence in positivity for both EBV latent peptides (p = 0.012) and CMV peptides (p = 0.0026) compared with GA-treated patients, whereas this difference is not statistically significant in the response to proteins expressed during the lytic cycle of the virus. Compared with HDs, more GA-treated patients show detectable antiviral CD8 T cell–mediated recognition of all antigens tested, with a percentage of prevalence for EBV latent antigen significantly higher (p = 0.004). Although this part of the study is limited to cross-sectional measurements, we speculate that GA may improve immunologic reactivity to both EBV and CMV.
The frequency of virus-specific CD8 T cells in the peripheral blood was then compared between GA-treated and untreated patients with RRMS (figure 1B). In this set of analyses, only pentamer+ donors were evaluated. We confirmed that the frequency of CD8 T cells recognizing latent EBV antigens is not significantly different between both treated and untreated patients and HDs, whereas the frequency of CD8 T cells recognizing lytic antigens is higher in untreated EDA patients compared with HDs (p = 0.012). The frequency of EBV-specific CD8 T cells in GA-treated patients is also higher compared with that found in HDs and in untreated NEDA patients, but this difference does not reach statistical significance. Importantly, the frequency of CMV-specific CD8 T cells is comparable in GA-treated or untreated patients and in HDs. These results support the hypothesis that EBV reactivation, and the consequent expansion of CD8 T cells specific for EBV lytic antigens, may play a role in clinical relapses.
GA treatment restores normal features of EBV-specific CD8 T cells
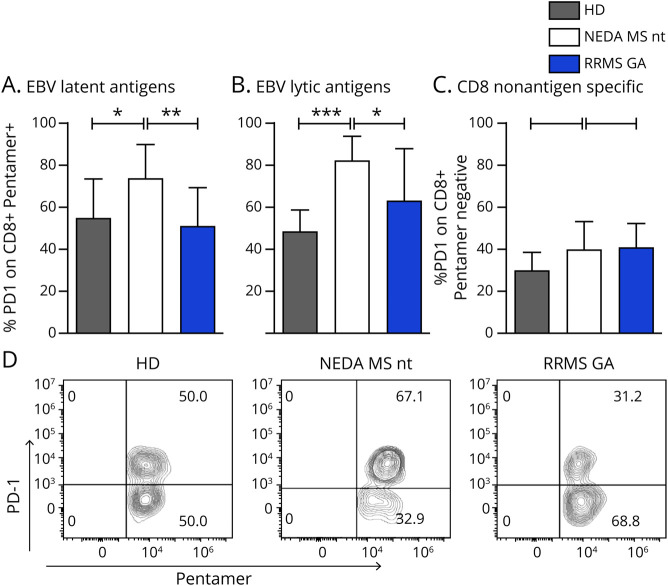
PD-1 expression affects the functionality of antiviral T-cell responses and is upregulated by T cells in some chronic infectious diseases.9 We thus first measured the expression of PD-1 on pentamer+ CD8 T cells in patients with RRMS with or without therapy and in HDs (figure 2). We found that CD8 T cells specific for EBV latent antigens express higher PD-1 levels in untreated NEDA patients with MS compared with HDs and GA-treated patients (figure 2, A and B; p = 0.0042 and p = 0.0005), suggesting that in untreated patients, these cells are at the limit of their functionality, with up to 80% of cells expressing PD-1. Treatment with GA seems to readjust the fraction of exhausted cells to the levels found in HD, although longitudinal analysis on the same patients would provide stronger support to this evidence. Although the number of patients in the EDA group was very low (n = 3), PD-1 expression on CD8 cells specific for lytic antigens is comparable to that found in healthy individuals (figure e-2, A and B, links.lww.com/NXI/A300).
Figure 2. EBV-specific CD8+ T lymphocytes show an exhausted phenotype in untreated patients with MS, which is partially restored by GA treatment.
Frequencies of PD-1+ cells within EBV-specific CD8+ T cells are shown for latent (A) and lytic (B) antigens. PD-1 expression on total CD8+ T cells (C) is shown. Expression of PD-1 was measured in NEDA patients with RRMS without treatment, in patients receiving GA therapy, and in healthy donors. (D) Representative plots relative to 1 HD and 2 patients with MS, untreated or treated with glatiramer acetate. Data for T CD3+CD8+ pentamer + T cells are shown. Mean values and SDs (error bars) are represented. p Values were calculated with the ANOVA and Tukey multiple comparison test. *p < 0.05; **p < 0.01; ***p < 0.001. ANOVA = analysis of variance; EBV = Epstein-Barr virus; GA = glatiramer acetate; HD = healthy donor; NEDA = no evidence of disease activity; nt = not treated; RRMS = relapsing-remitting MS.
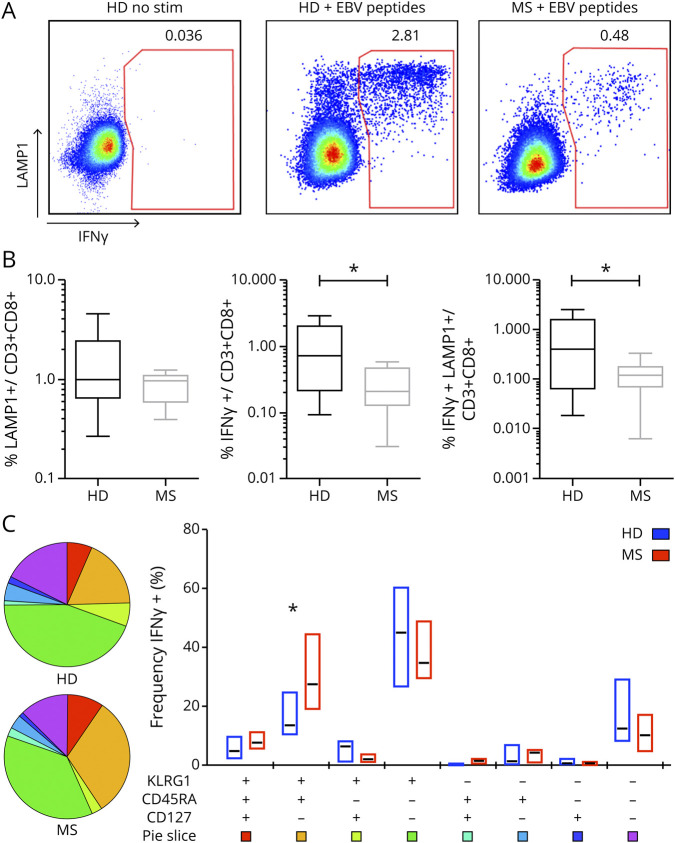
PD-1 expression in the general CD8 T-cell population was comparable in all groups (figure 2C). We next asked whether this exhausted phenotypic trait was mirrored by a dysfunctional response to EBV antigens. To address this issue, we measured in vitro the reactivity of CD8 T cells from HDs and untreated patients with MS to a pool of 26 immunodominant human leukocyte antigen-I–restricted EBV peptides. As read-outs, we measured intracellular production of interferon (IFN)-γ coupled with the measurement of degranulation (assessed by lysosomal-associated membrane protein 1 [LAMP-1] staining) and with the phenotypic characterization of EBV-responsive CD8 T cells (figure 3).
Figure 3. Phenotypic and functional characterization of EBV-specific CD8 T cells.
The frequency of degranulating (i.e., LAMP-1+) and IFNγ-producing (i.e., IFNγ+) CD8 T cells after 18 hours of in vitro stimulation with a mixture of 26 MHC-I restricted EBV peptides was measured by flow cytometry. (A) Pseudocolor plots show the expression of LAMP-1 and IFNγ on total CD8 T cells in 1 representative stimulated and unstimulated HD and 1 representative stimulated patient with RRMS. (B) Frequencies of CD8+ T cells producing IFNγ or LAMP-1 alone or both are compiled and graphed for 10 HDs and 9 untreated patients with RRMS tested. p Values were calculated with the t test. (C) Pie charts and box plots portray the distribution of KLRG1, CD45RA, and CD127 molecules among EBV-responsive, IFNγ+ CD8+ T cells. IFNγ+ cells, successively gated for the 3 markers, are phenotypically inspected by Boolean/combinatorial analysis. In the pie charts, the area of each slice indicates the relative representation of each one of the 8 combinatorial subsets obtained, whereas the same results are conveyed as medians (black lines) with interquartile ranges (boxes) in the adjacent box plot. p Values were calculated with the Wilcoxon rank test. *p < 0.05. EBV = Epstein-Barr virus; GA = glatiramer acetate; HD = healthy donor; IFN = interferon; KLRG1 = killer cell lectin-like receptor G1; LAMP = lysosomal-associated membrane protein 1; NEDA = no evidence of disease activity; RRMS = relapsing-remitting MS; stim = stimulation.
Peptide stimulation induced measurable production of IFNγ and exocytosis of lytic granules from all tested donors (figure 3, A and B). However, although the surface display of LAMP-1 between HDs and untreated patients with RRMS is comparable in the 2 groups (1.52% ± 0.8% vs 1.38% ± 0.3%), the latter show reduced production of IFN-γ compared with HDs (0.27% ± 0.19% vs 1.15% ± 1.02%; p = 0.0222), together with a reduced fraction of double-positive IFNγ+ LAMP+ CD8 T cells (0.76% ± 0.6% vs 0.13% ± 0.09%; p = 0.046). Thus, although in healthy individuals, direct cytotoxicity is strictly correlated with IFN-γ production, these 2 effector processes seem to be disjoined in MS.
IFNγ + CD8 T cells were analyzed for the expression of CD127, CD45RA, and killer cell lectin-like receptor G1 (KLRG1) (figure 3C). The data show that the KLRG1+CD45RA+ CD127-subpopulation, representing cytotoxic/terminally differentiated and senescent cells,13 is more represented in patients with RRMS compared with HDs (p = 0.0164).
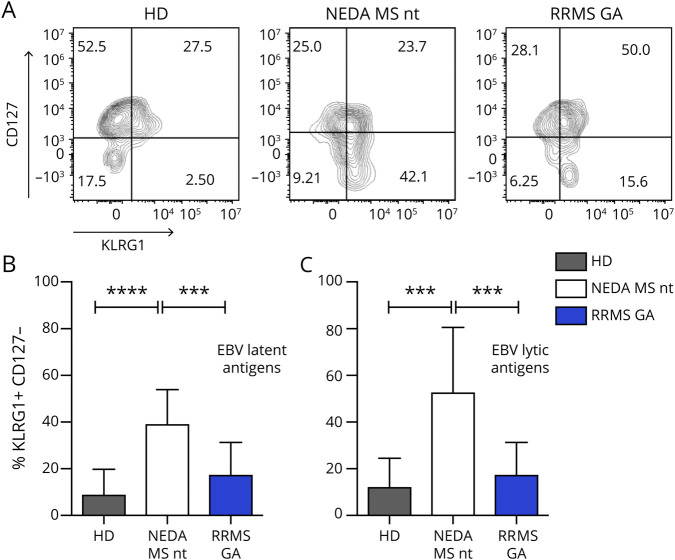
We confirmed this finding also in the pentamer experimental setup, by showing that the senescent phenotype of EBV-reactive (i.e., IFNγ+) cells may be present also in nonactivated pentamer+ lymphocytes (figure 4 and figure e-1, C and D, links.lww.com/NXI/A299). We find that in untreated patients with RRMS, a significant fraction of CD8+ cells specific for both latent and lytic EBV antigens are CD127- KLRG1+, the phenotype that identifies senescent cells. This phenotype completely reversed in GA-treated patients (figure 4, B and C; p < 0.0001). This, together with the data on PD-1 expression, points to a possible positive effect of GA therapy on the anti-EBV T-cell response.
Figure 4. GA decreases the fraction of senescent EBV-specific CD8+ T lymphocytes.
Patients' and healthy donors' cells were labeled with CD3, CD8, pentamers, KLRG1, and CD127 and analyzed by flow cytometry. (A) Representative plots showing the KLRG1/CD127 expression pattern in pentamer + CD8 T cells from 1 HD, 1 untreated NEDA patient with MS, and 1 GA-treated patient with RRMS. Senescent cells are defined as CD127- KLRG1+. (B and C) Cumulative data relative to senescent cells. Mean values and SDs (error bars) are conveyed. p Values were calculated with the ANOVA and Tukey multiple comparison test. ***p < 0.001; ****p < 0.000. ANOVA = analysis of variance; EBV = Epstein-Barr virus; GA = glatiramer acetate; HD = healthy donor; KLRG1 = killer cell lectin-like receptor G1; NEDA = no evidence of disease activity; nt = not treated; RRMS = relapsing-remitting MS.
Phenotypic characterization of B cells during GA therapy
We next asked whether the therapy also modulates B cells, which are the direct targets of EBV and whose role in MS is underscored by the successful B cell–depleting therapeutic approaches; in addition, recent data in the literature suggest that this drug modulates B-cell function and activity.14,15
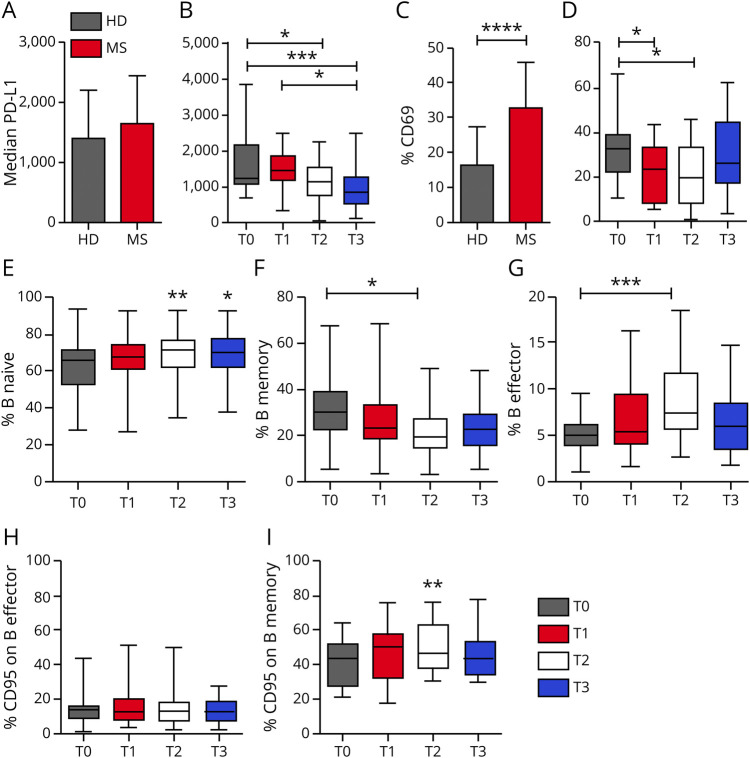
We monitored a group of patients before and after 3 (T1), 6 (T2), and 12 months (T3) of GA therapy. The absolute B-cell count shows no significant changes at all time points (data not shown). The ligand of PD-1, PD-L1, is equally expressed on B lymphocytes from patients before GA treatment and HD (figure 5A and figure e-2, links.lww.com/NXI/A300). However, treatment with GA gradually and significantly reduces PD-L1 expression on B lymphocytes after 6 months (T2) and 12 months (T3) of therapy (figure 5B; p = 0.0003). At the same time points, B-cell activation is also modulated: before treatment, a significantly higher fraction of B cells from patients express CD69 compared with HDs (figure 5C; p < 0.0001); after 3 and 6 months of GA therapy (p = 0.0087), however, there is a significant reduction of CD69 expression (figure 5D), particularly affecting the subsets of the memory and effector memory B cells (data not shown). We also noticed an increase in CD25 expression, which, however, does not reach statistical significance in any subpopulation of B cells (figure e-2), altogether indicating a lower level of activation of B cells during GA treatment.
Figure 5. Phenotypic characterization of B cells during GA therapy.
Surface density of PD-L1 on B lymphocytes, measured by median fluorescence intensity, is reported for HDs and patients with RRMS before commencing GA therapy (A, mean values and SDs are indicated) and throughout a 1-year-long longitudinal study (B). Baseline levels were compared with those obtained in samples taken at 3 (T1), 6 (T2), and 12 (T3) months of GA therapy. (C) Cumulative data on the percentage of CD69+ B cells in patients with MS at baseline and HDs. (D) The same measurement as in C (mean values and SDs are indicated) in the follow-up study. Cumulative data are reported for the percentage of naive B cells (E), memory B cells (F), and effector B cells (G) at 3 (T1), 6 (T2), and 12 (T3) months of GA therapy. The percentage of CD95/FAS+ cells among total B cells and among memory B cells of treated patients with MS is reported in (H) and (I), respectively. In the follow-up study, boxes indicate interquartile ranges, whereas whiskers indicate total ranges. (A, C, E, and I) p Values were calculated with the Student t test. (B, D, F, and G) p Values were calculated with the ANOVA and Tukey multiple comparison test. *p < 0.05; **p < 0.01; ***p < 0.001; ****p < 0.000. ANOVA = analysis of variance; GA = glatiramer acetate; HD = healthy donor; RRMS = relapsing-remitting MS.
We next asked whether GA directly modulates the expression of these receptors on preexisting cells or whether it induces modifications in the overall composition of B cells. To answer this question, we monitored the percentages of naive, memory, and effector B cells during therapy (figure 5, E–G), and we measured the frequency of B cells expressing the proapoptotic molecule FAS/CD95 (figure 5, H and I and figure e-2, links.lww.com/NXI/A300). The results show that along with a decrease in PD-L1 and CD69 expression on B cells, there is also a strong decrease of memory B cells (figure 5F; p = 0.025), paralleled by a significant increase of effector memory B cells (figure 5G; p = 0.015). The naive B-cell subset, on the other hand, tends to increase during treatment with GA, but this increase does not reach statistical significance using ANOVA, whereas it results significant with a Student t test (figure 5E; T0 vs T2 p = 0.003; T0 vs T3 p = 0.0148). Moreover, the expression of FAS, which appears not to be modulated by GA therapy in total B cells (figure 5H), is upregulated on the memory B cell subset at 6 months (T2) (figure 5I; Student t test p = 0.0049) and decreases thereafter.
The longitudinal study of the B-cell phenotype in HDs and in untreated patients was not performed, unfortunately. This could have ruled out the possibility that the modulation of the receptors is due to time rather than to therapy; however, our finding that all these changes occur together after 6 months of therapy (T2) suggests that treatment with GA has an effect also on the B-cell compartment.
Discussion
EBV infection is usually kept in check by virus-specific lymphocytes, and here, we show that in patients with MS, these cells have features of exhaustion and are defective in their cytotoxic machinery. Thus, they may fail to effectively control EBV-infected autoreactive B cells, which might then accumulate in the CNS. Moreover, we show that GA, commonly used in the treatment of the disease, modulates antiviral immune responses, including the response against EBV infection, and we hypothesize that it favors the conditions for effective control of viral infection through a positive action on EBV-specific CD8 T cells. In GA-treated patients, these cells are found in over 60% of patients, and they show reduced levels of PD-1 and KLRG1 expression, indicating that the cellular effectors of the EBV-specific response are up and running. On the contrary, untreated patients are consistently the group with the lowest prevalence for antiviral positivity, and the positive patients have a significantly higher quota of antigen-specific T cells expressing markers of exhaustion (PD-1) or senescence (KLRG1) compared with both HDs and GA-treated patients.
All patients undergoing treatment with GA experienced disease stability, as evaluated both clinically and radiologically, supporting a role for effective EBV-specific T cells in the maintenance of immune homeostasis. In this study, we did not measure markers of EBV reactivation, but we and others have shown that CD8+ EBV-specific T cells are present in active brain lesions of patients with MS, where antigens of the lytic activity are also detected.10,16 Thus, it is conceivable that during disease activity, EBV reactivation is taking place, finding a weakened and senescent antigen-specific T-cell population, which is unable to contrast the viral infection.
Functional data showed that EBV-specific T cells from untreated patients display signs of exhaustion and senescence, with low IFNγ production and reduced cytotoxic degranulation compared with healthy donors, whereas B cells on the contrary are significantly activated.
T-cell exhaustion has been shown to underlie T-cell dysfunction in chronic viral infections,17 including HIV.18 Exhausted virus-specific T cells show reduced proliferative potential and cytokine production, and this immunologic feebleness may favor viral persistence.19 In viral infection and tumors, a crucial marker that correlates with exhaustion is PD-1.9 We found a high expression of this marker on EBV-specific CD8 T cells and a concomitant high expression of its ligand, PD-L1, on B cells of untreated patients with RRMS. This state of immune breakdown, however, seems to be opposed by the action of GA because patients undergoing treatment show both a decrease in PD-1 expression levels on virus-specific CD8 T cells and a decrease in the expression of PD-L1 on B cells.
Lymphocytes' senescence involves the reduced ability to respond to new antigens and in general to support an effective immune response.20,21 Immunosenescence is due to the general aging of the organism, to the overall history of antigenic exposure, to the infectious load, and above all to chronic or latent infections, which engage antigen-specific cells in a never-ending battle. Immunosenescent cells can be identified through the combined evaluation of the expression KLRG1, an inhibitory receptor expressed on natural killer cells and on terminally differentiated T lymphocytes, and CD127 (interleukin-7 receptor).13 We find that patients treated with GA show a clear decrease in the fraction of senescent EBV-specific CD8+ T lymphocytes compared with untreated patients, suggesting that this treatment could revive or at least protect the antiviral immune response by reducing T-cell exhaustion.
Several studies in MS and in its animal model, experimental autoimmune encephalomyelitis, suggest that GA treatment is associated with an immunomodulatory effect acting broadly on cells of both the innate and adaptive immune system. For instance, GA therapy reduces the fraction of activated CD8+ T cells,22 remodels the composition of the B- and T-cell compartment, and influences cytokine secretion and immunoglobulin production following modulation of antigen-presenting cells' functions.23–25 Our data show that after treatment, there are clear changes within the B-cell subset: naive B cells increase as opposed to memory B cells, and this occurrence is preceded by the expression on the FAS receptor on memory B cells. FAS is expressed by activated lymphocytes and induces apoptosis through activation-induced cell death. This process is thought to limit lymphocyte expansion and to eliminate anergic and autoreactive cells. Thus, the decreased frequency of potentially infected B cells, which continuously stimulate EBV-specific CD8 T lymphocytes, may affect also this cell compartment.
In conclusion, the results of the present study confirm that GA therapy acts as a disease-modifying therapy restoring homeostasis in the immune system, including anti-EBV responses. Suppression of inflammation is the most frequent mechanism of action of disease-modifying drugs in MS, but this can potentially lead also to unwanted suppression of antiviral immunity, which could then expose the patient to infection. Given the increased number of circulating virus-specific CD8 T cells and their decreased features of exhaustion and senescence, coupled with the increase of the fraction of naive B cells, it is possible that GA is safe also for use in patients with MS who have a proven viral infection.26
Glossary
- ANOVA
analysis of variance
- CMV
cytomegalovirus
- EBV
Epstein-Barr virus
- EDA
evidence of disease activity
- GA
glatiramer acetate
- HD
healthy donor
- IFN
interferon
- KLRG1
killer cell lectin-like receptor G1
- LAMP
lysosomal-associated membrane protein 1
- NEDA
no evidence of disease activity
- RRMS
relapsing-remitting MS
Appendix. Authors
Study funding
The work was partially supported by a grant from TEVA Italia s.r.l. (Teva 0211212014), from the Italian Ministry of Health (Progetto di ricerca Finalizzata RF-2018-12366111), and from the Italian Foundation for Multiple Sclerosis (FISM Progetto Speciale 2018/S/5) to L. Battistini.
Disclosure
G. Guerrera declared no potential conflicts of interest with respect to the research, authorship, and/or publication of this article. S. Ruggieri has received fee as speaking honoraria from Teva, Merck Serono, and Biogen; travel grant from Biogen and Merck Serono; and fee as advisory board consultant from Merck Serono and Novartis. M. Picozza, E. Piras, F. Gargano, and R. Placido declared no potential conflicts of interest with respect to the research, authorship, and/or publication of this article. C. Gasperini has served on advisory boards and/or has received travel grants and/or speaker honoraria from Merck Serono, Roche, Teva Italia, Biogen, Almirall, Novartis, and Sanofi-Genzyme. M. Salvetti received research support and speaking honoraria from Biogen, Merck, Novartis, Roche, and Sanofi. M.C. Buscarinu declared no potential conflicts of interest with respect to the research, authorship, and/or publication of this article. L. Battistini received research support and speaking honoraria from Baxter, Merck, Novartis, Roche, and Sanofi. G. Borsellino and D.F. Angelini declared no potential conflicts of interest with respect to the research, authorship, and/or publication of this article. Go to Neurology.org/NN for full disclosures.
References
- 1.Hadinoto V, Shapiro M, Greenough TC, Sullivan JL, Luzuriaga K, Thorley-Lawson DA. On the dynamics of acute EBV infection and the pathogenesis of infectious mononucleosis. Blood 2008;111:1420–1427. [DOI] [PMC free article] [PubMed] [Google Scholar]
- 2.Lucas RM, Hughes AM, Lay ML, et al. Epstein-Barr virus and multiple sclerosis. J Neurol Neurosurg Psychiatry 2011;82:1142–1148. [DOI] [PubMed] [Google Scholar]
- 3.Serafini B, Rosicarelli B, Franciotta D, et al. Dysregulated Epstein-Barr virus infection in the multiple sclerosis brain. J Exp Med 2007;204:2899–2912. [DOI] [PMC free article] [PubMed] [Google Scholar]
- 4.Dendrou CA, Fugger L, Friese MA. Immunopathology of multiple sclerosis. Nat Rev Immunol 2015;15:545–558. [DOI] [PubMed] [Google Scholar]
- 5.Jakimovski D, Ramanathan M, Weinstock-Guttman B, et al. Higher EBV response is associated with more severe gray matter and lesion pathology in relapsing multiple sclerosis patients: a case-controlled magnetization transfer ratio study. Mult Scler 2020;26:322–332. [DOI] [PMC free article] [PubMed] [Google Scholar]
- 6.Serafini B, Muzio L, Rosicarelli B, Aloisi F. Radioactive in situ hybridization for Epstein-Barr virus-encoded small RNA supports presence of Epstein-Barr virus in the multiple sclerosis brain. Brain 2013;136(pt 7):e233. [DOI] [PubMed] [Google Scholar]
- 7.Shin H, Wherry EJ. CD8 T cell dysfunction during chronic viral infection. Curr Opin Immunol 2007;19:408–415. [DOI] [PubMed] [Google Scholar]
- 8.Wherry EJ. T cell exhaustion. Nat Immunol 2011;12:492–499. [DOI] [PubMed] [Google Scholar]
- 9.Sharpe AH, Wherry EJ, Ahmed R, Freeman GJ. The function of programmed cell death 1 and its ligands in regulating autoimmunity and infection. Nat Immunol 2007;8:239–245. [DOI] [PubMed] [Google Scholar]
- 10.Angelini DF, Serafini B, Piras E, et al. Increased CD8+ T cell response to Epstein-Barr virus lytic antigens in the active phase of multiple sclerosis. PLoS Pathog 2013;9:e1003220. [DOI] [PMC free article] [PubMed] [Google Scholar]
- 11.Fogarty E, Schmitz S, Tubridy N, Walsh C, Barry M. Comparative efficacy of disease-modifying therapies for patients with relapsing remitting multiple sclerosis: systematic review and network meta-analysis. Mult Scler Relat Disord 2016;9:23–30. [DOI] [PubMed] [Google Scholar]
- 12.Weber MS, Hohlfeld R, Zamvil SS. Mechanism of action of glatiramer acetate in treatment of multiple sclerosis. Neurotherapeutics 2007;44:647–653. [DOI] [PMC free article] [PubMed] [Google Scholar]
- 13.Stelekati E, Shin H, Doering TA, et al. Bystander chronic infection negatively impacts development of CD8(+) T cell memory. Immunity 2014;40:801–813. [DOI] [PMC free article] [PubMed] [Google Scholar]
- 14.Kuerten S, Jackson LJ, Kaye J, Vollmer TL. Impact of glatiramer acetate on B cell-mediated pathogenesis of multiple sclerosis. CNS Drugs 2018;32:1039–1051. [DOI] [PMC free article] [PubMed] [Google Scholar]
- 15.Häusler D, Hajiyeva Z, Traub JW, et al. Glatiramer acetate immune modulates B-cell antigen presentation in treatment of MS. Neurol Neuroimmunol Neuroinflamm 2020;7:e698. [DOI] [PMC free article] [PubMed] [Google Scholar]
- 16.Serafini B, Rosicarelli B, Veroni C, Mazzola GA, Aloisi F. Epstein-barr virus-specific CD8 T cells selectively infiltrate the brain in multiple sclerosis and interact locally with virus-infected cells: clue for a virus-driven immunopathological mechanism. J Virol 2019;93:e00980–19. [DOI] [PMC free article] [PubMed] [Google Scholar]
- 17.Wherry EJ, Ha SJ, Kaech SM, et al. Molecular signature of CD8+ T cell exhaustion during chronic viral infection. Immunity 2007;27:670–684. [DOI] [PubMed] [Google Scholar]
- 18.Khaitan A, Unutmaz D. Revisiting immune exhaustion during HIV infection. Curr HIV/AIDS Rep 2011;8:4–11. [DOI] [PMC free article] [PubMed] [Google Scholar]
- 19.Zajac AJ, Blattman JN, Murali-Krishna K, et al. Viral immune evasion due to persistence of activated T cells without effector function. J Exp Med 1998;188:2205–2213. [DOI] [PMC free article] [PubMed] [Google Scholar]
- 20.Akbar AN, Henson SM. Are senescence and exhaustion intertwined or unrelated processes that compromise immunity? Nat Rev Immunol 2011;11:289–295. [DOI] [PubMed] [Google Scholar]
- 21.Arnold CR, Wolf J, Brunner S, Herndler-Brandstetter D, Grubeck-Loebenstein B. Gain and loss of T cell subsets in old age: age-related reshaping of the T cell repertoire. J Clin Immunol 2011;31:137–146. [DOI] [PubMed] [Google Scholar]
- 22.González-Oria MC, Márquez-Coello M, Girón-Ortega JA, Argente J, Moya M, Girón-González JA. Monocyte and lymphocyte activation and regulation in multiple sclerosis patients. Therapy effects. J Neuroimmune Pharmacol 2019;14:413–422. [DOI] [PubMed] [Google Scholar]
- 23.Ireland SJ, Guzman AA, O'Brien DE, et al. The effect of glatiramer acetate therapy on functional properties of B cells from patients with relapsing-remitting multiple sclerosis. JAMA Neurol 2014;71:1421–1428. [DOI] [PMC free article] [PubMed] [Google Scholar]
- 24.Praksova P, Stourac P, Bednarik J, Vlckova E, Mikulkova Z, Michalek J. Immunoregulatory T cells in multiple sclerosis and the effect of interferon beta and glatiramer acetate treatment on T cell subpopulations. J Neurol Sci 2012;319:18–23. [DOI] [PubMed] [Google Scholar]
- 25.Lalive PH, Neuhaus O, Benkhoucha M, et al. Glatiramer acetate in the treatment of multiple sclerosis: emerging concepts regarding its mechanism of action. CNS Drugs 2011;25:401–414. [DOI] [PMC free article] [PubMed] [Google Scholar]
- 26.Omura S, Sato F, Martinez NE, et al. Immunoregulation of Theiler's virus-induced demyelinating disease by glatiramer acetate without suppression of antiviral immune responses. Arch Virol 2018;163:1279–1284. [DOI] [PMC free article] [PubMed] [Google Scholar]
Associated Data
This section collects any data citations, data availability statements, or supplementary materials included in this article.
Data Availability Statement
Deidentified data can be made available on request.


