Abstract
Objective
To investigate sex differences in late-onset Alzheimer disease (AD) risks by means of multimodality brain biomarkers (β-amyloid load via 11C-Pittsburgh compound B [PiB] PET, neurodegeneration via 18F-fluorodeoxyglucose [FDG] PET and structural MRI).
Methods
We examined 121 cognitively normal participants (85 women and 36 men) 40 to 65 years of age with clinical, laboratory, neuropsychological, lifestyle, MRI, FDG- and PiB-PET examinations. Several clinical (e.g., age, education, APOE status, family history), medical (e.g., depression, diabetes mellitus, hyperlipidemia), hormonal (e.g., thyroid disease, menopause), and lifestyle AD risk factors (e.g., smoking, diet, exercise, intellectual activity) were assessed. Statistical parametric mapping and least absolute shrinkage and selection operator regressions were used to compare AD biomarkers between men and women and to identify the risk factors associated with sex-related differences.
Results
Groups were comparable on clinical and cognitive measures. After adjustment for each modality-specific confounders, the female group showed higher PiB β-amyloid deposition, lower FDG glucose metabolism, and lower MRI gray and white matter volumes compared to the male group (p < 0.05, family-wise error corrected for multiple comparisons). The male group did not show biomarker abnormalities compared to the female group. Results were independent of age and remained significant with the use of age-matched groups. Second to female sex, menopausal status was the predictor most consistently and strongly associated with the observed brain biomarker differences, followed by hormone therapy, hysterectomy status, and thyroid disease.
Conclusion
Hormonal risk factors, in particular menopause, predict AD endophenotype in middle-aged women. These findings suggest that the window of opportunity for AD preventive interventions in women is early in the endocrine aging process.
After advanced age, female sex is the major risk factor for late-onset Alzheimer disease (AD),1 the most common form of dementia, affecting 46 million people worldwide. While AD is not unique to women, women constitute roughly two-thirds of patients living with AD dementia, with postmenopausal women accounting for >60% of all those affected.2
While previously the 2:1 ratio was attributed to women's longer life expectancy relative to men, several emerging lines of evidence point to sex- and gender-specific AD risk factors rather than lifespan.3,4 Recent studies have identified >30 AD risk factors that affect the sexes differently, with female sex being more severely affected.3-5 These include chiefly genetic (e.g., family history, APOE genotype), medical (e.g., depression, stroke, diabetes mellitus), hormonal (e.g., menopause, thyroid disease), and lifestyle (e.g., smoking, diet, exercise, intellectual activity) risks.
Because many of these AD risk factors are modifiable, population-attributable risk models estimate that 1 in every 3 AD cases may be preventable, especially if addressed in midlife.6 The prodromal phase of AD typically corresponds to midlife years, during which the opportunity for disease modification is greatest.7 Identification of sex-specific risks is therefore pivotal in the development of targeted AD risk reduction strategies.
However, no studies have examined how sex-specific risks affect AD-related brain changes in midlife and which are most impactful. Brain biomarkers are crucial to this aim because there is extensive evidence that they can detect presence of AD decades before clinical symptoms.8
This multimodality neuroimaging study aimed to characterize the sex-dependent emergence of an AD endophenotype in cognitively normal middle-aged women and men by means of well-established AD biomarkers (β-amyloid [Aβ] on 11C-Pittsburgh compound B [PiB] PET, neurodegeneration via glucose metabolism on 18F-fluorodeoxyglucose [FDG] PET, gray matter volume [GMV] and white matter volume [WMV] on MRI)8 and to identify the risk factors associated with sex-related AD biomarker differences.
Methods
Participants
Study participants were derived from brain imaging studies conducted at Weill Cornell Medical College and New York University School of Medicine between 2014 and 2019. These studies aimed at examining risk factors for AD among clinically and cognitively normal adults, as previously described.9–11 Participants were derived from multiple community sources, including individuals interested in research participation and family members and caregivers of impaired participants.
Only participants with clinical, neuropsychological, laboratory, and lifestyle examinations and brain imaging, including volumetric MRI, FDG, and PiB-PET, were examined. At baseline, participants were required to be 40 to 65 years old with ≥12 years of education, Clinical Dementia Rating score of 0, Mini-Mental State Examination score ≥27, and normal cognitive test performance for age and education. The patients' sex was determined by self-report. Participants were given the option of indicating whether they were male, female, or other. None of our participants self-identified as other.
Participants were excluded in case of medical conditions or history of conditions that may affect brain structure or function (e.g., stroke, any neurodegenerative diseases, hydrocephalus, intracranial mass, and infarcts on MRI), unstable medical conditions (e.g., unstable heart disease, unmanaged diabetes mellitus, cancer), alcohol abuse, or specific medications (e.g., benzodiazepines, cholinesterase inhibitors, psychostimulants, cancer chemotherapy).
Standard protocol approvals, registrations, and patient consents
All participants provided informed consent to participate in these Weill Cornell Medical College and New York University institutional review board–approved studies.
Cognitive measures
All participants received neuropsychological evaluations testing memory function, attention, and language, as described.11 Briefly, 3 cognitive domains were assessed from the following tests: memory (immediate and delayed recall of a paragraph and paired associates), higher-order processing (Wechsler Adult Intelligence Scale Digit Symbol and Block Design tests), and language (Wechsler Adult Intelligence Scale Vocabulary and Object Naming). These measures were adjusted by age and education.
Genetic risk factors
A family history of late-onset AD was elicited with standardized questionnaires.9 APOE genotype was determined with standard quantitative PCR procedures.9
Medical risk factors
We examined several vascular risk-related measures, thyroid function, and presence of depression. Vascular-risk measures included:
Abdominal obesity: waist circumference to height ratios
Hypertension: conservatively based on either current antihypertensive treatment or blood pressure assessments
Hyperlipidemia: serum triglyceride levels and total cholesterol to high-density lipoprotein (HDL) ratios
Insulin resistance: Quantitative Insulin Sensitivity Check Index12 derived from fasting plasma insulin and fasting plasma glucose
Diagnosis of type 2 diabetes mellitus: fasting glucose level >126 mg/dL or hemoglobin A1c ≥6.5%.
Thyroid dysfunction was evaluated through a comprehensive review of the patient's medical and family histories, results of physical examination, and laboratory findings, which included an assessment of levels of thyroid hormones.
Participants were screened for depression through a clinical interview administered by the study physician and via the Hamilton test or the Patient-Reported Outcomes Measurement Information System depression measure.13
Hormonal risk factors
Determination of menopausal status was based on the Stages of Reproductive Aging Workshop criteria,14 as previously described.9 Cluster symptoms included presence of sweatiness, hot flashes, mood swings, insomnia, appetite changes, loss of libido, cognitive problems, poor concentration, and short-term memory complaints. On the basis of these assessments, female participants were classified as premenopausal, perimenopausal, and postmenopausal according to clinical judgment.
Lifestyle risk factors
We examined smoking, diet, exercise, and intellectual activity.
Participants' smoking status was obtained through the validated Australian National University Alzheimer's Disease Risk Index scale13 (self-reported as never smoked, current smoker, or former smoker).
Because a large body of evidence has linked higher adherence to a Mediterranean-style diet with lower risk of cognitive decline and dementia,15 we evaluated Mediterranean-style diet adherence for all participants, as described.16 Briefly, we used the Harvard food frequency questionnaire to calculate the average intake for several nutrients and food groups, regressed for caloric intake. We then assigned a value of 1 for each of the following factors: a beneficial food group with an intake that was equal to or above the sex-specific median; each detrimental food group with a consumption below the sex-specific median; a monounsaturated/saturated fat ratio above the sex-specific median; and mild alcohol intake. Mediterranean-style diet scores were used to dichotomize participants into higher vs lower adherence groups.16
We used the Minnesota Leisure Time Physical Activity questionnaire to characterize current physical activity levels.17 For each type of activity, information was collected on the frequency and duration of engagement, which was multiplied by an activity-specific intensity code indicating calorie expenditure. The summed activity-dependent scores were used to dichotomize participants into higher vs lower activity groups.16
Intellectual activity throughout life was assessed with a validated 25-item interview in which participants were asked to report how often they engaged in common cognitively demanding activities with minimal dependence on socioeconomic status such as reading books or newspapers, writing letters or e-mails, going to the library, and playing games, at different ages.18 The summed activity-dependent scores were used to dichotomize participants into higher vs lower activity groups.16
Brain imaging
All participants received 3T volumetric T1–magnetization-prepared rapid gradient-echo scan, and FDG- and PiB-PET scans acquired with PET/CT scanners operating in 3D mode, following standardized procedures.9–11 Image analysis was performed using a fully automated image processing pipeline, as previously described.9–11 For each patient, FDG and PiB scans were coregistered to the corresponding baseline MRI and to each other using the Normalized Mutual Information routine of Statistical Parametric Mapping (SPM12; University College London, UK).19 MRI scans were segmented and normalized to the template space by high-dimensional warping (DARTEL) and voxel-based morphometry.19 Jacobian modulation was applied to restore GMV and WMV in the images, which were smoothed with an 8-mm full width at half-maximum kernel.19 MRI-coregistered PET scans were spatially normalized with participant-specific transformation matrices obtained from MRI and smoothed with a 10-mm full width at half-maximum filter.
Statistics
Analyses were performed in SPM12 and R 3.5.2 (R Foundation for Statistical Computing, Vienna, Austria) with the GLMNET package. Clinical, demographic, and cognitive measures were examined with t tests or χ2 tests at p < 0.05.
We conducted 2 analyses to examine the associations of AD risk factors with AD biomarkers by sex, as discussed below. First, we identified the brain regions showing biomarker differences between sex groups. Second, we performed regression analyses to identify which AD risk factors predicted the sex-driven biomarker differences.
Step 1: Brain biomarker differences by sex
In this analysis, we first used SPM12 to perform voxel-wise comparisons of AD biomarkers between sex groups, including GMV and WMV (MRI), amyloid deposition (PiB-PET), and glucose metabolism (FDG-PET). Full factorial models with post hoc t contrasts were used to test for regional differences in MRI, PiB, and FDG measures between male and female groups, with adjustment for age and modality-specific confounders: PiB uptake was normalized by cerebellar gray matter uptake, FDG uptake by the global activity, and MRI volumes by total intracranial volume.9–11
Second, the above analyses were repeated using age- and size-matched groups. This was done by matching the 36 men in the cohort to 36 women of the same age ±1 year and chosen consecutively in order of scan date.
All results were conservatively examined at p < 0.05, corrected for family-wise error (FWE), and with cluster extent ≥50 voxels. Anatomic location of brain regions showing significant group effects was described with Montreal Neurologic Institute coordinates. These data are available from Dryad (tables 3–5, doi.org/10.5061/dryad.zgmsbcc6g).
Lastly, biomarker measures from the brain regions showing significant group effects were extracted from each SPM cluster and examined for associations with AD risk factors in the regression analysis below.
Step 2: Associations between AD risk factors and sex-driven biomarker differences
We used the biomarker measures extracted in step 1 and LASSO (least absolute shrinkage and selection operator) regressions to identify which clinical variables were most predictive of the observed sex differences in brain AD biomarkers. The LASSO regression method retains only a subset of predictors to enhance the prediction accuracy and interpretability of the statistical model it produces.20 The algorithm minimizes the sum of squared errors while penalizing estimates with large absolute values of the coefficients. We cross-validated our models 10 times and chose final models that yielded the lowest minimum cross-validated error. Performing LASSO regressions on several covariates allows us to develop hypotheses and pursue predictors that are selected with the highest frequency and in the highest magnitudes for future studies. Therefore, this analysis allowed us to determine which of the clinical variables listed below were the strongest predictors of the sex-driven biomarker differences detected in step 1.
Variables examined as potential predictors included age (years), education (years), AD family history (positive vs negative), APOE ε4 status (carriers vs noncarriers), history of depression (yes vs no), diabetes mellitus (yes vs no), hypertension (yes vs no), thyroid disease (yes vs no), menopausal status (premenopausal, perimenopausal, or postmenopausal), hormonal replacement therapy (HRT) status (user vs nonuser), hysterectomy status (yes vs no), plasma cholesterol/HDL (unitless), plasma homocysteine (mmol/L), Quantitative Insulin Sensitivity Check Index scores, waist/height (unitless), smoking status (yes vs no), diet (high vs low adherence), intellectual activity (high vs low), and physical activity (high vs low).
Variables showing significant associations with sex-related biomarker differences were further examined with general linear models at p < 0.05, corrected for multiple comparisons.
Step 3: Sensitivity analysis
We performed a sensitivity analysis to further examine those variables showing predictive associations with sex-specific AD biomarker abnormalities, as described in the Appendix, available from Dryad (doi.org/10.5061/dryad.zgmsbcc6g).
Data availability
All relevant data are included in this article. Anonymized data will be shared on request from any qualified investigator.
Results
Participants
A total of 150 participants 40 to 65 years of age met our inclusion criteria and were available for analysis. We excluded 29 participants, including 10 with incomplete lifestyle data, 8 with incomplete laboratory markers, 7 with incomplete reproductive aging records, and 4 with artifactual images. The remaining 121 participants were examined, including 85 women and 36 men.
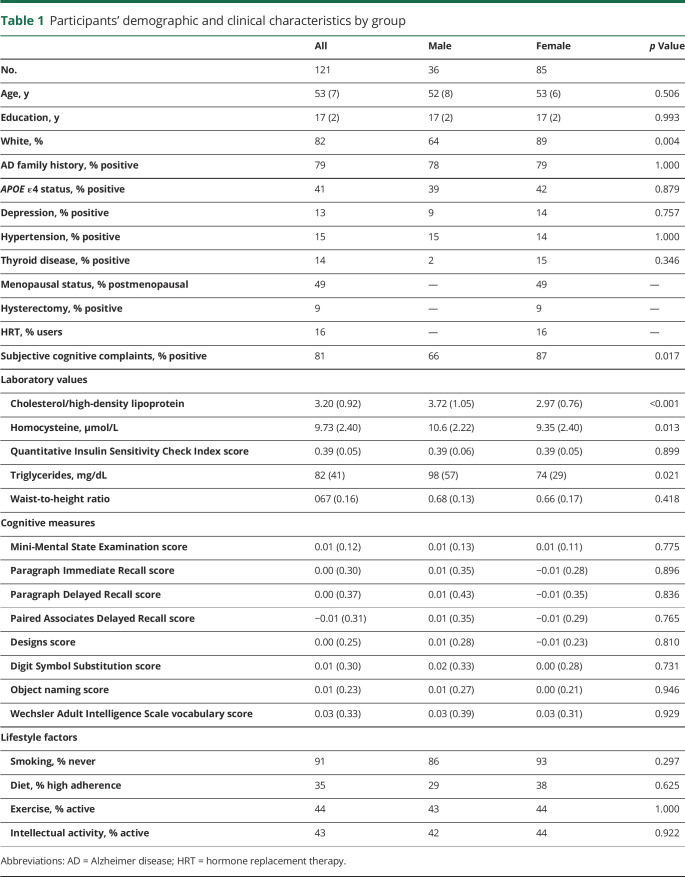
Participants' characteristics are given in table 1. There were no group differences for clinical measures, APOE ε4 status, and AD family history. The male group included a higher percentage of minority participants and had higher plasma triglycerides, cholesterol/HDL, and homocysteine values than the female group (p < 0.022 for all).
Table 1.
Participants' demographic and clinical characteristics by group
Groups were comparable for cognitive measures, although the female group included a higher percentage of participants with subjective memory complaints than the male group (p = 0.017).
Step 1: Sex-related AD brain biomarker differences
Biomarker differences by sex group
MRI volumes
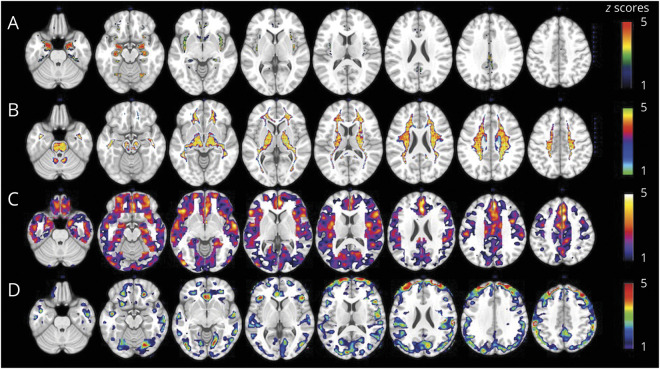
After adjustment for age and total intracranial volume, the female group showed lower GMV compared to the male group in several brain regions (p < 0.05 FWE corrected; figure 1A). These included the hippocampus, amygdala, parahippocampal gyrus, insula, and caudate (data available from Dryad, table 3, doi.org/10.5061/dryad.zgmsbcc6g). After adjustment for the same confounds, no brain regions showed lower GMV in the male group compared to the female group, with or without correction for multiple comparisons.
Figure 1. Sex differences in brain AD biomarkers.
(A) MRI gray matter volumes. (B) MRI white matter volumes. (C) Pittsburgh compound B–PET β-amyloid deposition. (D) Fluorodeoxyglucose-PET glucose metabolism. Statistical parametric maps (SPMs) displaying brain regions showing Alzheimer disease (AD) biomarker abnormalities in women vs men are represented on different color-coded scales after being thresholded to standardized z scores: 1 < z < 5, where z > 3 corresponds to p < 0.05 family-wise error corrected. All SPMs are displayed onto a standardized MRI.
After adjustment for age and total intracranial volume, the female group also showed lower WMV in several areas compared to the male group (p < 0.05 FWE corrected; figure 1B). No brain regions showed lower WMV in the male group than in the female group, with or without correction for multiple comparisons.
PiB-PET amyloid deposition
After adjustment for age and cerebellar uptake, the female group showed higher PiB uptake compared to the male group in several brain regions (p < 0.05 FWE corrected; figure 1C). These included chiefly the superior frontal (SFG), medial frontal (MFG), orbitofrontal, and anterior cingulate gyri (data available from Dryad, table 4, doi.org/10.5061/dryad.zgmsbcc6g). No brain regions showed higher PiB uptake in the male group vs the female group, with or without correction for multiple comparisons.
FDG-PET glucose metabolism
After adjustment for age and global activity, the female group showed lower FDG uptake compared to the male group in the SFG, MFG, and inferior parietal lobule (IPL) (p < 0.05 FWE corrected; figure 1D and data available from Dryad, table 5, doi.org/10.5061/dryad.zgmsbcc6g). No brain regions showed lower FDG uptake in the male group vs the female group at a corrected p level. At an uncorrected threshold of p < 0.001, the male group showed 2 small clusters of lower FDG uptake in the inferior frontal gyrus compared to the female group (data available from Dryad, table 5). We included these measures in the LASSO regression analysis for exploratory purposes.
Age- and size-matched groups
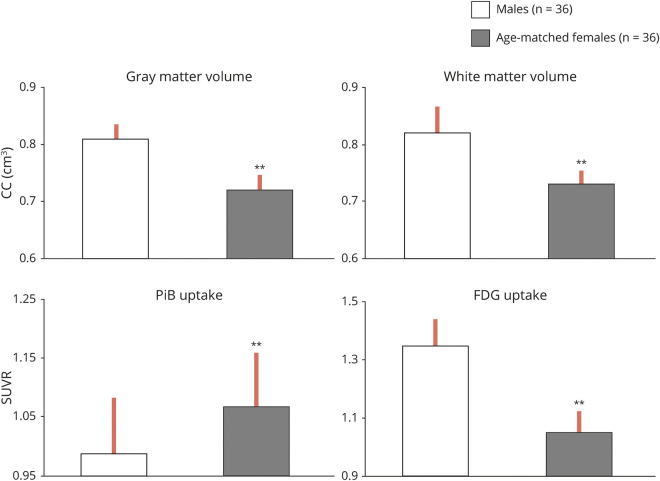
As shown in figure 2, analysis of age-matched groups replicated results from the entire cohort, with the female group showing on average 11% lower GMV, 11% lower WMV, 22% lower FDG uptake, and 30% higher PiB uptake compared to the male group (p < 0.05 corrected for multiple comparisons).
Figure 2. Brain Alzheimer disease biomarker abnormalities across size- and age-matched groups.
Biomarkers are extracted from the clusters showing maximal statistical differences between groups. Values are reference-adjusted mean values, SEM; **p < 0.001. CC = cubic centimeters; FDG = fluorodeoxyglucose; PiB = Pittsburgh compound B; SUVR = standardized uptake value ratio.
Step 2: Associations between AD biomarkers and AD risk factors
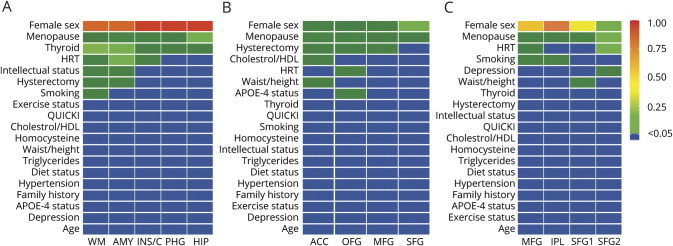
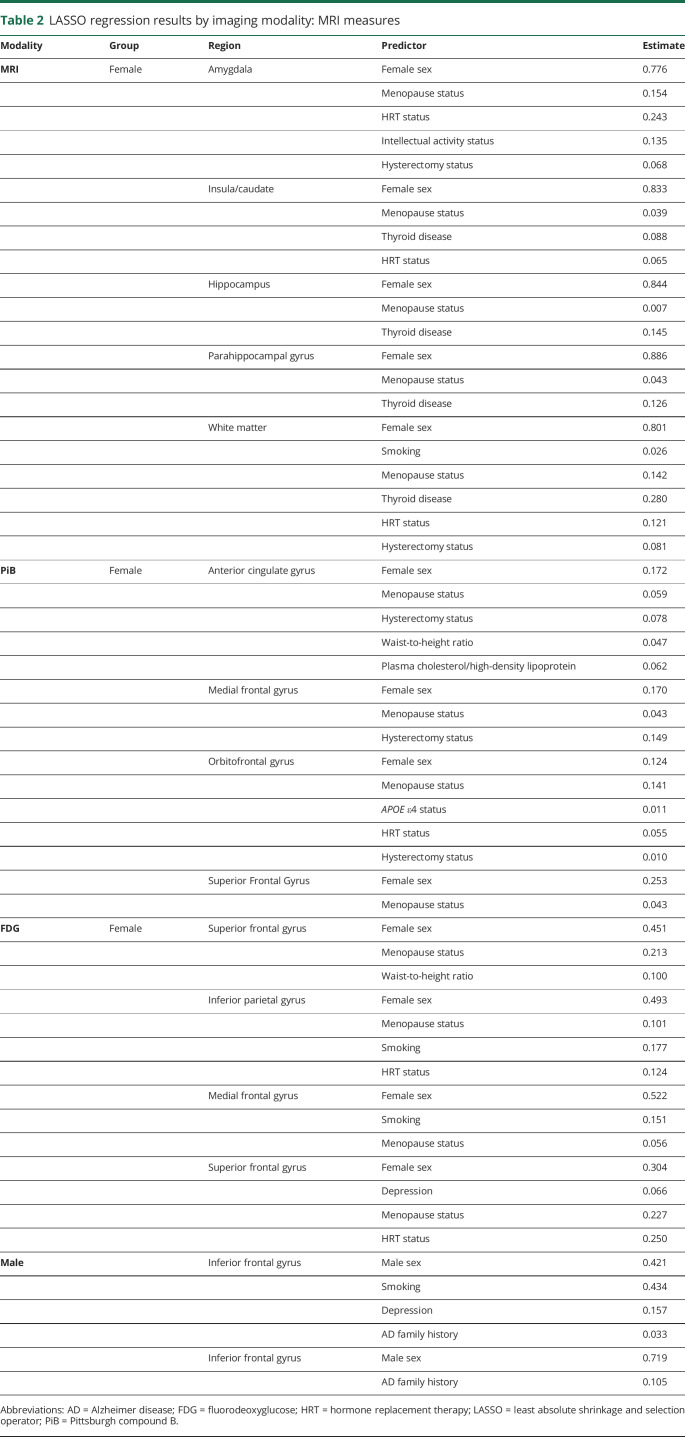
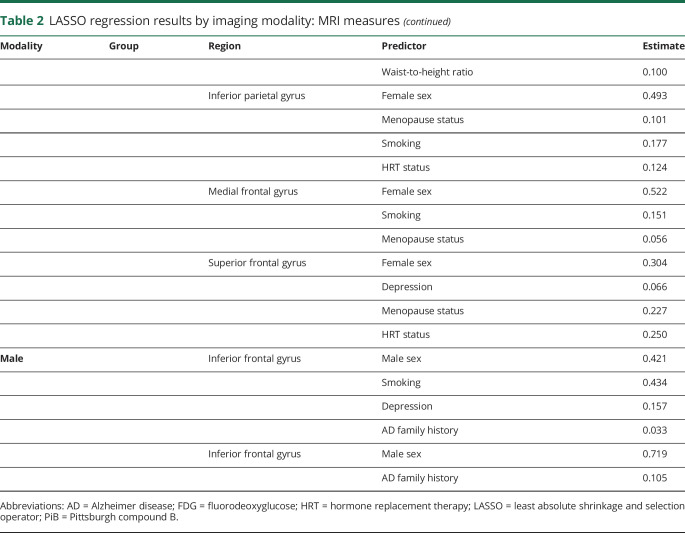
To enable comparison of imaging outcomes of different magnitudes, the heat maps display the absolute magnitude of each predictor, z scored for direct comparison between different imaging modalities and brain regions. Results are displayed in figure 3 and summarized below. Corresponding regression coefficients are found in table 2.
Figure 3. Sex- and biomarker-specific heat maps.
(A) MRI gray and white matter volumes. (B) Pittsburgh compound B–PET β-amyloid deposition. (C) Fluorodeoxyglucose-PET glucose metabolism. Heat maps of the associations of Alzheimer disease (AD) risk factors with sex-dependent AD brain biomarker differences. Biomarker measures were z scored to enable multimodality comparison. Coefficient estimates are displayed as colors ranging from blue to red as shown in the key. Rows are clustered by the frequency of the selected predictor and, in cases of ties, by the sum of the predictive value across all outcomes. Columns are clustered by brain regions. ACC = anterior cingulate cortex; AMY = amygdala; HDL = high-density lipoprotein; HIP = hippocampus; HRT = hormonal replacement therapy; INS/C = insula/caudate; IPL = inferior parietal lobule; MFG = medial frontal gyrus; OFG = orbitofrontal gyri; PHG = parahippocampal gyrus; QUICKI = Quantitative Insulin Sensitivity Check Index; SFG = superior frontal gyrus (cluster 1 and cluster 2); WM = white matter.
Table 2.
LASSO regression results by imaging modality: MRI measures
MRI volumes
As shown in Figure 3A, in addition to female sex, menopausal status was the predictor most consistently associated with MRI measures across all regions examined for both GMV and WMV. Thyroid disease also showed associations with GMV in the insula, caudate, hippocampus, and parahippocampal gyrus, as did HRT status in the amygdala, insula, and caudate and hysterectomy status in amygdala.
These same predictors, as well as smoking status, were also associated with WMV.
PiB amyloid deposition
As shown in Figure 3B, in addition to female sex, menopausal status was the predictor most consistently associated with PiB uptake across all regions examined. Hysterectomy status was also associated with PiB uptake in the SFG, MFG, and anterior cingulate cortex regions; HRT was associated with PiB uptake in the orbitofrontal gyrus. Other predictors less consistently associated with PiB uptake included APOE ε4 status, plasma lipids, and waist-to-height ratios.
FDG-PET glucose metabolism
As shown in figure 3C, female sex and menopause were the predictors most consistently associated with FDG uptake in all regions examined. HRT status also showed associations with FDG uptake in the SFG and IPL, as did smoking in the MFG and IPL (figure 3C).
Overall, inspection of the heat maps (figure 3, A–C) shows that, after female sex, menopausal status was the predictor most robustly and consistently associated with all AD biomarkers and regions of interest, followed by HRT and hysterectomy. Thyroid disease was also a strong predictor for MRI measures. These variables were further examined below.
Step 3: Sensitivity analysis
Effects of menopause on AD biomarkers
Given that menopausal status was the risk factor showing the strongest and most consistent association with female-specific AD biomarker abnormalities and given that postmenopausal women are typically older than premenopausal and perimenopausal women, we performed a sensitivity analysis to assess the effects of chronological vs endocrine aging on AD biomarkers (data available from Dryad, Appendix, doi.org/10.5061/dryad.zgmsbcc6g).
To summarize our findings, we first determined that we had a sufficient age range overlap across menopause groups, which is a prerequisite to enable examination of both age and menopause as separate predictors in the LASSO regression analysis.
Second, regression analysis showed that age was not significantly associated with MRI and FDG measures, whereas it was positively associated with PiB uptake in the frontal cortex of the male group. This positive association was not apparent for the female group or menopause subgroups. Finally, SPM comparison of each menopausal group to age-matched men showed a gradient of biomarker abnormalities, in both magnitude and extent, as follows: men < premenopausal < perimenopausal < postmenopausal women (p < 0.05, FWE corrected for multiple comparisons).
Effects of HRT, hysterectomy, and thyroid disease
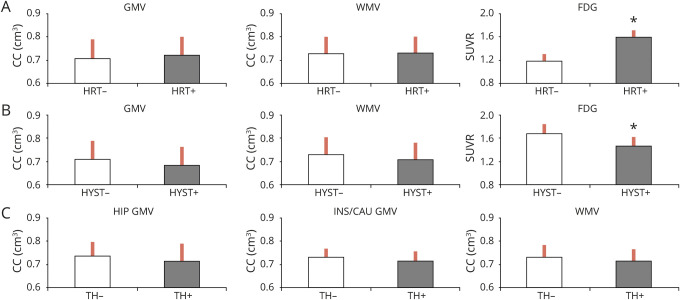
As shown in figure 4A, with adjustment for age, HRT users showed higher FDG uptake compared to nonusers (p = 0.05). There was a significant interaction with menopause status (p = 0.039), which was driven by postmenopausal women on HRT showing 31% higher FDG measures than postmenopausal women not taking HRT. HRT users also showed nonsignificant linear trends toward larger GMV and WMV measures vs nonusers.
Figure 4. AD biomarkers.
Alzheimer disease (AD) biomarkers by (A) hormonal replacement therapy (HRT) use, (B) hysterectomy (HYST), and (C) thyroid disease (TH) status. Values are reference-adjusted mean values, SEM; *p < 0.05. CC = Cubic centimeters; FDG = fluorodeoxyglucose; GMV = gray matter volume; HIP = hippocampus; INS/CAU = insula/caudate; SUVR = standardized uptake value ratio; WMV = white matter volume.
Hysterectomized women showed trends toward lower FDG uptake, higher PiB uptake, and smaller GMV and WMV compared to nonhysterectomized women (p < 0.18 for all, figure 4B).
Women with thyroid disease showed trends toward smaller GMV compared to those without thyroid disease (p < 0.2, figure 4C).
Discussion
Among middle-aged cognitively intact individuals, the female group exhibited an AD endophenotype characterized by higher Aβ deposition, lower glucose metabolism, and lower GMV and WMV compared to the male group. Results were independent of age and remained largely unchanged with the use of age-matched groups. AD biomarker abnormalities in women were more consistently and strongly associated with menopausal status, followed by HRT, hysterectomy status, and thyroid disease.
These results are consistent with previous studies reporting AD biomarker abnormalities in women compared to men.21,22 For example, older women tended to accumulate higher tangle burden compared to men with the same brain Aβ levels, with no difference in lifetime AD risk.21 Women also exhibited greater rates of neuropathologic decline after an AD diagnosis, as reflected in increased hippocampal atrophy and neurofibrillary tangles, compared to male patients with AD.22 Findings reported herein demonstrate that women exhibit AD biomarker changes in midlife, decades before possible clinical symptoms. Overall, these studies suggest an earlier onset of AD pathophysiology in women than in men.
Furthermore, regression analysis revealed that the menopause transition (MT) was the strongest predictor of the observed sex-related brain AD abnormalities. This is consistent with observations that MT is a major female-specific risk factor for AD.3,5
Menopause is a midlife neuroendocrine transition state that culminates with reproductive senescence and is accompanied by neurologic symptoms such as disruption of estrogen-regulated thermoregulation, disturbed sleep, onset of depression, and changes in multiple cognitive domains, especially memory.24 Many of these symptoms are known AD risk factors.24 Previous brain imaging studies showed that MT is associated with emergence of AD-related brain changes in women compared to men of a similar age, with MT mapping onto the time course of the preclinical phase of AD.9–11 Furthermore, a shorter reproductive lifespan and an earlier menopause onset have been associated with an increased AD risk in women.25 Present findings from a larger cohort of >120 new participants replicate previous findings indicating that, among a number of possible AD risk factors, MT is the strongest predictor of AD biomarker abnormalities in middle-aged women.
This is also consistent with preclinical studies showing that, during MT, declines in circulating estrogens are coincident with declines in brain bioenergetics and shifts toward a metabolically compromised phenotype.26 Inadequate or absent compensatory bioenergetic adaptations to the lack of estrogenic activation are thought to trigger not only the signature symptoms of menopause but also an increased AD risk.27 In fact, 17β-estradiol has been shown to regulate Aβ levels in the brain, with estrogen declines promoting expression of genes involved in Aβ production and downregulation of Aβ-degrading enzymes.28,29 Although our cross-sectional data preclude assessment of causality, the observed relationships between AD biomarkers and MT, a putative metabolic event, suggest that menopause-associated metabolic changes may promote Aβ deposition in at least some women. Longitudinal data are warranted to examine the temporal and causal relationships between metabolic and Aβ events.
While all sex hormones are likely to be involved, our voxel-based analysis findings support the view that estrogen declines are involved in the observed AD biomarker abnormalities in women. The pattern of gray matter loss in particular shows anatomic overlap with the brain estrogen network (figure 5), which includes estrogen receptors widely found in, among other regions, the prefrontal cortex, hippocampus, amygdala, and posterior cingulate cortex.24 Previous research suggests that a reduction in estrogen levels during menopause coincides with a decline in brain bioenergetics and a shift toward a metabolically compromised phenotype in these brain regions.26 It is possible that reduced FDG uptake in cortical areas captures the distal effects of neuronal loss in estrogen-depleted regions.30 Both changes may in turn be a result of ongoing Aβ aggregation. In terms of Aβ burden, a gradient effect was observed such that postmenopausal > perimenopausal > premenopausal women, indicating an increasing risk of AD in at least some 52 as undergoing menopause.
Figure 5. Anatomic overlap between the brain estrogen receptor network24 and the brain regions showing reduced GMVs in middle-aged women vs men.
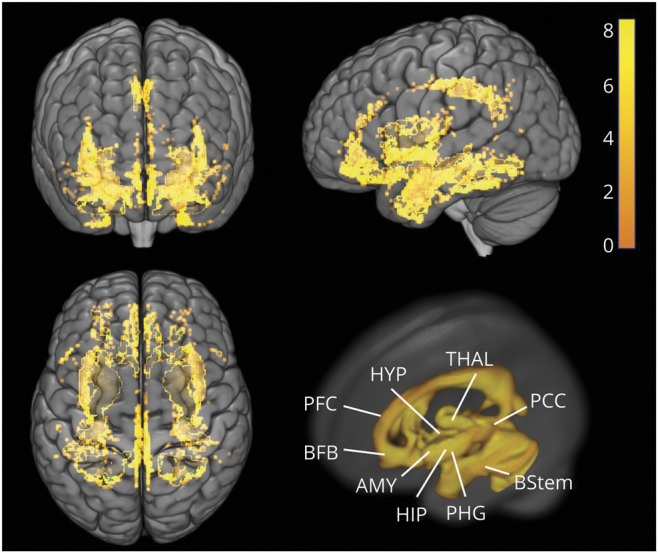
Statistical parametric maps of brain regions showing reduced gray matter volumes (GMVs) in women vs men are represented on a color-coded scale and displayed onto the anterior (top left), left lateral (top right), and superior views (bottom left) of a standardized 3D-rendered MRI. For comparison, bottom left panel shows a 3D rendering of the estrogen network. AMY = amygdala; BFB = basal forebrain; BStem = brainstem; HIP = hippocampus; HYP = hypothalamus; PCC = posterior cingulate cortex; PFC = prefrontal cortex; PHG = parahippocampal gyrus; THAL = thalamus.
AD biomarkers were also influenced by history of HRT use and hysterectomy. While our sample size precluded examination of the interactions between these factors, we observed higher FDG uptake and generally more favorable biomarker outcomes in HRT users compared to nonusers. Similar trends were noted in nonhysterectomized vs hysterectomized women. Larger studies are needed to specifically assess these associations and whether they are influenced by factors such as time since surgery and duration and type of HRT. Currently, the effects of HRT on dementia risk, as well as the risk of coronary artery disease, remain controversial. Data indicate that HRT efficacy may depend on the timing of treatment initiation with respect to age or menopause onset, with benefits pertaining to early initiation, especially in women with a hysterectomy or oophorectomy.31,32 While hysterectomized women have an increased risk of AD compared to naturally menopausal women, HRT initiated close to the time of surgery seems to reduce the risk.33 We offer that future clinical trials would benefit from brain imaging measures as surrogate biomarkers of clinical endpoints.
In addition, thyroid disease, another hormonal-related risk factor for AD, predicted reduced MRI volumes in women compared to men. There are known links between thyroid disease—which is typically more prevalent in women than in men, as was also the case in this study—and an increased risk of cognitive impairment.34 Although little work has been done to assess associations between thyroid function and AD biomarkers, some studies reported associations between lower thyroid hormone levels and increased brain atrophy in the elderly without dementia.35 More work is warranted to clarify the impact of sex and gender on the relationships between thyroid function and AD risk.
Several questions remain to be answered. First, our cross-sectional results do not allow determination of causality. Longitudinal studies are needed to determine whether the observed female-specific biomarker abnormalities are predictive of dementia. Although our female group, especially the perimenopausal and postmenopausal groups, had a higher frequency of subjective complaints than the male group, we did not observe group differences for cognitive performance. This is not surprising because the effects of estrogen declines on cognition have been difficult to pinpoint by means of neuropsychological testing. It is well documented that across the adult lifespan, women perform better than men across several cognitive domains, especially verbal memory, and that this advantage may persist even into early AD.36,37 Specific memory tests like those used in this study were shown to be sensitive to menopausal changes when assessed over time.11 In this cross-sectional study, we did not observe reduced cognitive performance in women compared to men, not even postmenopausal or perimenopausal women, supporting the notion that brain biomarkers are more sensitive than cognitive tests for the detection of AD risk in asymptomatic individuals.
Hormonal confirmation was available for ≈30% of our participants. Therefore, our determination of menopausal status in the rest of the cohort is vulnerable to error. Our classification was based on established diagnostic criteria known to be in agreement with clinical and laboratory findings,14 which reduce potential for misclassification. While we consider it likely that changes in menstrual cycle frequency reported by our participants reflect actual menopausal status, our perimenopausal group may have included more women already undergoing menopause. Some postmenopausal women could have been still perimenopausal. This would, however, conservatively reduce power in detecting differences between groups. Our findings of more pronounced AD biomarker changes in postmenopausal and intermediate changes in perimenopausal women are consistent with group assignment and with preclinical data.25 In addition, although we collected information on specific menopausal symptoms (e.g., cognitive problems, insomnia, reduced libido), we were underpowered to examine different symptom clusters. Other studies are needed to examine the relationships between specific menopausal symptoms and brain biomarkers.
Our cohort included 70% women, which is consistent with AD prevalence in the general population.2 Results of biomarker abnormalities in women compared to men remained unchanged with the use of size-matched groups and are consistent with previous reports.21,22 We offer that a larger male group may have revealed biomarker abnormalities in men as well. At an exploratory p < 0.001 uncorrected, we detected 2 small clusters of reduced FDG uptake in the inferior frontal cortex of men vs women. Descriptively, these clusters seemed associated mostly with smoking status (table 6, available from Dryad, doi.org/10.5061/dryad.zgmsbcc6g), a risk factor for cardiovascular disease known to increase AD risk in both men and women.3,4 More work is warranted to elucidate male-specific risk factors for AD.
The present study focused on self-reported male and female participants. Nonetheless, it is important to note that these results may not be equally informative to all persons who identify as male or female and do not apply to trans-women or trans-men who may experience risks associated with the hormonal milieu differently.
Finally, our results are pertinent to healthy, middle-aged participants without severe cerebrovascular or cardiovascular disease. Studies with larger samples, longitudinal follow-ups, and community-based populations are necessary to assess the generalizability of these findings.
Overall, the present findings provide support for the idea that the optimal window of opportunity for AD preventive interventions in women is early in the endocrine aging process.
Glossary
- Aβ
β-amyloid
- AD
Alzheimer disease
- FDG
fluorodeoxyglucose
- FWE
family-wise error
- GMV
gray matter volume
- HDL
high-density lipoprotein
- HRT
hormonal replacement therapy
- IPL
inferior parietal lobule
- LASSO
least absolute shrinkage and selection operator
- MFG
medial frontal gyrus
- MT
menopause transition
- PiB
Pittsburgh compound B
- SFG
superior frontal gyrus
- SPM
Statistical Parametric Mapping
- WMV
white matter volume
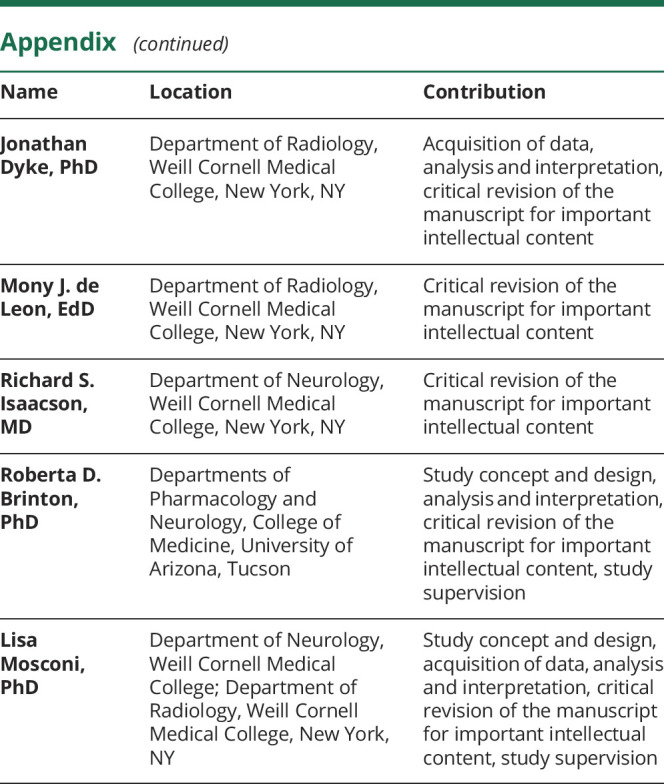
Appendix. Authors

Footnotes
CME Course: NPub.org/cmelist
Study funding
This study was supported by grants from NIH/National Institute on Aging (2P01AG026572, 3P01AG026572-31S1, AG057931, AG035137), NIH/National Center for Advancing Translational Sciences UL1TR002384, the Cure Alzheimer's Fund, and the Women's Alzheimer's Movement.
Disclosure
The authors report no disclosures relevant to the manuscript. Go to Neurology.org/N for full disclosures.
References
- 1.Farrer LA, Cupples LA, Haines JL, et al. Effects of age, sex, and ethnicity on the association between apolipoprotein E genotype and Alzheimer disease: a meta-analysis: APOE and Alzheimer Disease Meta Analysis Consortium. JAMA 1997;278:1349–1356. [PubMed] [Google Scholar]
- 2.Alzheimer’s Association. Alzheimer's disease facts and figures. Alzheimers Dement 2017;13:325–373. [Google Scholar]
- 3.Ferretti MT, Iulita MF, Cavedo E, et al. Sex differences in Alzheimer disease: the gateway to precision medicine. Nat Rev Neurol 2018;14:457–469. [DOI] [PubMed] [Google Scholar]
- 4.Nebel RA, Aggarwal NT, Barnes LL, et al. Understanding the impact of sex and gender in Alzheimer's disease: a call to action. Alzheimers Dement 2018;14:1171–1183. [DOI] [PMC free article] [PubMed] [Google Scholar]
- 5.Rahman A, Jackson H, Hristov H, et al. Sex and gender driven modifiers of Alzheimer's: the role for estrogenic control across age, race, medical and lifestyle risks. Frontiers in Aging Neuroscience 2019;11:315. [DOI] [PMC free article] [PubMed] [Google Scholar]
- 6.Barnes DE, Yaffe K. The projected effect of risk factor reduction on Alzheimer's disease prevalence. Lancet Neurol 2011;10:819–828. [DOI] [PMC free article] [PubMed] [Google Scholar]
- 7.Sperling RA, Karlawish J, Johnson KA. Preclinical Alzheimer disease: the challenges ahead. Nat Rev Neurol 2013;9:54–58. [DOI] [PMC free article] [PubMed] [Google Scholar]
- 8.Jack CR Jr, Knopman DS, Jagust WJ, et al. Hypothetical model of dynamic biomarkers of the Alzheimer's pathological cascade. Lancet Neurol 2010;9:119–128. [DOI] [PMC free article] [PubMed] [Google Scholar]
- 9.Jack CR Jr, Knopman DS, Jagust WJ, et al. Tracking pathophysiological processes in Alzheimer's disease: an updated hypothetical model of dynamic biomarkers. Lancet Neurol 2013;12:207–216. [DOI] [PMC free article] [PubMed] [Google Scholar]
- 10.Mosconi L, Berti V, Quinn C, et al. Sex differences in Alzheimer risk: brain imaging of endocrine vs chronologic aging. Neurology 2017;89:1382–1390. [DOI] [PMC free article] [PubMed] [Google Scholar]
- 11.Mosconi L, Berti V, Guyara-Quinn C, et al. Perimenopause and emergence of an Alzheimer's bioenergetic phenotype in brain and periphery. PLoS One 2017;12:e0185926. [DOI] [PMC free article] [PubMed] [Google Scholar]
- 12.Mosconi L, Rahman A, Diaz I, et al. Increased Alzheimer's risk during the menopause transition: a 3-year longitudinal study. PLoS One 2018;13:e0207885. [DOI] [PMC free article] [PubMed] [Google Scholar]
- 13.Katz A, Nambi SS, Mather K, et al. Quantitative insulin sensitivity check index: a simple, accurate method for assessing insulin sensitivity in humans. J Clin Endocrinol Metab 2000;85:2402–2410. [DOI] [PubMed] [Google Scholar]
- 14.Isaacson RS, Ganzer CA, Hristov H, et al. The clinical practice of risk reduction for Alzheimer's disease: a precision medicine approach. Alzheimers Dement 2018;14:1663–1673. [DOI] [PMC free article] [PubMed] [Google Scholar]
- 15.Harlow SD, Gass M, Hall JE, et al. Executive summary of the Stages of Reproductive Aging Workshop + 10: addressing the unfinished agenda of staging reproductive aging. Menopause 2012;19:387–395. [DOI] [PMC free article] [PubMed] [Google Scholar]
- 16.Scarmeas N, Anastasiou CA, Yannakoulia M. Nutrition and prevention of cognitive impairment. Lancet Neurol 2018;17:1006–1015. [DOI] [PubMed] [Google Scholar]
- 17.Mosconi L, Walters M, Sterling J, et al. Lifestyle and vascular risk effects on MRI-based biomarkers of Alzheimer's disease: a cross-sectional study of middle-aged adults from the broader New York City area. BMJ Open 2018;8:e019362. [DOI] [PMC free article] [PubMed] [Google Scholar]
- 18.Taylor HL, Jacobs DR Jr, Schucker B, Knudsen J, Leon AS, Debacker G. A questionnaire for the assessment of leisure time physical activities. J Chronic Dis 1978;31:741–755. [DOI] [PubMed] [Google Scholar]
- 19.Wilson R, Barnes L, Bennett D. Assessment of lifetime participation in cognitively stimulating activities. J Clin Exp Neuropsychol 2003;25:634–642. [DOI] [PubMed] [Google Scholar]
- 20.Ashburner J, Friston KJ. Voxel-based morphometry-the methods. NeuroImage 2000;11:805–821. [DOI] [PubMed] [Google Scholar]
- 21.Hastie T, Tibshirani R, Friedman J, Franklin J. The elements of statistical learning: data mining, inference and prediction. Math Intelligencer 2005;27:83–85. [Google Scholar]
- 22.Buckley RF, Mormino EC, Rabin JS, et al. Sex differences in the association of global amyloid and regional tau deposition measured by positron emission tomography in clinically normal older adults. JAMA Neurol 2019;76:542–551. [DOI] [PMC free article] [PubMed] [Google Scholar]
- 23.Barnes LL, Wilson RS, Bienias JL, Schneider JA, Evans DA, Bennett DA. Sex differences in the clinical manifestations of Alzheimer disease pathology. Arch Gen Psychiatry 2005;62:685–691. [DOI] [PubMed] [Google Scholar]
- 24.Scheyer O, Rahman A, Hristov H, et al. Female sex and Alzheimer's risk: the menopause connection. J Prev Alzheimers Dis 2018;5:225–230. [DOI] [PMC free article] [PubMed] [Google Scholar]
- 25.Brinton RD, Yao J, Yin F, Mack WJ, Cadenas E. Perimenopause as a neurological transition state. Nat Rev Endocrinol 2015;11:393–405. [DOI] [PMC free article] [PubMed] [Google Scholar]
- 26.Gilsanz P, Lee C, Corrada MM, Kawas CH, Quesenberry CP, Whitmer RA. Reproductive period and risk of dementia in a diverse cohort of health care members. Neurology 2019;92:e2005–e2014. [DOI] [PMC free article] [PubMed] [Google Scholar]
- 27.Rettberg JR, Yao J, Brinton RD. Estrogen: a master regulator of bioenergetic systems in the brain and body. Front Neuroendocrinol 2014;35:8–30. [DOI] [PMC free article] [PubMed] [Google Scholar]
- 28.Zhao L, Mao Z, Woody SK, Brinton RD. Sex differences in metabolic aging of the brain: insights into female susceptibility to Alzheimer's disease. Neurobiol Aging 2016;42:69–79. [DOI] [PMC free article] [PubMed] [Google Scholar]
- 29.Yao J, Irwin R, Chen S, Hamilton R, Cadenas E, Brinton RD. Ovarian hormone loss induces bioenergetic deficits and mitochondrial β-amyloid. Neurobiol Aging 2012;33:1507–1521. [DOI] [PMC free article] [PubMed] [Google Scholar]
- 30.Yue X, Lu M, Lancaster T, et al. Brain estrogen deficiency accelerates Aβ plaque formation in an Alzheimer's disease animal model. Proc Natl Acad Sci USA 2005;102:19198–19203. [DOI] [PMC free article] [PubMed] [Google Scholar]
- 31.Mosconi L, Pupi A, De Cristofaro MTR, Fayyaz M, Sorbi S, Herholz K. Functional interactions of the entorhinal cortex: an 18F-FDG PET study on normal aging and Alzheimer's disease. J Nucl Med 2004;45:382–392. [PubMed] [Google Scholar]
- 32.Maki PM, Girard LM, Manson JE. Menopausal hormone therapy and cognition. BMJ 2019;364:1877. [DOI] [PubMed] [Google Scholar]
- 33.Rocca WA, Grossardt BR, Shuster LT. Oophorectomy, estrogen, and dementia: a 2014 update. Mol Cell Endocrinol 2014;389:7–12. [DOI] [PMC free article] [PubMed] [Google Scholar]
- 34.Rocca W, Bower J, Maraganore D, et al. Increased risk of cognitive impairment or dementia in women who underwent oophorectomy before menopause. Neurology 2007;69:1074–1083. [DOI] [PubMed] [Google Scholar]
- 35.Belandia B, Latasa MJ, Villa A, Pascual A. Thyroid hormone negatively regulates the transcriptional activity of the β-amyloid precursor protein gene. J Biol Chem 1998;273:30366–30371. [DOI] [PubMed] [Google Scholar]
- 36.de Jong FJ, den Heijer T, Visser TJ, et al. Thyroid hormones, dementia, and atrophy of the medial temporal lobe. J Clin Endocrinol Metab 2006;91:2569–2573. [DOI] [PubMed] [Google Scholar]
- 37.Rentz DM, Weiss BK, Jacobs EG, et al. Sex differences in episodic memory in early midlife: impact of reproductive aging. Menopause 2017;24:400–408. [DOI] [PMC free article] [PubMed] [Google Scholar]
- 38.Mielke MM, Vemuri P, Rocca WA. Clinical epidemiology of Alzheimer's disease: assessing sex and gender differences. Clin Epidemiol 2014;6:37. [DOI] [PMC free article] [PubMed] [Google Scholar]
Associated Data
This section collects any data citations, data availability statements, or supplementary materials included in this article.
Data Availability Statement
All relevant data are included in this article. Anonymized data will be shared on request from any qualified investigator.


