Abstract
Objective
To understand the progressive nature of amyotrophic lateral sclerosis (ALS) by investigating differential brain patterns of gray and white matter involvement in clinically or genetically defined subgroups of patients using cross-sectional, longitudinal, and multimodal MRI.
Methods
We assessed cortical thickness, subcortical volumes, and white matter connectivity from T1-weighted and diffusion-weighted MRI in 292 patients with ALS (follow-up: n = 150) and 156 controls (follow-up: n = 72). Linear mixed-effects models were used to assess changes in structural brain measurements over time in patients compared to controls.
Results
Patients with a C9orf72 mutation (n = 24) showed widespread gray and white matter involvement at baseline, and extensive loss of white matter integrity in the connectome over time. In C9orf72-negative patients, we detected cortical thinning of motor and frontotemporal regions, and loss of white matter integrity of connections linked to the motor cortex. Patients with spinal onset displayed widespread white matter involvement at baseline and gray matter atrophy over time, whereas patients with bulbar onset started out with prominent gray matter involvement. Patients with unaffected cognition or behavior displayed predominantly motor system involvement, while widespread cerebral changes, including frontotemporal regions with progressive white matter involvement over time, were associated with impaired behavior or cognition. Progressive loss of gray and white matter integrity typically occurred in patients with shorter disease durations (<13 months), independent of progression rate.
Conclusions
Heterogeneity of phenotype and C9orf72 genotype relates to distinct patterns of cerebral degeneration. We demonstrate that imaging studies have the potential to monitor disease progression and early intervention may be required to limit cerebral degeneration.
Amyotrophic lateral sclerosis (ALS) is clinically and genetically a heterogeneous disease.1 Up to 15% of patients develop frontotemporal dementia, and another 35% have some degree of cognitive or behavioral impairment.2,3 A repeat expansion in C9orf72 appears to be the most common mutation in patients with ALS.4,5 The pathologic mechanisms underlying the process of neurodegeneration in ALS have not yet been resolved. Knowing more about how neurodegeneration develops over time and about its associated biomarkers in patients with ALS and subgroups, based on phenotype or genotype, may help to identify therapy that slows or stops disease progression.
Neuroimaging might be valuable in tracing disease progression in ALS. Previous cross-sectional imaging studies have consistently reported abnormalities within the motor area,6 frontotemporal regions,7,8 and basal ganglia.9,10 It has also become clear that patients with a C9orf72 repeat expansion have a distinct neuroimaging phenotype of widespread gray and white matter involvement.11,12 Longitudinal imaging studies may provide an anatomical characterization of disease progression related to clinical phenotype, and might guide our understanding of underlying neurodegenerative processes. Moreover, whereas many imaging studies applied a single imaging technique, a multimodal approach will be valuable for establishing the relative sensitivity of various imaging techniques in different stages of ALS and thus provide greater insight into when gray and white matter become involved during disease development.
In the present study, we investigated longitudinal structural brain changes in a large cohort of patients with ALS, applying a multimodal imaging approach, assessing both gray and white matter of the brain.
Methods
Participants
Patients were recruited from Prospective ALS Study The Netherlands (PAN), an ongoing population-based, case–control study performed in the Netherlands since January 2006, shortly after diagnosis.13 Clinical characteristics, including functional, cognitive, and behavioral status, disease duration, and site of onset, were recorded. Functional status was assessed using the revised ALS Functional Rating Scale–revised (ALSFRS-R).14 Cognition was assessed using 3 neuropsychological tests: verbal fluency index (VFI), Edinburgh Cognitive and Behavioral ALS Screen (ECAS), and frontal assessment battery (FAB). Abnormality in at least one of these tests was regarded as cognitive impairment. Because ECAS was developed after the study started, different methodologies to assess cognitive or behavioral impairment were applied. VFI scores were transformed to z scores. A patient had abnormal cognition if the score was below the 5th percentile.15 The ALS-specific scores of the ECAS16,17 were used to assess cognitive status: a patient was labeled with abnormal cognition if the residual score (i.e., observed score – expected score) was in the lowest 5% of the Dutch normative population, derived using the percentile rank method on residuals.16 FAB scores <13 points indicated abnormal cognition.18 Behavior was assessed using the Amyotrophic Lateral Sclerosis–Frontotemporal Dementia Questionnaire (ALS-FTD-Q)19 and the behavioral screen of the ECAS (asking the caregiver to report changes in behavior).17 Behavioral impairment was defined as apathy or scoring at least 2 other items on the ECAS behavioral screen3 or an ALS-FTD-Q score ≥22 points.19
Disease duration in months was calculated from symptom onset to scan date. Disease progression rate was calculated by (48 – ALSFRS-R score)/disease duration (in months).20 C9orf72, FUS, TARDBP, and SOD1 mutations were assessed, as described previously.21 Follow-up of patients was conducted approximately every 4–6 months. At each visit, patients were examined by a clinician specialized in motor neuron diseases, and their functional, cognitive, and behavioral status assessed.
Controls also came from the aforementioned PAN study.13 Follow-up scans were conducted for this reference group after approximately 1 year to account for physiologic changes over time (“aging”). Patients with a history of epilepsy, stroke, or any overt structural brain abnormalities were excluded.
Image acquisition and preprocessing
Anatomical T1- and diffusion-weighted images of the brain were acquired using a 3T Philips (Best, the Netherlands) Achieva Medical Scanner, as described previously.22,23
Cortical and subcortical brain regions were analyzed using T1 images and FreeSurfer (V.5.3.0, surfer.nmr.mgh.harvard.edu/). In total, 92 distinct brain regions (68 cortical, 14 subcortical, and 6 ventricular regions, 4 cerebellar volumes) were parcellated and segmented (editing cortical parcellations was not necessary)24 according to the Desikan-Killiany atlas.25 Longitudinal analysis was performed by creating an unbiased within-subject template space and image using robust inverse consistent registration.26 Participants with a single scan were also preprocessed within the longitudinal preprocessing stream of FreeSurfer.
Using diffusion-weighted imaging (DWI), white matter tracts forming the structural brain network were reconstructed based on fractional anisotropy (FA).22,23 Nodes were taken as 83 segmented brain regions (cortical and subcortical regions and brainstem) and the interlinking connections represented the white matter pathways. For each participant, an individual undirected, weighted brain network was reconstructed.22 To avoid potential spurious fibers, we only considered connections that were present in 50% of all participants.27
Statistical analyses
Statistical analyses were performed using the R software package version 3.4.3 (R Foundation for Statistical Computing, R-project.org). Connectome-based analyses were implemented using MATLAB Release 2017b (The MathWorks, Inc., Natick, MA; mathworks.com). Measures of cortical thickness, subcortical volumes, and structural connectivity were statistically compared between patients with ALS and controls. Furthermore, we investigated patients with C9orf72 separately, as they have a distinct imaging phenotype, and performed sensitivity analyses to examine possible influence of other pathogenic mutations. Age and sex were used as covariates in all analyses. For subcortical volumes, we also included total intracranial volume as covariate.
Cross-sectional analyses were conducted on the baseline scans using linear models and permutation tests (10,000 random permutations). Longitudinal analyses were performed, based on all available scans, applying linear mixed-effects (LME) models to assess change of structural measures over time, while accounting for random between-subject variation using random slopes and random intercepts.28 Participants with single assessments were included to take into account potential attrition bias and different time intervals between scans were incorporated. LME models are well-suited to analyzing longitudinal data with irregular and different follow-up intervals, as was the case for patients and controls.28,29 To investigate disease-specific effects in patients with ALS compared to controls, an interaction term (follow-up interval × group) was included. Here, follow-up interval denoted the time from baseline scan up to the moment of the follow-up scan and group refers to patient or control. Stratified analyses for site of onset (bulbar vs spinal), cognitive or behavioral impairment, and disease duration were performed to investigate brain involvement in relation to clinical phenotype.
All gray matter analyses were corrected for multiple testing using false discovery rate (FDR). p Values <0.05, after FDR correction, were considered statistically significant. Significance of connectome findings was assessed by means of Network-Based Statistics,30 using the property of connectome disease effects to be more plausible when occurring in connected components rather than in isolation. Edges were initially labeled as affected if the linear model indicated a p value <0.05. The size of the largest connected component of these affected connections was tested for significance by comparing it to a null distribution obtained by 1,000 random permutations of group assignments.
Fair comparisons between cognitively or behaviorally impaired and unaffected patients require equal sample sizes. We therefore obtained 50 random subsamples of unaffected patients to equal those of the impaired subgroups, and performed 400 and 40 permutations per subsample for the gray and white matter analyses, respectively, which we subsequently pooled. To achieve result stability and account for subsampling analysis, we carried out twice as many permutations (in total). Sensitivity analyses were performed by excluding all participants with abnormal ECAS scores to assess whether results were driven by participants with cognitive impairment. Finally, we compared baseline scans of patients without follow-up data to those of patients with longitudinal data to assess attrition bias.
Standard protocol approvals, registrations, and patient consents
The Medical Ethical Committee of the University Medical Center Utrecht approved the study. Written informed consent was obtained from all participants.
Data availability
The data that support the findings of this study are available via the corresponding author, on reasonable request. The reporting of this study conforms to the Strengthening the Reporting of Observational Studies in Epidemiology (STROBE) statement.31
Results
Demographics
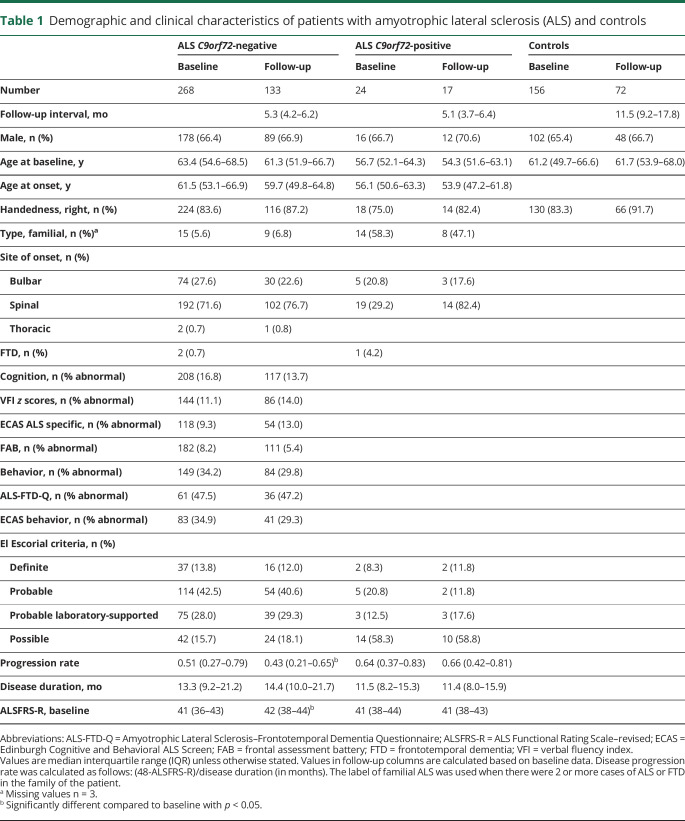
In total, 292 patients with ALS and 156 controls participated in the study (table 1). Twenty-four of the patients tested positive for the C9orf72 repeat expansion. DWI data were available for 251 patients with ALS (21 C9orf72-positive patients) and 135 controls. Follow-up data (up to 6 visits, tables e-1 and e-2, doi:10.5061/dryad.8931zcrkv) were available for 133 C9orf72-negative patients with ALS (i.e., patients without the C9orf72 repeat expansion) and 17 C9orf72-positive patients with ALS, with a median follow-up time between the first and second visit of 5.23 months. This relatively short follow-up time was due to the progressive nature of the disease. Genetic data were available for 211 patients and 7 patients had a pathogenic mutation other than the C9orf72 repeat expansion (table e-3, doi:10.5061/dryad.8931zcrkv). Of the total control group, 72 controls had 2 or 3 follow-up visits (median follow-up time 11.5 months). Participants dropped out at follow-up because they were unable to undergo second scan (n = 73), were deceased at follow-up (n = 58), or second scan was not scheduled yet according to study protocol at time of analysis (n = 102).
Table 1.
Demographic and clinical characteristics of patients with amyotrophic lateral sclerosis (ALS) and controls
To investigate brain involvement in relation to clinical phenotype, C9orf72-negative patients were stratified for site of onset (table e-4, doi:10.5061/dryad.8931zcrkv). Patients were categorized into 4 groups based on quartiles of disease duration at the first MRI scan (i.e., gray matter: ≤9.2, 9.2–13.3, 13.3–21.2, and >21.2 months; white matter: ≤10, 10–14, 14–21, and >21 months; table e-5, doi:10.5061/dryad.8931zcrkv). Cognitive and behavioral status was available for a subset of patients (tables e-6 to e-8, doi:10.5061/dryad.8931zcrkv). Significant correlations between the MRI measurements and total ALSFRS-R score are shown (appendix e-1 and figure e-1, doi:10.5061/dryad.8931zcrkv).
C9orf72-negative ALS
Comparing 268 C9orf72-negative patients with ALS with 156 controls at baseline, significantly thinner cortex was found in the primary motor, frontal, and temporal regions (figure 1A). The left accumbens nucleus and right thalamus, bilateral hippocampi, and left amygdala were also significantly smaller in patients (table e-9, doi:10.5061/dryad.8931zcrkv). The inferior lateral and third and fourth ventricles were significantly larger in patients with ALS compared to controls; gray and white matter volumes of the cerebellum were not significantly different (table e-10, doi:10.5061/dryad.8931zcrkv). Baseline connectome analysis revealed the largest connected component of reduced structural connectivity (comprising 140 connections) in the motor network (p < 0.001; figure 1C).
Figure 1. Brain involvement at baseline and additional changes over time in C9orf72-negative and -positive patients with amyotrophic lateral sclerosis (ALS).
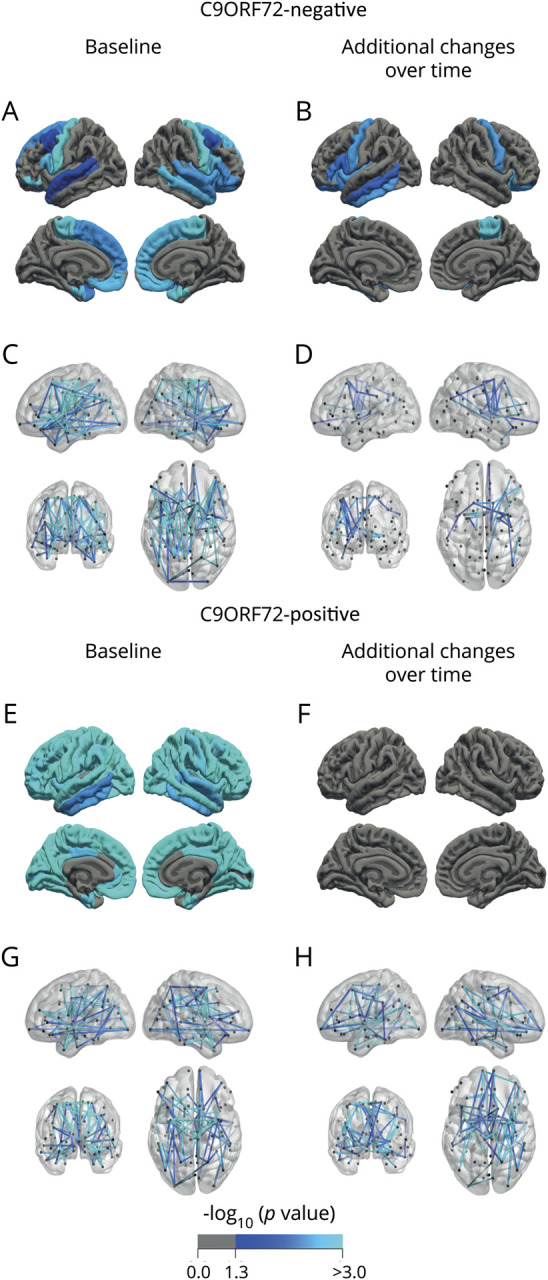
(A, B) Comparison of cortical thickness between C9orf72-negative patients with ALS (n = 268) and controls (n = 156). Regions with a significantly lower cortical thickness at baseline (A) and additional cortical changes over time (B) in patients with ALS are marked in blue (p < 0.05, false discovery rate–corrected). The cortical thickness of each region of interest (ROI) (separately for left and right hemisphere) was taken for the analyses. Each resulting p value was mapped onto the surface of the entire ROI to indicate significant regional differences between groups. (C, D) Connectome analysis with affected connections in patients with ALS (n = 230) compared to controls (n = 135) at baseline (140 connections, p < 0.001 [C]), and additional changes over time, centralized in the motor network (D), as expressed by a decrease in fractional anisotropy, marked in blue (27 connections, p = 0.016). (E, F) Comparison of cortical thickness between C9orf72-positive patients with ALS (n = 24) and controls (n = 156) at baseline shows widespread cortical involvement (E) and no additional cortical thinning over time (F). (G, H) Connectome analysis reveals widespread connectivity effects in patients with ALS at baseline (n = 24, 86 connections, p = 0.005 [G]), and extensive additional white matter effects over time (71 connections, p = 0.048 [H]).
At follow-up, additional cortical thinning was found in the bilateral precentral gyri, right paracentral gyrus, and frontal and temporal regions (p < 0.05, figure 1B). Volumes of the left caudate, right thalamus and accumbens nucleus, right cerebellar cortex, and bilateral hippocampi decreased significantly over time. Volumes of the lateral, third, and fourth ventricles increased significantly over time. Connectome analyses demonstrated a small component (27 connections) with FA reductions over time and none with FA increase (p = 0.016; figure 1D).
C9orf72-positive ALS
At baseline, more extensive cortical thinning in C9orf72-positive patients compared to controls than in the analysis with C9orf72-negative ALS was observed (figure 1E). Reduction in volume of the bilateral thalami, caudate, putamen, pallidum, accumbens nuclei, hippocampi, and amygdala and enlargement of the ventricles were found (table e-9, doi:10.5061/dryad.8931zcrkv). Connectome analysis revealed a component of reduced connectivity (86 connections), most notably in connections between the bilateral precentral and paracentral gyri, basal ganglia, and temporal lobe (p = 0.005, figure 1G).
At follow-up, no additional cortical effects were observed (figure 1F), enlargement of the (inferior) lateral and third ventricles could be detected, and progressive white matter involvement was shown by FA reductions in a large component (71 connections, p = 0.048, figure 1H).
Bulbar- vs spinal-onset ALS
Compared to controls at baseline, C9orf72-negative patients with ALS with bulbar onset were found to have more widespread cortical involvement than patients with spinal onset (figure 2, A and E): both onset groups showed thinning of the primary motor regions and the right entorhinal cortex, but bulbar-onset patients also showed thinning of frontotemporal and parietal regions. Regarding subcortical effects, compared to controls, bulbar-onset patients showed larger inferior lateral ventricles and reduced volumes of the bilateral hippocampi, thalami, accumbens nuclei, and right putamen (table e-11, doi:10.5061/dryad.8931zcrkv).
Figure 2. Analysis of cortical thickness and connectivity effects stratified for site of onset.
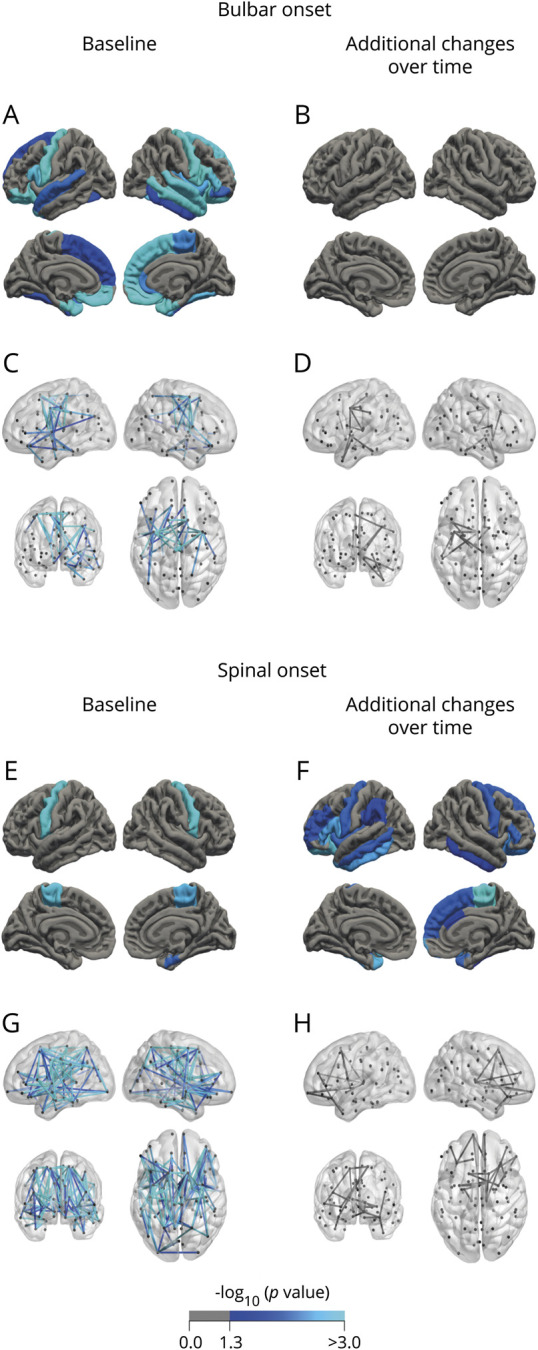
(A–D) Bulbar onset. At baseline, frontotemporal involvement and connectivity effects involving the primary motor regions are shown (p < 0.05 for cortical thickness [A]; 48 connections, p = 0.020 [C]), with no additional cortical changes (B) and only small changes in connectivity over time (11 connections, p = 0.063 [D]). (E–H) Spinal onset. At baseline, cortical thinning is confined to the motor cortex (E), whereas additional cortical changes are found in frontotemporal regions during follow-up (F). Connectome analysis shows a large component of decreased connectivity strength (152 connections, p < 0.001 [G]), again including small changes in the primary motor and frontotemporal regions over time (22 connections, p = 0.065 [H]). Regions unique for bulbar onset were the bilateral fusiform, medial orbitofrontal gyri, pars orbitalis, superior frontal and temporal gyri and temporal lobes, left entorhinal gyrus, right inferior temporal gyrus, insula, middle temporal gyrus, pars opercularis, pars triangularis, rostral anterior cingulate, and the bilateral amygdala. Regions unique for spinal onset were all situated in the left hemisphere: middle and inferior temporal gyri, insula, pars triangularis, and the paracentral gyrus.
Spinal-onset patients showed larger inferior lateral ventricles and reduced volumes of the bilateral hippocampi compared to controls. Bulbar- and spinal-onset patients showed strongly overlapping effects of the most severely affected connections mainly involving bilateral precentral gyri and paracentral lobules (figure 2, C and G), but the spinal-onset group displayed a more widespread pattern of affected connections (bulbar onset: 48 connections, p = 0.020; spinal onset: 152 connections, p < 0.001).
No additional changes could be detected in bulbar-onset patients (figure 2, B and D). In contrast, patients with a spinal onset showed progressive cortical thinning in the primary motor and frontotemporal regions, additional decrease in volumes of the bilateral hippocampi, left caudate, right thalamus, and accumbens nucleus, and enlargement of the ventricles, as well as a nonsignificant component of decreased connectivity over time, mainly involving frontotemporal regions (22 connections, p = 0.065, figure 2, F and H).
Cognition and behavior
In patients with unaffected cognition or behavior, cerebral changes were mainly characterized by thinner precentral gyri (figures 3A and 4A). The inferior lateral ventricles were enlarged in both groups, and smaller bilateral hippocampi were found for patients with unaffected cognition (tables e-12 and e-13, doi:10.5061/dryad.8931zcrkv). The largest connected component in cognitively or behaviorally unaffected patients was centralized around the motor system (cognition: 44 connections, p = 0.026, figure 3C; behavior: 51 connections, p = 0.021, figure 4C).
Figure 3. Analysis of cortical thickness and connectivity effects in patients with normal and abnormal cognition.
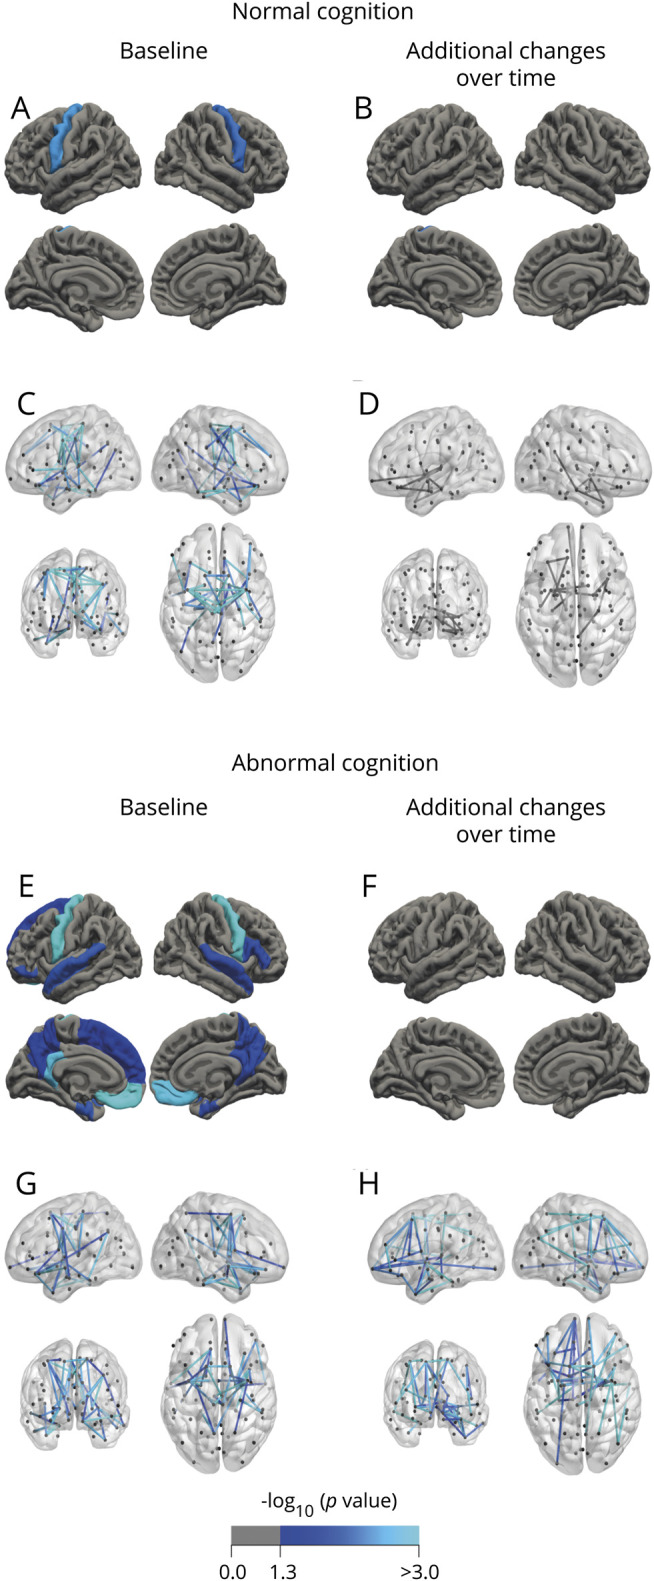
Patients with normal cognition show predominantly involvement of the motor system at baseline (A and C) and minor cerebral change over time (B and D). In contrast, cerebral changes were widespread for gray and white matter and included extramotor regions in patients with abnormal cognition (E and G). Over time, these patients only showed loss of white matter integrity (47 connections, p = 0.043 [F and H]).
Figure 4. Analysis of cortical thickness and connectivity effects in patients with normal and abnormal behavior.
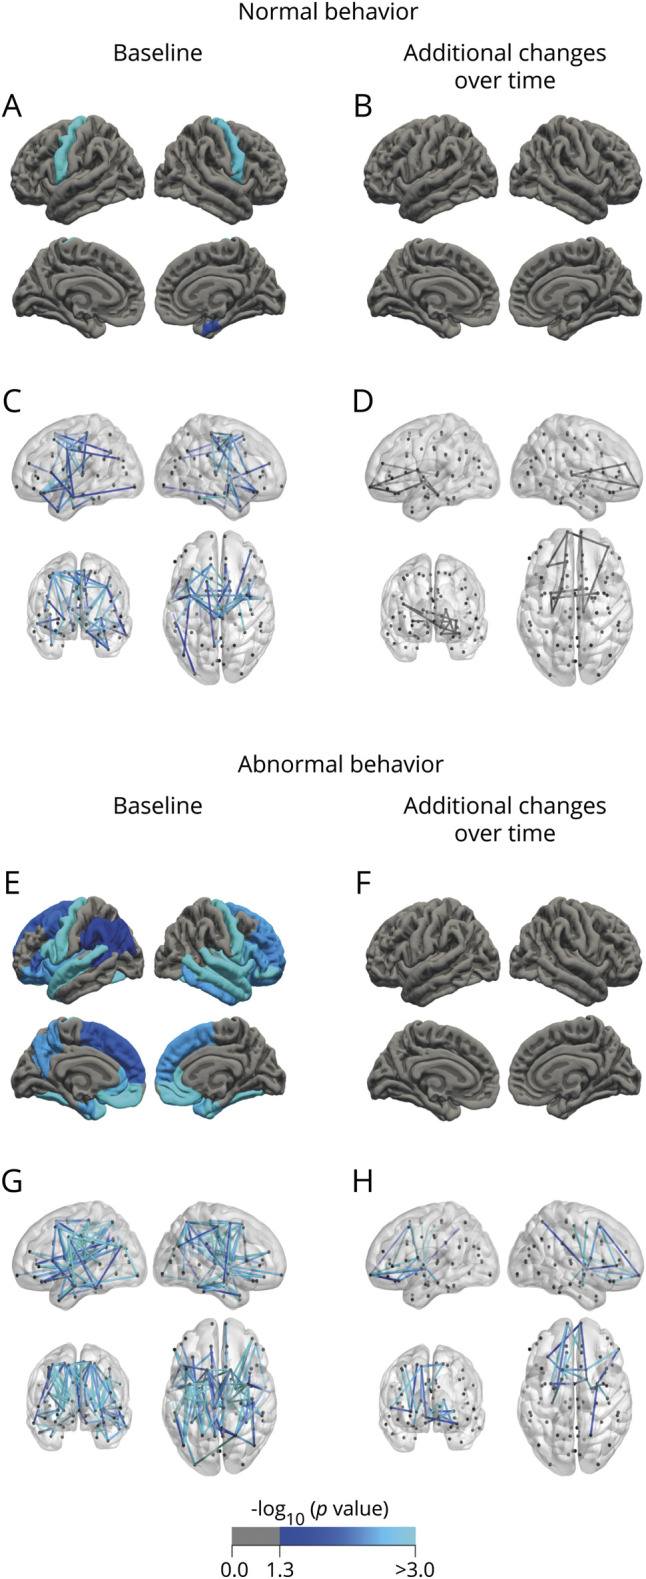
Patients with normal behavior show predominantly involvement of the motor system at baseline (A and C) and minor cerebral change over time (B and D). In contrast, patients with abnormal behavior demonstrated widespread cerebral changes comprising nearly the entire temporal and frontal lobes (E and G). Over time, behaviorally impaired patients showed additional loss of white matter integrity (22 connections, p = 0.021 [F and H]).
At follow-up, there was no additional gray or white matter involvement for cognitively or behaviorally unaffected patients; only patients with unaffected behavior showed a smaller right accumbens nucleus and both groups displayed enlarged ventricles.
At baseline, cognitively impaired patients had thinner bilateral precentral gyri and frontotemporal regions (figure 3E) and showed smaller volumes of the bilateral amygdala, hippocampi, caudate, left accumbens nucleus, and right putamen, and enlargement of the inferior lateral and third ventricles (table e-12, doi:10.5061/dryad.8931zcrkv). The largest connected component included frontal and temporal connections (46 connections, p = 0.023, figure 3G).
At follow-up, there was no additional gray matter thinning in cognitively impaired patients. They showed decreasing bilateral hippocampi and left caudate volumes and enlarging ventricles. The significant largest connected component of reduced structural connectivity included frontotemporal regions (47 connections, p = 0.043, figure 3H).
Patients with impaired behavior showed thinner bilateral precentral gyri, frontal, parietal, and temporal regions, and reduced volumes of the bilateral hippocampi, amygdala, accumbens nuclei, right thalamus, putamen, and caudate, and enlarged inferior lateral and third ventricles (table e-13, doi:10.5061/dryad.8931zcrkv). The significant largest connected component included motor, temporal, frontal, and parietal connections (110 connections, p < 0.001, figure 4G).
At follow-up, these patients showed no additional thinning, but ventricular volumes increased. The significant largest connected component included frontal connections (22 connections, p = 0.021, figure 4H).
Effect of disease duration
Patients were compared between quartile groups of disease durations. The first quartile group had a higher progression rate at baseline compared to the others (i.e., 0.78 compared to 0.62, 0.52, and 0.26, respectively).
At baseline, patients with a disease duration of less than 9 months from symptom onset (first quartile group) showed significant thinning of the rostral anterior cingulate cortex (figure 5A); the second quartile group showed cortical thinning in the bilateral precentral gyri and right entorhinal cortex (figure 5C); the third quartile group showed cortical thinning congruent with the second quartile group and thinning of the bilateral pars orbitalis, pars opercularis, right pars triangularis, and rostral middle frontal gyrus (figure 5E); the fourth quartile group showed the most extensive cortical thinning including primary motor regions and frontotemporal regions (figure 5G). Regarding subcortical structures, there was significant enlargement of the inferior lateral ventricles for all quartiles compared to controls (table e-14, doi:10.5061/dryad.8931zcrkv). The first quartile also showed reduced volumes of the left hippocampus and amygdala. Subcortical effects were found in the second quartile (bilateral hippocampi, right pallidum, amygdala, and thalamus and third ventricle) and the fourth quartile (right hippocampus and fourth ventricle). Baseline connectome analyses of the quartile groups showed consistent involvement of the motor network (precentral, paracentral, and brainstem) and limited extramotor involvement (first quartile group: 65 connections, p = 0.002; second quartile group: 68 connections, p = 0.012; third quartile group: 98 connections, p = 0.003; and fourth quartile group: 121 connections, p < 0.001, figure 6, A, C, E, and G).
Figure 5. Analysis of cortical thickness stratified for disease duration.
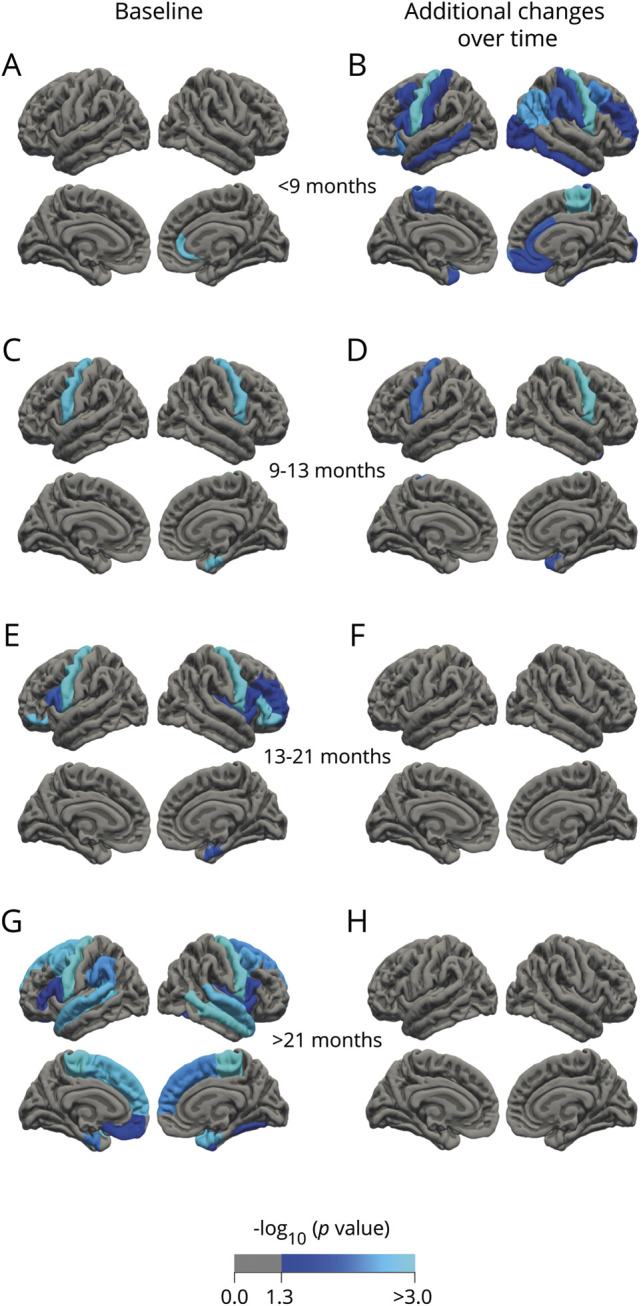
(A, C, E, and G) Baseline. (B, D, F, and H) Additional effects over time. Patients with amyotrophic lateral sclerosis (ALS) with a short disease duration show cortical thinning limited to the rostral anterior cingulate cortex at baseline (A) and additional cortical changes over time in motor and frontotemporal regions (B). Patients with a longer disease duration show cortical involvement of similar frontotemporal regions at baseline and no progressive cortical changes during follow-up.
Figure 6. Analysis of connectivity stratified for disease duration.
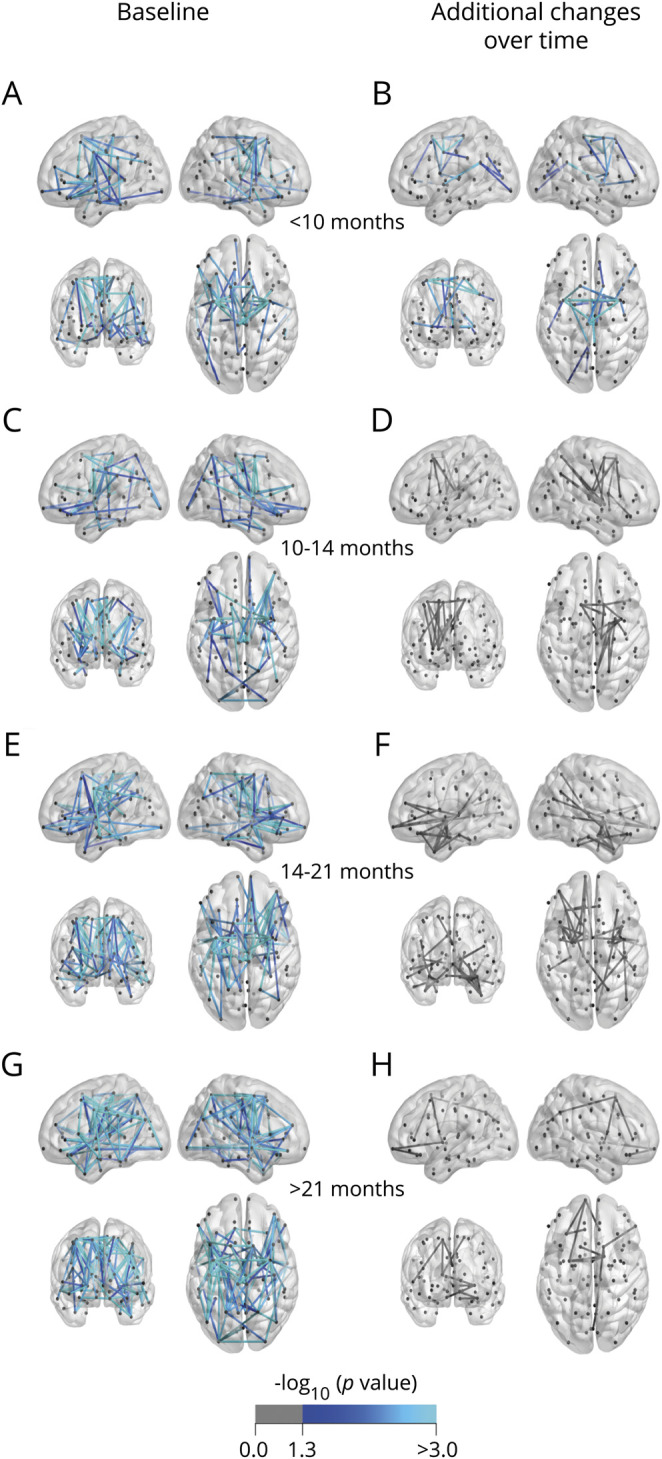
(A, C, E, and G) Baseline. (B, D, F, and H) Additional effects over time. Patients with a long disease duration show extensive connectivity effects at baseline (121 connections, p < 0.001 [G]) and no significant additional effects over time (H). Patients with a short disease duration show effects centered around the motor network at baseline (65 connections, p = 0.002 [A]) and additional connectivity effects over time (23 connections, p < 0.001 [B]).
Patients with a disease duration of less than 9 months from symptom onset showed significant additional cortical thinning over time, including primary motor and frontotemporal regions (figure 5B). The second quartile group displayed significant additional changes restricted to the bilateral precentral gyri and right temporal pole (figure 5D). The third and fourth quartile groups showed no significant additional longitudinal cortical changes (figure 5, F and H).
At follow-up, the first quartile group showed an additional decrease in subcortical volumes of the bilateral thalami and hippocampi, left caudate, and right accumbens nucleus, and enlargement of the ventricles. The second and third quartile groups only showed ventricular enlargement over time. No additional effects were detected in the fourth quartile group. Patients with the shortest disease duration were the only disease duration subgroup that showed significant additional connectivity effects over time (first quartile: 23 connections, p < 0.001; second quartile: p = 0.070; third quartile: p = 0.056; fourth quartile: p = 0.436, figure 6, B, D, F, and H).
Because patients with an early MRI scan have a faster disease progression, we further explored the effect of disease progression on cerebral changes. The progressive loss of gray and white matter integrity in patients with shorter disease durations (<13 months) is independent of progression rate (appendix e-2, table e-15, and figures e-5 and e-6, doi:10.5061/dryad.8931zcrkv).
Sensitivity analyses
Sensitivity analyses, excluding participants with an abnormal ECAS score or a pathogenic mutation other than C9orf72, showed similar results to those described above. In most subgroups, patients without follow-up data displayed more cerebral involvement than patients with longitudinal data, with considerable overlap of the involved regions (figure e-2, doi:10.5061/dryad.8931zcrkv). Disease effects measured in mean diffusivity are similar to FA: frontal connections are present more frequently in the largest connected components (appendix e-3 and figure e-3, doi:10.5061/dryad.8931zcrkv). Figure e-4 (doi:10.5061/dryad.8931zcrkv) displays direct comparisons between subgroups (appendix e-4, doi:10.5061/dryad.8931zcrkv).
Discussion
We investigated whether structural MRI could serve as a biomarker of disease progression in clinical trials. We applied multiple modalities of brain imaging, cross-sectionally at baseline and longitudinally, to a large cohort of patients with ALS and controls. Longitudinal effects in the total group of patients were detected in terms of progressive cortical atrophy in primary motor and frontotemporal regions, shrinking subcortical volumes, ventricle enlargement, and loss of white matter integrity in a connected component around the motor cortex. We were also able to identify differential patterns of gray and white matter involvement in subgroups of patients with specific clinical characteristics, disease duration, or genotype. The heterogeneity of our findings among subgroups of patients may have important implications for cross-sectional and follow-up MRI studies in ALS, and the timing of neuroimaging in the disease course for clinical trials and follow-up studies.
We performed a comprehensive study using cross-sectional, longitudinal, and multimodal information. In the LME models, we could use all 292 baseline scans of patients with ALS as well as the available follow-up scans from 150 patients. Thereby, we account for between-subject variation and attrition bias, and thus improve accuracy of the longitudinal analyses, as was reported previously.28 A limitation of all imaging studies in ALS, including the present study, may be selection bias towards a cohort of patients able to undergo MRI scanning. In our study, this limitation applies in particular to the longitudinal part: these patients less frequently had a bulbar onset and a slower disease progression than those with only 1 MRI scan. However, by closely monitoring this possible bias during inclusion of patients, we were able, for the first time, to analyze MRI scans of a relatively large number of patients with fast-progressing disease and patients at an early stage of the disease. At baseline, more extensive cerebral involvement was observed in patients with a single scan compared to patients with follow-up scans (figure e-2, doi:10.5061/dryad.8931zcrkv), suggesting that the longitudinal results might be slightly underestimating the extent of brain involvement over time. However, it is also possible that patients with more severe baseline involvement who could not undergo follow-up might have reached a plateau of neurodegeneration. MRI scanners allowing scanning in an upright position may facilitate inclusion of patients with ALS in follow-up studies.
The multiple modalities comprised gray matter data, in terms of cortical thickness and subcortical volumes, and all white matter tracts. Previous multimodal imaging studies included a maximum of 64 patients who were assessed at a single time point. These studies reported both gray and white matter alterations in patients with ALS compared to controls, most prominent in the motor cortex, frontal lobe, and corticospinal tract.32–35 Our study demonstrates, probably due to the larger sample size, that, besides these regions, temporal regions are exposed to cortical thinning, subcortical structures (i.e., basal ganglia, thalamus, and hippocampi) have reduced volumes, and ventricles are enlarged. By applying connectome-based analyses, we showed widespread loss of white matter integrity, not restricted to the corticospinal tract. Future research could examine cerebellum connectomes to investigate disease effects in this region.
Few previous studies combined a multimodal and longitudinal approach.32–34 Other longitudinal imaging studies included a single modality (gray or white matter) to examine the pattern of disease progression36–40 and revealed mainly progressive gray matter atrophy in the primary motor system and frontal areas.32–34,36 We also found progressive thinning in temporal regions, shrinking of subcortical volumes, and enlarging ventricles at follow-up. Concerning white matter, longitudinal studies focused mainly on the corticospinal tract, showing minor or no changes,32–34,37,38,40 while assessment of the entire connectome in our study demonstrated significant loss of connectivity in the motor system and its linked connections in the right hemisphere in the absence of increasing FA. Importantly, we showed that progressive loss of gray and white matter integrity typically takes place in patients with shorter disease duration (<13 months after disease onset for gray matter and <10 months for white matter), while previous studies included patients with a mean disease duration at baseline at a later stage of at least 18 months. Loss of white matter integrity in previous studies may thus have already occurred before patients were included, indicating the relevance of timing of neuroimaging. Patients with the shortest disease duration revealed a distinct connectivity profile and more extensive changes in cortical thickness over time, while patients with longer disease duration showed widespread cortical thinning and loss of connectivity only at baseline, possibly reflecting a kind of brain change end stage. Previous research has shown, by applying simulations, that the healthy connectome provides an anatomical underlying substrate for TDP-43 pathology,41 following the stages suggested by the Braak model of corticofugal spread.42 Other studies indicated that interconnected gray matter regions become gradually affected instead of being subject to contiguous spread.10,43 Future research could, therefore, examine differences between the Braak stages and observed disease spread in patients. As patients with early diagnosis may have a more aggressive disease course,44 we investigated whether the observed effects reflect a more progressive disease course, but no clear relation between neuroimaging effects and disease progression was found in patients with short or long disease duration. Hence, scanning patients relatively early in the disease course may be more important than stratifying for progression rate. Using mean diffusivity instead of FA might help prolong the opportunity to reveal disease effects in white matter.
Patterns of brain abnormalities may also be determined by site of disease onset. We observed that both bulbar- and spinal-onset subgroups develop atrophy of similar anatomical regions, which is congruent to neuropathologic studies.45 However, we found a differential pattern of cerebral involvement in patients with bulbar or spinal onset at baseline and at follow-up: bulbar-onset patients showed prominent gray matter atrophy and some white matter changes at baseline, whereas spinal-onset patients mainly displayed widespread loss of connectivity. At follow-up, gray matter became affected in spinal-onset patients, whereas bulbar-onset patients showed no additional brain changes. One could speculate that the prominent white matter changes at baseline, followed by additional gray matter involvement in subsequent scans, might imply a dying-backward process of upper motor neuron degeneration in spinal-onset patients. For bulbar-onset patients, the direction of the disease process is less clear; clinically, upper motor neuron features in the bulbar region are more prominent in the early stage of the disease, implying a dying-forward process in bulbar-onset patients, which is at least not contradicted by our neuroimaging results. Incorporating other phenotypes, such as primary lateral sclerosis or progressive muscular atrophy, might provide more insight in the direction of neurodegeneration.
Previous cross-sectional imaging studies have shown extramotor cerebral involvement of frontal, temporal, and parietal regions in patients with cognitive or behavioral impairment (often considering abnormal cognition and behavior as one impaired group).35,46–48 In our multimodal study, gray and white matter changes were widespread, mainly in motor and frontotemporal regions, in cognitively and, even more extensively, in behaviorally impaired patients. Subcortical gray matter and white matter changes including frontotemporal regions were found to be progressive over time. In patients with unaffected cognition and behavior, cerebral changes were restricted to motor regions; thinning of the motor cortex and reduced ventricle volumes were found to be progressive. Thus, these findings largely reflect clinical observations and possibly provide an underlying anatomical substrate for cognitive and behavioral impairment in ALS.
A limitation of our study may be the missing data and heterogenous methodology for assessing cognitive or behavioral impairment as the ECAS was introduced after the study started. Despite this limitation, we were able to determine, in one of the largest imaging cohorts of cognitively and behaviorally impaired patients with ALS, according to the current Strong criteria,3 that cognition and behavior are relevant features to consider in follow-up neuroimaging studies in ALS. Future multimodal neuroimaging studies may need to explore more detailed patterns of cognitive and behavioral impairment in a cohort in which cognition and behavior are assessed homogeneously for the entire population.35 Moreover, it might be worthwhile to incorporate level of education and depression in the analyses, as they have a relevant effect on the brain.49,50
A distinctive MRI pattern of cerebral involvement was found in C9orf72-positive patients, showing more extensive cortical and subcortical changes, and reduced white matter integrity at baseline, which is in line with previous studies,11,12 and extensive additional white matter effects over time that were more prominent compared to the effects in C9orf72-negative patients. Longitudinal gray matter changes in C9orf72-positive patients were limited to enlargement of the ventricles. Our results indicate that connectome analyses, comprising all white matter tracts, may serve as a potential biomarker for upcoming C9orf72 gene therapy clinical trials. Moreover, the differential patterns of brain involvement emphasize the relevance of screening for the C9orf72 mutation in neuroimaging studies.
Our study underlines the potential of imaging studies to provide insight into structural brain involvement in relation to the heterogeneity of ALS. By conducting this study in a large cohort of C9orf72-positive and -negative patients with ALS, with carefully defined phenotypes and systematic follow-up, including controls, we were able to show differential effects of gray and white matter changes at baseline and during follow-up. The observed results might indicate that cerebral changes in ALS occur at a relatively early stage of the disease, leastwise at the level at which current multimodal techniques are able to detect abnormalities. This may imply that when designing clinical trials, inclusion of patients at an early stage of the disease is necessary to prevent cerebral neurodegeneration. These cerebral changes could be monitored by MRI provided that the appropriate modalities are applied to the right subgroups based on phenotypic characteristics or genotype. Incorporating innovative modalities, such as spinal cord imaging, EEG, or other neurophysiologic techniques, to quantify upper or lower motor neuron involvement in the analyses of future studies may improve our ability to investigate propagation of neurodegeneration in vivo at different stages of ALS.
Acknowledgment
The authors thank Ruben Schmidt for his early work on this project and Marcel de Reus for using software to create the white matter connectomes, which were visualized with BrainNet Viewer (nitrc.org/projects/bnv/).
Glossary
- ALS
amyotrophic lateral sclerosis
- ALS-FTD-Q
Amyotrophic Lateral Sclerosis–Frontotemporal Dementia Questionnaire
- ALSFRS-R
ALS Functional Rating Scale–revised
- DWI
diffusion-weighted imaging
- ECAS
Edinburgh Cognitive and Behavioral ALS Screen
- FAB
frontal assessment battery
- FDR
false discovery rate
- FA
fractional anisotropy
- LME
linear mixed-effects
- PAN
Prospective ALS Study The Netherlands
- VFI
verbal fluency index
Appendix. Authors


Study funding
This work was supported by the ALS Foundation Netherlands. M.P.v.d.H. was further supported by the Netherlands Organization for Scientific Research VIDI grant (VIDI-452-16-015). M.A.v.E. was supported by the Netherlands Organization for Scientific Research VENI grant (91614039). L.H.v.d.B. further received funding from the Netherlands Organization for Scientific Research VICI grant and the Netherlands Organization for Health Research and Development, funded through the EU Joint Programme–Neurodegenerative Disease Research, JPND. L.H.v.d.B. received travel grants and consultancy fees from Shire and serves on scientific advisory boards for Treeway, Cytokinetics, and Biogen Idec. J.H.V. has received funding from the European Research Council under the European Union's Horizon 2020 research and innovation programme (grant agreement 772376–EScORIAL).
Disclosure
H. van der Burgh, H.-J. Westeneng, R. Walhout, K. van Veenhuijzen, H. Tan, J. Meier, L. Bakker, J. Hendrikse, M. van Es, J. Veldink, and M. van den Heuvel report no disclosures. L. van den Berg reports grants from ALS Foundation Netherlands, The Netherlands Organization for Health Research and Development (VICI scheme, funded through the EU Joint Programme–Neurodegenerative Disease Research, JPND [SOPHIA, STRENGTH, ALS-CarE projects]), and personal fees from Shire, Cytokinetics, and Treeway, outside the submitted work. Go to Neurology.org/N for full disclosures.
References
- 1.van Es MA, Hardiman O, Chio A, et al. Amyotrophic lateral sclerosis. Lancet 2017;390:2084–2098. [DOI] [PubMed] [Google Scholar]
- 2.Ringholz GM, Appel SH, Bradshaw M, Cooke NA, Mosnik DM, Schulz PE. Prevalence and patterns of cognitive impairment in sporadic ALS. Neurology 2005;65:586–590. [DOI] [PubMed] [Google Scholar]
- 3.Strong MJ, Abrahams S, Goldstein LH, et al. Amyotrophic lateral sclerosis–frontotemporal spectrum disorder (ALS-FTSD): revised diagnostic criteria. Amyotroph Lateral Scler Front Degener 2017;18:153–174. [DOI] [PMC free article] [PubMed] [Google Scholar]
- 4.DeJesus-Hernandez M, Mackenzie IR, Boeve BF, et al. Expanded GGGGCC hexanucleotide repeat in noncoding region of C9ORF72 causes chromosome 9p-linked FTD and ALS. Neuron 2011;72:245–256. [DOI] [PMC free article] [PubMed] [Google Scholar]
- 5.Renton AE, Majounie E, Waite A, et al. A hexanucleotide repeat expansion in C9ORF72 is the cause of chromosome 9p21-linked ALS-FTD. Neuron 2011;72:257–268. [DOI] [PMC free article] [PubMed] [Google Scholar]
- 6.Chiò A, Pagani M, Agosta F, Calvo A, Cistaro A, Filippi M. Neuroimaging in amyotrophic lateral sclerosis: insights into structural and functional changes. Lancet Neurol 2014;13:1228–1240. [DOI] [PubMed] [Google Scholar]
- 7.Grosskreutz J, Kaufmann J, Frädrich J, Dengler R, Heinze HJ, Peschel T. Widespread sensorimotor and frontal cortical atrophy in amyotrophic lateral sclerosis. BMC Neurol 2006;6:17. [DOI] [PMC free article] [PubMed] [Google Scholar]
- 8.Buchanan CR, Pettit LD, Storkey AJ, Abrahams S, Bastin ME. Reduced structural connectivity within a prefrontal-motor-subcortical network in amyotrophic lateral sclerosis. J Magn Reson Imaging 2015;41:1342–1352. [DOI] [PubMed] [Google Scholar]
- 9.Bede P, Elamin M, Byrne S, et al. Basal ganglia involvement in amyotrophic lateral sclerosis. Neurology 2013;81:2107–2115. [DOI] [PubMed] [Google Scholar]
- 10.Westeneng H-J, Verstraete E, Walhout R, et al. Subcortical structures in amyotrophic lateral sclerosis. Neurobiol Aging 2015;36:1075–1082. [DOI] [PubMed] [Google Scholar]
- 11.Bede P, Bokde AL, Byrne S, et al. Multiparametric MRI study of ALS stratified for the C9orf72 genotype. Neurology 2013;81:361–369. [DOI] [PMC free article] [PubMed] [Google Scholar]
- 12.Westeneng HJ, Walhout R, Straathof M, et al. Widespread structural brain involvement in ALS is not limited to the C9orf72 repeat expansion. J Neurol Neurosurg Psychiatry 2016;87:1354–1360. [DOI] [PMC free article] [PubMed] [Google Scholar]
- 13.Huisman MHB, de Jong SW, van Doormaal PTC, et al. Population based epidemiology of amyotrophic lateral sclerosis using capture-recapture methodology. J Neurol Neurosurg Psychiatry 2011;82:1165–1170. [DOI] [PubMed] [Google Scholar]
- 14.Cedarbaum JM, Stambler N, Malta E, et al. The ALSFRS-R: a revised ALS functional rating scale that incorporates assessments of respiratory function. J Neurol Sci 1999;169:13–21. [DOI] [PubMed] [Google Scholar]
- 15.Beeldman E, Jaeger B, Raaphorst J, et al. The verbal fluency index: Dutch normative data for cognitive testing in ALS. Amyotroph Lateral Scler Front Degener 2014;15:388–391. [DOI] [PubMed] [Google Scholar]
- 16.Bakker LA, Schröder CD, Spreij LA, et al. Derivation of norms for the Dutch version of the Edinburgh cognitive and behavioural ALS screen. Amyotroph Lateral Scler Front Degener 2019;20:19–27. [DOI] [PubMed] [Google Scholar]
- 17.Abrahams S, Newton J, Niven E, Foley J, Bak TH. Screening for cognition and behaviour changes in ALS. Amyotroph Lateral Scler Front Degener 2014;15:9–14. [DOI] [PubMed] [Google Scholar]
- 18.Terada T, Miyata J, Obi T, et al. Frontal assessment battery and frontal atrophy in amyotrophic lateral sclerosis. Brain Behav 2017;7:e00707. [DOI] [PMC free article] [PubMed] [Google Scholar]
- 19.Raaphorst J, Beeldman E, Schmand B, et al. The ALS-FTD-Q: a new screening tool for behavioral disturbances in ALS. Neurology 2012;79:1377–1383. [DOI] [PubMed] [Google Scholar]
- 20.Kimura F, Fujimura C, Ishida S, et al. Progression rate of ALSFRS-R at time of diagnosis predicts survival time in ALS. Neurology 2006;66:265–267. [DOI] [PubMed] [Google Scholar]
- 21.Van Rheenen W, Van Blitterswijk M, Huisman MHB, et al. Hexanucleotide repeat expansions in C9ORF72 in the spectrum of motor neuron diseases. Neurology 2012;79:878–882. [DOI] [PubMed] [Google Scholar]
- 22.Verstraete E, Veldink JH, Mandl RCW, van den Berg LH, van den Heuvel MP. Impaired structural motor connectome in amyotrophic lateral sclerosis. PLoS One 2011;6:e24239. [DOI] [PMC free article] [PubMed] [Google Scholar]
- 23.van der Burgh HK, Schmidt R, Westeneng HJ, de Reus MA, van den Berg LH, van den Heuvel MP. Deep learning predictions of survival based on MRI in amyotrophic lateral sclerosis. Neuroimage Clin 2017;13:361–369. [DOI] [PMC free article] [PubMed] [Google Scholar]
- 24.Fischl B, van der Kouwe A, Destrieux C, et al. Automatically parcellating the human cerebral cortex. Cereb Cortex 2004;14:11–22. [DOI] [PubMed] [Google Scholar]
- 25.Desikan RS, Ségonne F, Fischl B, et al. An automated labeling system for subdividing the human cerebral cortex on MRI scans into gyral based regions of interest. Neuroimage 2006;31:968–980. [DOI] [PubMed] [Google Scholar]
- 26.Reuter M, Rosas HD, Fischl B. Highly accurate inverse consistent registration: a robust approach. Neuroimage 2010;53:1181–1196. [DOI] [PMC free article] [PubMed] [Google Scholar]
- 27.de Reus MA, van den Heuvel MP. Estimating false positives and negatives in brain networks. Neuroimage 2013;70:402–409. [DOI] [PubMed] [Google Scholar]
- 28.Bernal-Rusiel JL, Greve DN, Reuter M, Fischl B, Sabuncu MR; Alzheimer's Disease Neuroimaging Initiative. Statistical analysis of longitudinal neuroimage data with linear mixed effects models. Neuroimage 2013;66:249–260. [DOI] [PMC free article] [PubMed] [Google Scholar]
- 29.Cnaan A, Laird NM, Slasor P. Tutorial in biostatistics: using the general linear mixed model to analyse unbalanced repeated measures and longitudinal data. Stat Med 1997;16:2349–2380. [DOI] [PubMed] [Google Scholar]
- 30.Zalesky A, Fornito A, Bullmore ET. Network-based statistic: identifying differences in brain networks. Neuroimage 2010;53:1197–1207. [DOI] [PubMed] [Google Scholar]
- 31.von Elm E, Altman DG, Egger M, et al. The Strengthening the Reporting of Observational Studies in Epidemiology (STROBE) statement: guidelines for reporting observational studies. J Clin Epidemiol 2008;61:344–349. [DOI] [PubMed] [Google Scholar]
- 32.Menke RAL, Körner S, Filippini N, et al. Widespread grey matter pathology dominates the longitudinal cerebral MRI and clinical landscape of amyotrophic lateral sclerosis. Brain 2014;137:2546–2555. [DOI] [PMC free article] [PubMed] [Google Scholar]
- 33.Cardenas-Blanco A, Machts J, Acosta-Cabronero J, et al. Structural and diffusion imaging versus clinical assessment to monitor amyotrophic lateral sclerosis. Neuroimage Clin 2016;11:408–414. [DOI] [PMC free article] [PubMed] [Google Scholar]
- 34.Bede P, Hardiman O. Longitudinal structural changes in ALS: a three time-point imaging study of white and gray matter degeneration. Amyotroph Lateral Scler Front Degener 2018;19:232–241. [DOI] [PubMed] [Google Scholar]
- 35.Bede P, Omer T, Finegan E, et al. Connectivity-based characterisation of subcortical grey matter pathology in frontotemporal dementia and ALS: a multimodal neuroimaging study. Brain Imaging Behav 2018;12:1696–1707. [DOI] [PubMed] [Google Scholar]
- 36.Agosta F, Gorno-Tempini ML, Pagani E, et al. Longitudinal assessment of grey matter contraction in amyotrophic lateral sclerosis: a tensor based morphometry study. Amyotroph Lateral Scler 2009;10:168–174. [DOI] [PubMed] [Google Scholar]
- 37.Agosta F, Rocca MA, Valsasina P, et al. A longitudinal diffusion tensor MRI study of the cervical cord and brain in amyotrophic lateral sclerosis patients. J Neurol Neurosurg Psychiatry 2009;80:53–55. [DOI] [PubMed] [Google Scholar]
- 38.Keil C, Prell T, Peschel T, Hartung V, Dengler R, Grosskreutz J. Longitudinal diffusion tensor imaging in amyotrophic lateral sclerosis. BMC Neurosci 2012;13:141. [DOI] [PMC free article] [PubMed] [Google Scholar]
- 39.Schuster C, Kasper E, Machts J, et al. Longitudinal course of cortical thickness decline in amyotrophic lateral sclerosis. J Neurol 2014;261:1871–1880. [DOI] [PubMed] [Google Scholar]
- 40.Baldaranov D, Khomenko A, Kobor I, et al. Longitudinal diffusion tensor imaging-based assessment of tract alterations: an application to amyotrophic lateral sclerosis. Front Hum Neurosci 2017;11:1–8. [DOI] [PMC free article] [PubMed] [Google Scholar]
- 41.Schmidt R, de Reus MA, Scholtens LH, van den Berg LH, van den Heuvel MP. Simulating disease propagation across white matter connectome reveals anatomical substrate for neuropathology staging in amyotrophic lateral sclerosis. Neuroimage 2016;124(part A):762–769. [DOI] [PubMed] [Google Scholar]
- 42.Braak H, Brettschneider J, Ludolph AC, Lee VM, Trojanowski JQ, Del Tredici K. Amyotrophic lateral sclerosis: a model of corticofugal axonal spread. Nat Rev Neurol 2013;9:708–714. [DOI] [PMC free article] [PubMed] [Google Scholar]
- 43.Christidi F, Karavasilis E, Rentzos M, et al. Hippocampal pathology in amyotrophic lateral sclerosis: selective vulnerability of subfields and their associated projections. Neurobiol Aging 2019;84:178–188. [DOI] [PubMed] [Google Scholar]
- 44.Westeneng H-J, Debray TPA, Visser AE, et al. Prognosis for patients with amyotrophic lateral sclerosis: development and validation of a personalised prediction model. Lancet Neurol 2018;17:423–433. [DOI] [PubMed] [Google Scholar]
- 45.Shellikeri S, Karthikeyan V, Martino R, et al. The neuropathological signature of bulbar-onset ALS: a systematic review. Neurosci Biobehav Rev 2017;75:378–392. [DOI] [PMC free article] [PubMed] [Google Scholar]
- 46.Rajagopalan V, Pioro EP. Distinct patterns of cortical atrophy in ALS patients with or without dementia: an MRI VBM study. Amyotroph Lateral Scler Front Degener 2014;15:216–225. [DOI] [PubMed] [Google Scholar]
- 47.Agosta F, Ferraro PM, Riva N, et al. Structural brain correlates of cognitive and behavioral impairment in MND. Hum Brain Mapp 2016;37:1614–1626. [DOI] [PMC free article] [PubMed] [Google Scholar]
- 48.Lulé D, Bohm S, Müller HP, et al. Cognitive phenotypes of sequential staging in amyotrophic lateral sclerosis. Cortex 2018;101:163–171. [DOI] [PubMed] [Google Scholar]
- 49.Cox SR, Dickie DA, Ritchie SJ, et al. Associations between education and brain structure at age 73 years, adjusted for age 11 IQ. Neurology 2016;87:1820–1826. [DOI] [PMC free article] [PubMed] [Google Scholar]
- 50.Frodl TS, Koutsouleris N, Bottlender R, et al. Depression-related variation in brain morphology over 3 years: effects of stress? Arch Gen Psychiatry 2008;65:1156–1165. [DOI] [PubMed] [Google Scholar]
Associated Data
This section collects any data citations, data availability statements, or supplementary materials included in this article.
Data Availability Statement
The data that support the findings of this study are available via the corresponding author, on reasonable request. The reporting of this study conforms to the Strengthening the Reporting of Observational Studies in Epidemiology (STROBE) statement.31


