Abstract
Objective
To determine the impact of socioeconomic status (SES) on sudden unexpected death in epilepsy (SUDEP) rates.
Methods
We queried all decedents presented for medico-legal investigation at 3 medical examiner (ME) offices across the country (New York City, Maryland, San Diego County) in 2009 to 2010 and 2014 to 2015. We identified all decedents for whom epilepsy/seizure was listed as cause/contributor to death or comorbid condition on the death certificate. We then reviewed all available reports. Decedents determined to have SUDEP were included for analysis. We used median income in the ZIP code of residence as a surrogate for SES. For each region, zip code regions were ranked by median household income and divided into quartiles based on total population for 2 time periods. Region-, age-, and income-adjusted epilepsy prevalence was estimated in each zip code. SUDEP rates in the highest and lowest SES quartiles were evaluated to determine disparity. Examined SUDEP rates in 2 time periods were also compared.
Results
There were 159 and 43 SUDEP cases in the lowest and highest SES quartiles. ME-investigated SUDEP rate ratio between the lowest and highest SES quartiles was 2.6 (95% confidence interval [CI] 1.7–4.1, p < 0.0001) in 2009 to 2010 and 3.3 (95% CI 1.9–6.0, p < 0.0001) in 2014 to 2015. There was a significant decline in overall SUDEP rate between the 2 study periods (36% decrease, 95% CI 22%–48%, p < 0.0001).
Conclusion
ME-investigated SUDEP incidence was significantly higher in people with the lowest SES compared to the highest SES. The difference persisted over a 5-year period despite decreased overall SUDEP rates.
People with epilepsy (PWE) have an increased rate of premature death compared to the general population.1,2 Sudden unexpected death in epilepsy (SUDEP), defined as the “sudden, unexpected, witnessed or unwitnessed, nontraumatic and nondrowning death in patients with epilepsy, with or without evidence for a seizure and excluding documented status epilepticus, in which postmortem examination does not reveal a toxicological or anatomic cause of death,”3 is perhaps the leading disease-related cause of mortality.4 Incidence of SUDEP cases per 1,000 person-years within the epilepsy population varies from 0.09 in newly diagnosed patients to 9.3 in epilepsy surgery candidates. Risk factors identified in case-control studies include active epilepsy, especially frequent tonic-clonic seizures, and lack of nocturnal supervision.5 Interventions to improve seizure control such as the addition of efficacious antiseizure drugs (ASDs) or successful epilepsy surgery are associated with reduced SUDEP risk.6–8
Several factors can influence seizure control in PWE, including the ability to obtain ASDs, adherence to drug regimens, and access to specialized care to provide medical and surgical treatments for treatment-resistant seizures. However, in the United States, there are disparities in access to epilepsy care and ASDs that may limit the ability of people with low socioeconomic status (SES)9 and those without health insurance or who are underinsured from receiving optimal care.10–13 Furthermore, other factors associated with a downward trajectory in SES such as mental illness and substance abuse can interfere with the ability of PWE to self-manage their disorder.14,15 Population-based studies found that the risk of all-cause mortality is higher among PWE living in zip codes with lower median income,16 but no study has examined the relationship between socioeconomic factors and SUDEP rates, a cause of death affected by seizure control. In this study, we studied the impact of community SES on the rates of epilepsy and SUDEP mortality in 3 diverse geographic regions in the United States by analyzing PWE presenting to medical examiner (ME) offices for death investigation in low- and high-income geographic regions. We further examined changes in mortality rates over time.
Methods
We queried the database of all decedents who underwent medico-legal investigation at 3 ME offices—New York City (NYC), San Diego County (SDC), and Maryland (MD)—for two 2-year periods, January 1, 2009, through December 31, 2010, and January 1, 2014, through December 31, 2015. ME offices were chosen because of their relatively large catchment area, experience with clinical research, and use of professional medico-legal death investigators for scene investigation. Those ME offices are the only authority responsible of medico-legal investigations of all deaths within their jurisdiction that are sudden and unexpected for individuals in apparent good health or that may have been caused or hastened by an injury or poisoning or deaths that occurred while in law enforcement custody or in a state or county institution.17 All deaths in individuals for whom epilepsy or seizure was listed as a cause or contributor of death or comorbid condition were abstracted for further review. All investigator report narratives, autopsy results (when performed), and toxicology reports were independently reviewed by 2 epileptologists with experience in epilepsy death adjudication (D.F. and O.D.). Appropriate deaths were classified as definite SUDEP, definite SUDEP plus, probable SUDEP, probable SUDEP plus, possible SUDEP, and near SUDEP based on previously published criteria.18 When there was a disagreement as to the cause of death or SUDEP classification, a third reviewer (E.J.D.) reviewed the case, and a consensus determination was reached. Decedents were excluded from further analysis if their residence was unknown or they resided outside the jurisdiction of the ME office, if they did not have definite or probable epilepsy according to the criteria set forth by the International League Against Epilepsy Epidemiology Commission,19 and if there was insufficient information to determine the cause of death. For all included decedents, demographic information, including age, sex, race/ethnicity, and postal code (zip code) of residence, was abstracted from the ME records. Epilepsy etiology, ASDs and history of medication nonadherence (as determined from investigator notes or absence of ASDs at time of death), comorbid medical conditions, substance abuse history, height, and weight were also abstracted from the ME records. Charlson comorbidity index20 and body mass index (BMI) were calculated for each participant.
Determinants of SES
The decedent's zip code of residence was used as a surrogate for community SES. Zip codes in each ME region were ranked by median household income (source: American Community Survey, 2011–201521). For each of the 2 time periods under review, the ranked zip codes were assigned to 4 groups of equal population based on estimates of zip code population (for 2009–2010, source: United States Census Bureau, 201022; for 2014–2015, source: American Community Survey 2011–2015, 5-Year Population Estimate21). Each decedent was then assigned a zip code–based SES quartile.
Estimates of epilepsy prevalence and SUDEP rate per geographic region and SES quartile
We obtained estimates of epilepsy prevalence according to region, age, and household income from the National Health Interview Survey for 2011 and 2015 (source: Centers for Disease Control and Prevention [CDC], National Center for Health Statistics23) and estimates of zip code–specific demographics and income data from the Census22 and American Community Survey.21 The estimated epilepsy population for each zip code was calculated by applying age (adult and children), US geographic region (northeast for NYC, south for MD, and west for SDC), and income bracket–specific epilepsy prevalence estimates from the National Health Interview Survey from each time period to zip code–specific demographics. Age-, region-, and income-adjusted epilepsy population estimates from each zip code were combined to determine the estimated epilepsy population for each SES quartile for each ME office jurisdiction for the 2 time periods studied.
Estimates of SUDEP rate per geographic region
The SUDEP rate per 1,000 patient-years was determined for each 2-year period for each ME region and SES quartile area by dividing the observed number of definite or probable SUDEP cases (including SUDEP plus and near SUDEP) by the estimated number of individuals with epilepsy in each ME region and SES quartile group of zip codes (assuming that the total epilepsy population was stable over the 2-year period). The 95% confidence intervals (CIs) for the rate estimate were determined with the Fisher exact test.
Statistical analysis
Differences in demographic, clinical, and biometric variables between decedents in the lowest and highest SES quartile were examined with the independent-sample t test for age, the Mann-Whitney U test for Charlson Comorbidity Index and BMI, and the χ2 test for categorical variables. Hypothesis testing was performed with 2-tailed tests when relevant. Statistical analyses were performed with OpenEpi (openepi.com) and SPSS Statistics (version 23; IBM, Armonk, NY). Holm-Bonferroni correction was applied to adjust p values in comparisons of multiple comorbid conditions.
The relationship of community SES with SUDEP rate for each of the 2 time periods was examined by calculating the conditional maximum likelihood estimate of the rate ratio (RR) for the ME region-adjusted SUDEP rate between the lowest and highest SES quartile groups of zip codes. Differences in ME region-adjusted SUDEP rates between the 2009 to 2010 and 2014 to 2015 were also examined by calculation of the RR between the 2 time periods. As a sensitivity analysis to further assess the impact of community SES on ME-investigated SUDEP incidence, we performed zero-inflated negative binomial regression analysis with number of SUDEP cases per zip code as the dependent variable and estimated epilepsy population as the exposure variable. Zip code median household income, ME office (MD was the reference category), and year group (2009–2010 was the reference category) were the predictor variables, and total zip code population was the inflation term. Incident RRs (IRRs) were calculated from the regression coefficients. Modeling was performed in Stata 15 (StataCorp, College Station, TX).
There are multiple sources of potential error and bias in using data derived from census estimates and ME-investigated SUDEP cases, including misclassification of community SES quartile based on census estimates of zip code median household income with wide CIs and the known underestimate of SUDEP rates with the use of death investigation data.24,25 To determine the impact of such errors arising from the methodologic limitations of the study on the magnitude and direction of the observed effects, we performed probabilistic bias analysis.26–28 To assess the influence of misclassification error (assigning the wrong SES quartile to a zip code) on the association between community SES quartile and estimated SUDEP rates, we performed Monte Carlo simulation. In each iteration (of 100,000), a zip code was assigned a median household income drawn at random from a range of values (in $100 intervals assuming a uniform distribution) bounded by the point estimate of median income plus or minus the estimated error margin reported in the American Community Survey data for that zip code. SES quartiles were determined for each iteration as outlined above for each ME office region. Adjusted SUDEP rate for each simulated quartile was calculated as above. Subsequent simulation (1 million iterations) randomly sampled from simulation-derived SUDEP rates from the lowest and highest community SES quartiles results from each ME office to calculate a range of bias-adjusted overall adjusted IRRs and 95% CIs. This simulation was performed independently for the 2009 to 2010 and 2014 to 2015 time periods.
Prior studies have shown that 25% to 36% of SUDEP cases cannot be identified through review of ME records.24,25 To determine the potential impact of incomplete SUDEP ascertainment on changes in SUDEP rate over the 2 time periods, simulations were run (2,040 iterations for 51 possible SUDEP counts from 2009 to 2010 and 40 possible SUDEP counts from 2014 to 2015) in which the true SUDEP count for each ME region and time period was randomly sampled from a uniform distribution of 1.33 − 1.56 × the ME-investigated SUDEP count and the ME-office adjusted RR between the 2 time periods was calculated as described above to yield a range of possible ratios and 95% CIs that account for information bias. Simulations for bias analyses were performed in R (version 3.5.2; R Foundation for Statistical Computing, Vienna, Austria) and MATLAB (version 2018b, The MathWorks, Natick, MA).
Standard protocol approvals, registrations, and patient consents
This study was determined to be exempt by the New York University Institutional Review Board because the decedents do not qualify as human participants. The research protocol was approved by each of the local ME offices.
Data availability
Anonymized data will be shared by request from any qualified investigator.
Results
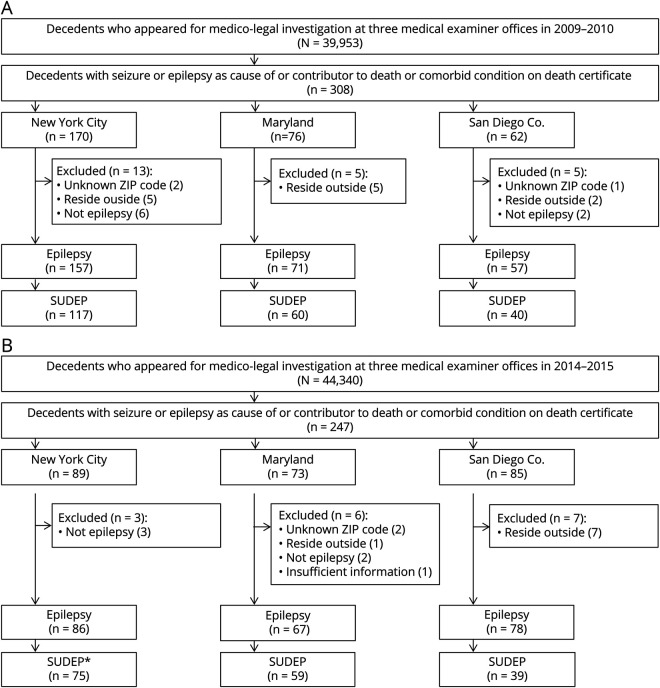
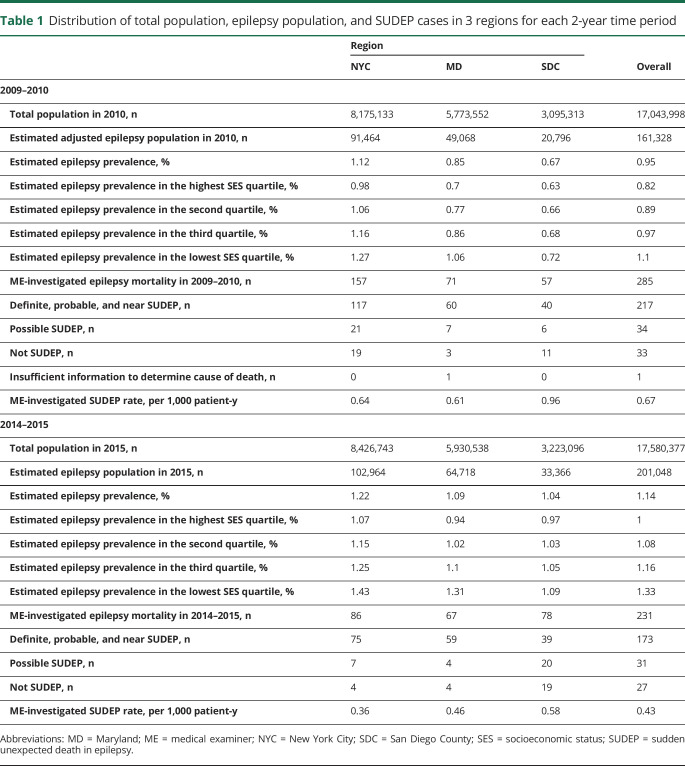
There were 84,293 cases reviewed between 2009 to 2010 and 2014 to 2015 in the 3 ME offices. Seizure or epilepsy was listed as cause or contributor of death or comorbid condition for 555 decedents. Five decedents with unknown zip code of residence and 20 decedents who lived outside of ME jurisdiction areas were excluded. Thirteen residents without epilepsy and 1 without sufficient information to determine epilepsy on expert review were also excluded from the study (figure 1). Among the remaining residents with epilepsy, 389 were determined to be SUDEP cases (including definite, definite plus, probable, probable plus, near, and near plus; table 1) and were included in further analysis of SUDEP rates. In the 3 geographic regions studied, the estimated epilepsy prevalence was 0.95% in 2009 to 2010 and 1.14% in 2014 to 2015.
Figure 1. (A and B) Flowchart for selection of the decedents.
*Sudden unexpected death in epilepsy (SUDEP) represents definite, probable, and near SUDEP cases (including SUDEP plus).
Table 1.
Distribution of total population, epilepsy population, and SUDEP cases in 3 regions for each 2-year time period
SES and SUDEP demographic and clinical factors
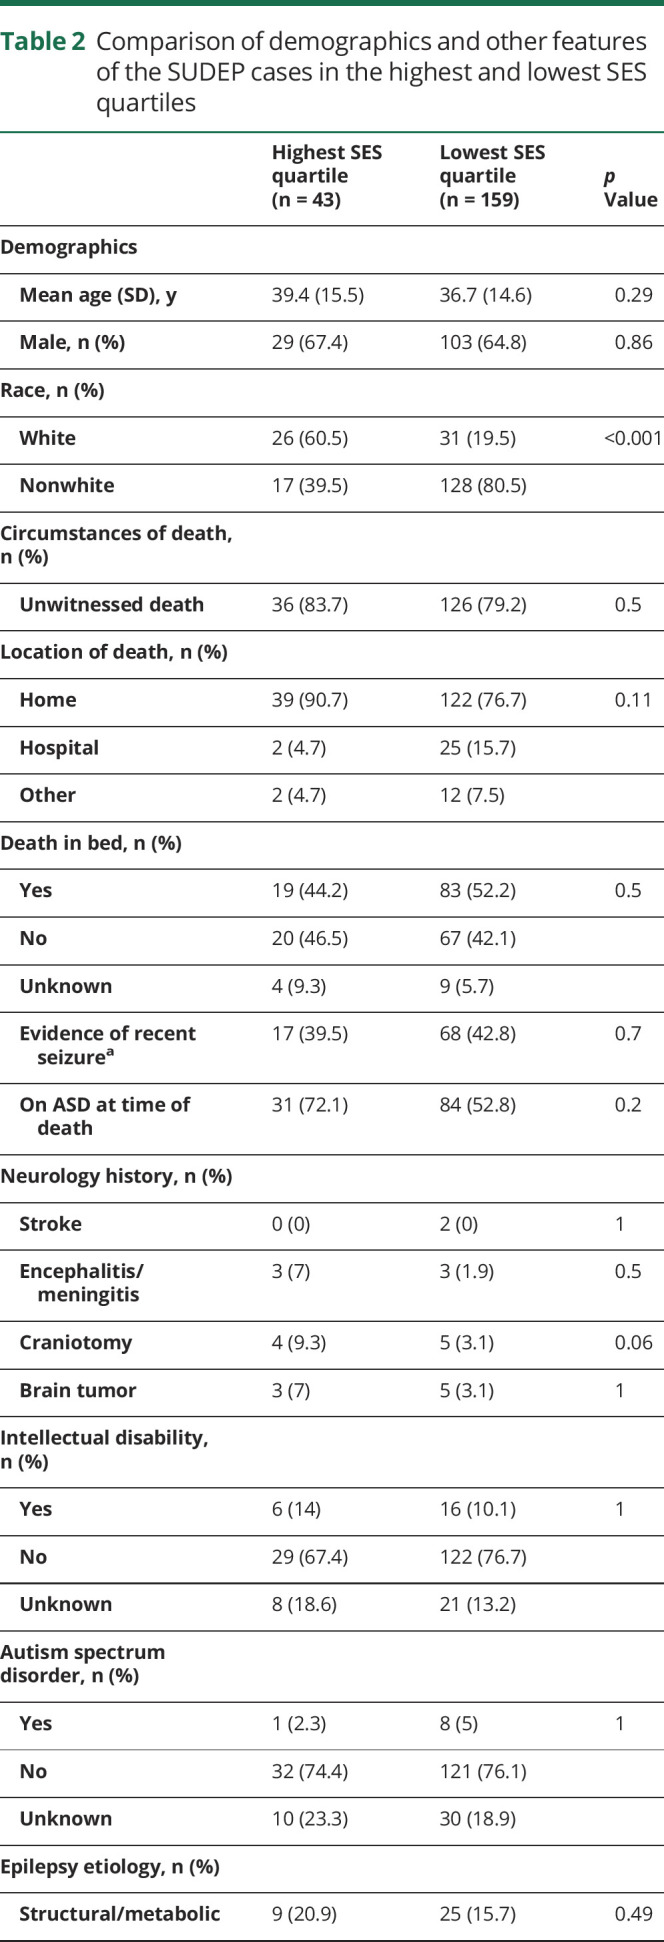
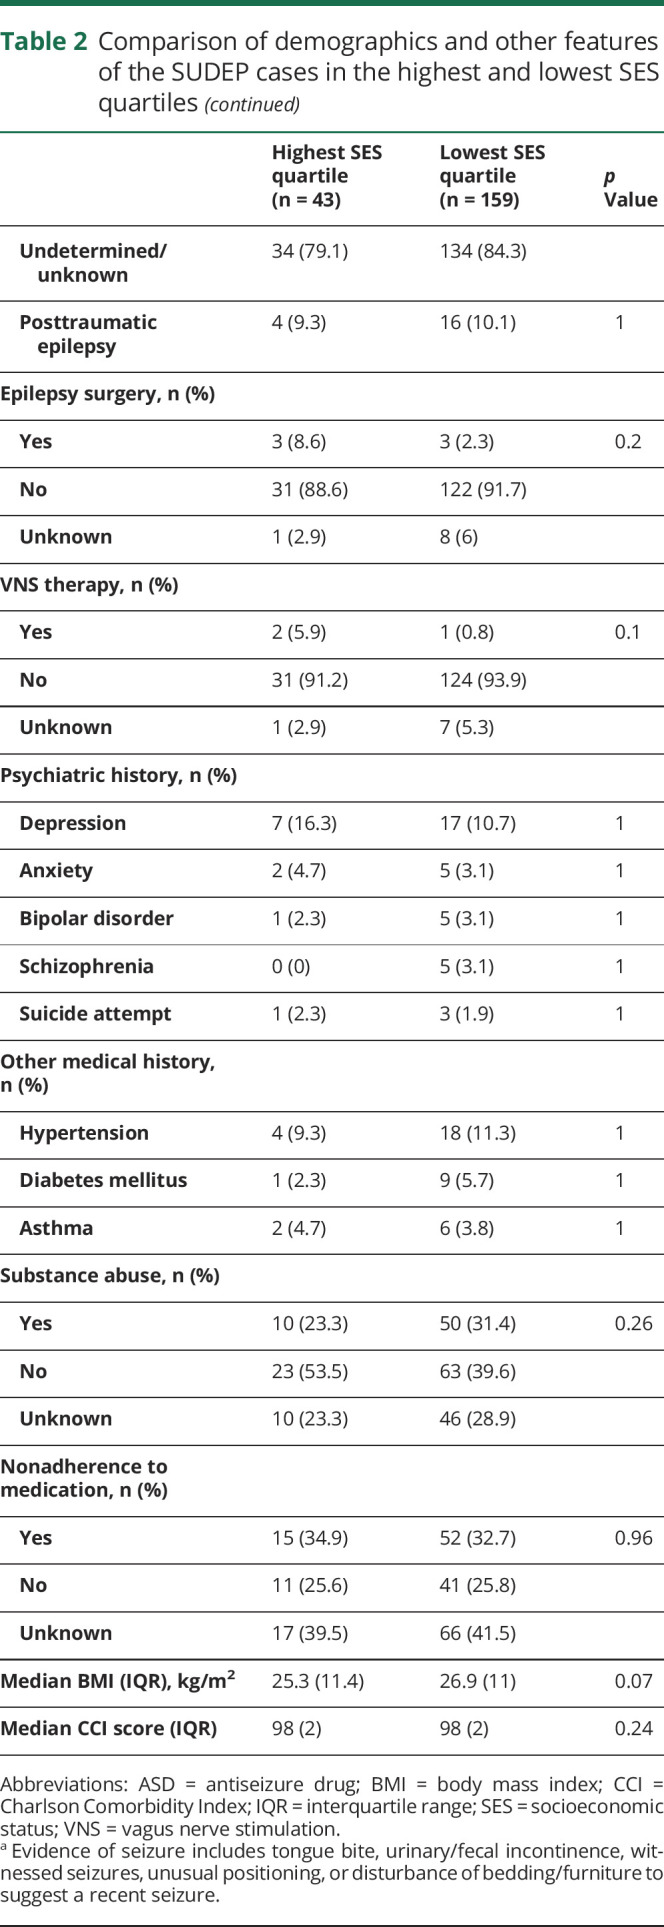
The mean age of all SUDEP cases (including definite, definite plus, probable, probable plus, near, and near plus) was 38.1 ± 14.7 years (range 4 months–81 years). There were 159 SUDEP cases in the lowest SES quartile zip codes and 43 SUDEP cases in the highest SES quartile. A comparison of demographic and clinical factors between SUDEP cases in the lowest and highest SES quartile zip codes is shown in table 2. There were no differences in decedents' age, sex, circumstances of death, substance abuse history, reported nonadherence to medication, comorbid conditions, epilepsy etiology, BMI, intellectual disability, and Charlson comorbidity Index between the highest and lowest SES quartile zip codes. A lower proportion of SUDEP decedents were identified as white in the lowest SES quartile compared to the highest (19.5% vs 60.5%, p < 0.001).
Table 2.
Comparison of demographics and other features of the SUDEP cases in the highest and lowest SES quartiles
SES and estimated SUDEP rate over time
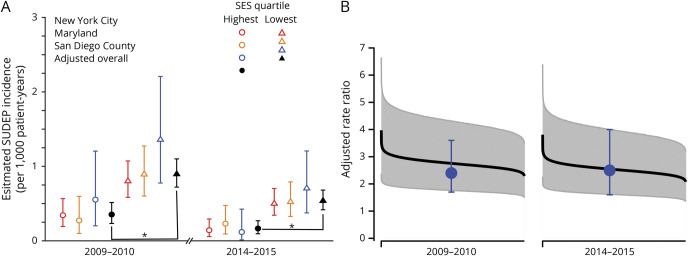
The SUDEP RR between the lowest and highest community SES quartiles was 2.6 (95% CI 1.7–4.1, p < 0.0001) in 2009 to 2010 and 3.3 (95% CI 1.9–6.0, p < 0.0001) in 2014 to 2015 (figure 2A). Probabilistic bias analysis to assess the influence of zip code SES quartile misclassification error revealed a mean bias-adjusted RR between the lowest and highest community SES quartiles of 2.8 (range 2.0–4.0, lowest 95% CI 1.3, p < 0.001) in 2009 to 2010 and 2.5 (range 1.8–3.9, lowest 95% CI 1.2, p < 0.001) in 2014 to 2015 (figure 2B).
Figure 2. Plot of estimated SUDEP incidence in the highest and lowest SES quartiles.
Estimated incidence of sudden unexpected death in epilepsy (SUDEP) per 1,000 patient-years is shown for New York City (red), Maryland (orange), and San Diego County (blue) medical examiner (ME) offices and adjusted overall incidence (black) for zip codes in the highest (circles) and lowest (triangle) socioeconomic status (SES) quartiles for both of the 2-year periods reviewed. Error bars represent 95% confidence intervals (CIs). Overall estimated SUDEP incidence adjusted for ME office was significantly higher in the lowest-income zip codes compared to the highest-income zip codes in 2009 to 2010 (rate ratio [RR] 2.6, 95% CI 1.7–4.1) and 2014 to 2015 (RR 3.3, 95% CI 1.9–6.0). (B) Plot of the range of SUDEP RRs and 95% CIs between the lowest and highest SES quartiles derived from probabilistic bias analysis to account for classification errors in attribution of community household income from US Census data. Results of 1 million simulations are ordered from highest to lowest RRs for 2009 to 2010 (left) and 2014 to 2015 (right). Blue circles and error bars represent observed SUDEP RRs and 95% CIs in this study. Even accounting for the imprecision of determining household income for a particular zip code using US Census data, a positive association remains between low community SES and SUDEP rate.
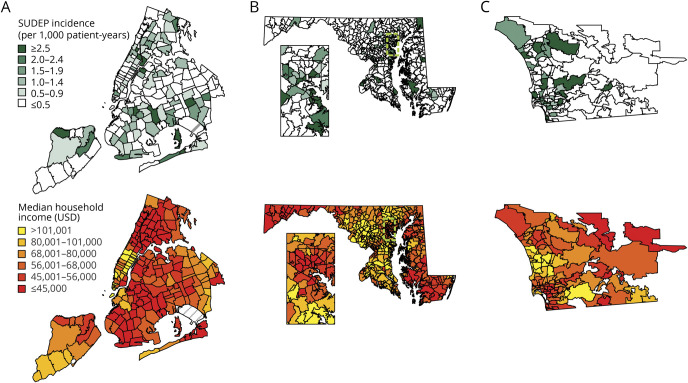
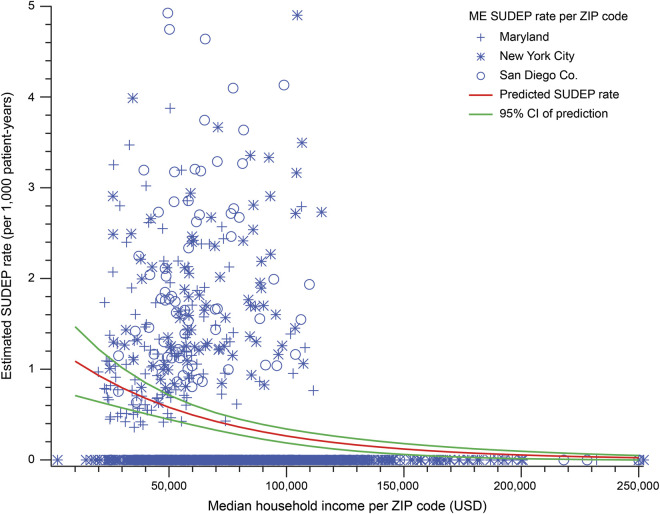
The geographic distribution of SUDEP rates in all zip codes compared to the geographic distribution of median household income in the 3 regions is shown in figure 3. We next modeled the relationship between community SES and ME-investigated SUDEP counts per zip code using zero-inflated negative binominal regression analysis. Zip code median household income (per $10,000) was an independent predictor of SUDEP (IRR 0.85, 95% CI 0.81–0.90, p < 0.001). ME office (NYC: IRR 0.62, 95% CI 0.47–0.81, p < 0.001; SDC: IRR 1.76, 95% CI 1.32–2.34, p < 0.001) and time period (2014–2015: IRR 0.77, 95% CI 0.63–0.95, p = 0.015) were also significant predictors. A plot of the predicted ME-investigated SUDEP rate as a function of zip code median household income is shown in figure 4.
Figure 3. Geographic distribution of estimated SUDEP rates and median household income in all zip codes of 3 regions.
Geographic distribution of estimated sudden unexpected death in epilepsy (SUDEP) rate per zip code based on medico-legal investigation (top) and median household income per zip code (bottom) in 2009 to 2010. (A) New York City medical examiner (ME) cases. (B) Maryland State ME cases with inset (cyan dashed lines) showing Baltimore and surrounding area. (C) San Diego County ME cases. In each region, SUDEP incidence is often higher in zip code areas with lower median household income.
Figure 4. Scatterplot of estimated SUDEP rates and median household incomes in all zip codes of 3 regions.
Scatterplot of the observed estimated ME-investigated sudden unexpected death in epilepsy (SUDEP) rates per zip code vs zip code median household income for both 2009 to 2010 and 2014 to 2015 for the 3 medical examiner (ME) offices (blue markers). Overlaid is the SUDEP rate (solid red line) as a function of median household income predicted by the regression model (with 95% confidence interval [CI] as a dashed line). There is a decrease in observed and predicted ME-investigated SUDEP rate with increasing community socioeconomic status.
Every sudden, unexpected death should be reported to these ME offices regardless of SES, but ME offices may waive to investigate some deaths on the basis of their subsequent review of the circumstances surrounding the death. Because there is inherent subjectivity in the application of death investigation criteria, there is some potential for systematic bias in which cases undergo full investigation. While not all ME offices log sufficient details about these waived cases to assess the degree of such bias, we did have access to prospectively tracked waived cases in SDC to estimate disparities in which cases were investigated. Therefore, we analyzed all waived cases with a history of epilepsy for which the manner of death was natural or undetermined in SDC from 2014 to 2018 that the ME chose not to investigate. Among these 176 waived cases, there were 38% more decedents from the highest SES quartile compared to the lowest SES quartile. Even when adjusted for this degree of potential bias in case ascertainment, the SUDEP RR between 2 quartiles remained higher in the lowest compared to the highest SES quartile (RR 1.8, 95% CI 1.2–2.7) in 2009 to 2010 and 2014 to 2015 (RR 2.4, 95% CI 1.5–3.9). The overall rate of epilepsy-related deaths investigated by the ME was 0.88 per 1,000 patient-years (95% CI 0.79–0.99) in 2009 to 2010 and 0.57 per 1,000 patient-years (95% CI 0.50–0.65) in 2014 to 2015. Investigated epilepsy deaths were significantly decreased despite an overall increase in the number of total ME-investigated deaths in each of the ME offices between the 2 study periods (NYC: 14,189 vs 14,809; MD: 20,339 vs 23,563; SDC: 5,425 vs 5,968). The rate of epilepsy-related death investigations by the ME was significantly higher in the lowest SES quartile zip codes compared to the highest quartile in 2009 to 2010 (RR 2.4, 95% CI 1.7–3.6, p < 0.0001) and 2014 to 2015 (RR 2.5, 95% CI 1.6–3.9, p < 0.0001).
The overall ME-investigated SUDEP rate was 0.67 per 1,000 patient-years (95% CI 0.59–0.77) in 2009 to 2010 and 0.43 per 1,000 patient-years (95% CI 0.37–0.50) in 2014 to 2015. There was a significant decline in the SUDEP rate between the 2 time periods (36% reduction in rate, 95% CI 22%–48%, p < 0.0001) (figure 5). The influence of incomplete SUDEP case ascertainment on observed changes in ME-investigated SUDEP rates between the 2 time periods was assessed with simulation. The range of relative reduction in SUDEP rates observed in the simulations was 25% to 45% between the 2009 to 2010 and 2014 to 2015 time periods (lowest 95% CI 11%).
Figure 5. Plot of estimated overall SUDEP rates based on medico-legal investigation.
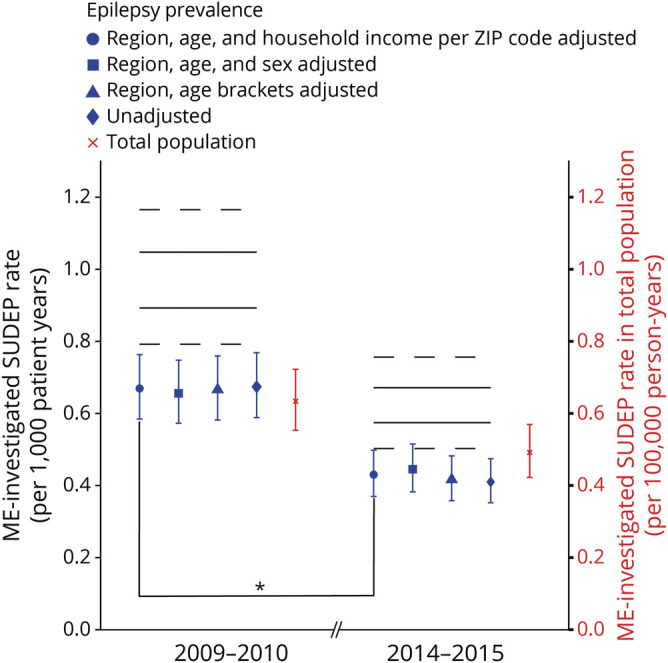
Plot of overall medical examiner (ME)–investigated sudden unexpected death in epilepsy (SUDEP) rates per 1,000 patient-years according to estimated epilepsy prevalence (blue) and SUDEP rate in total population per 100,000 person-years (red). Error bar represents 95% confidence intervals (CIs). ME-investigated SUDEP rate per 1,000 patient-years was 0.67 (95% CI 0.59–0.77) in 2009 to 2010 and 0.43 (95% CI 0.37–0.50) in 2014 to 2015 based on region, age, and household income per zip code–adjusted epilepsy prevalence. There was a decline in the SUDEP rate between the 2 time periods (36% decrease in rate, 95% CI 22%–48%, p < 0.0001). Solid black lines represent the highest and lowest values of expected SUDEP incidence in epilepsy population according to probabilistic bias analysis accounting for incomplete SUDEP ascertainment by ME offices; dashed black lines represent the highest and lowest CIs of those values.
Discussion
In this geographically diverse population-based study of deaths in PWE presenting for medico-legal investigation, the ME-investigated SUDEP rate was >2 times higher among PWE living in the lowest-income communities compared to the highest-income communities. The disparity persisted over a 5-year time period despite a significant decrease in the overall ME-investigated SUDEP rate in 2014 to 2015 compared to 2009 to 2010. There was no difference in age, ASD adherence, substance abuse history, or comorbidity between SUDEP decedents in the lowest and highest income zip codes that could explain this disparity. The nonwhite population was higher in the lowest income zip codes compared to the highest income zip codes. We could not adjust the estimates of prevalent epilepsy population for race. Epilepsy-related deaths in the black population are higher compared to white and Hispanic populations.29 The white population made up 11.6% to 12.7% of the people in poverty in 2014 to 2015 CDC data. Thus, the disparity in race distribution may reflect the income disparity in general population or could be a cofounder in our results.
There are several limitations to this study. Because the SUDEP rates were calculated on the basis of ME investigation and coding of death certificates, we very likely did not ascertain all SUDEPs in the ME catchment area; the observed SUDEP rate of 0.33 to 0.66 per 1,000 patient-years is lower than the ≈1 per 1,000 patient-years reported in population-based studies where medical and vital records are linked.24,30 Several factors may influence case ascertainment. While in each of these ME offices, all sudden deaths occurring outside the hospital or within 24 hours of hospital admission are subject to ME investigation, a death investigation may be waived if the ME office feels the death was expected. In addition, epilepsy or seizures had to be listed among the causes or contributors to death or relevant comorbid conditions in the ME records to identify decedents. MEs and coroners may underrecognize the role of epilepsy as a cause of sudden expected death and may not feel that epilepsy was significantly related to the cause of death to list.25,31 Moreover, there may be failure to obtain a history of seizures or epilepsy due to insufficient access to medical history of the decedent. We reviewed all 2014 to 2015 SDC ME cases with a known history of seizure/epilepsy but for which seizure/epilepsy was not mentioned in the death certificate, and none were determined to be SUDEP. We prospectively analyzed all 2016 MD ME cases with a history of seizure/epilepsy; we identified 28 definite/probable SUDEP cases and seizure/epilepsy was not mentioned on the death certificate in 17.9% (5 of 28). In a previous nationwide study from Sweden, epilepsy was not listed in the death certificate in 36.4% of SUDEP cases.24 While we had the opportunity to review waived cases with a history of seizure/epilepsy in the SDC ME office, no SUDEP cases were identified; waived cases in NYC and MD were unavailable. We also did not identify cases with SUDEP who died outside their home jurisdiction and excluded those who died within but did not reside within the jurisdiction. Taking all of this into account, there may be more missing cases in 1 SES group that affected our result. Furthermore, our estimate of the prevalent epilepsy population is extrapolated from CDC telephone surveys and US Census data. While we adjusted for factors associated with epilepsy prevalence such as region, age, and household income, the inherent imprecision in these estimates could influence our results. Another study limitation is using median household income of zip code of residence (community SES) as a surrogate instead of the real income of the decedent. We used income level as only a marker for SES because of limited data about other SES-determining factors, including decedents' education and occupation. In addition, because records reviewed are those used only for medico-legal investigation, we lack information about key sociodemographic factors that may affect access to care such as insurance status. We assumed that middle-income communities (second and third SES quartiles) include a greater diversity of SES status and that community SES would be less likely to reflect individual SES, so in the primary analysis, we examined only the lowest and highest SES quartiles. However, including all zip codes in our model in the secondary analysis still yielded a significant impact of community household income on observed SUDEP rates despite this greater risk of misclassification error in middle-income zip codes (figure 4). Finally, assessment of community SES is limited by the inherent imprecision of US Census–based survey data on income. When we accounted for this error using probabilistic bias analysis, ME-investigated SUDEP rates remained significantly higher in the lowest SES communities compared to the highest SES communities.
Several reasons may exist for the disparity in SUDEP rates in low- and high-income communities. Access to care, especially specialty care, and ASDs is lower among PWE with lower SES.12,32,33 Uninsured PWE had significantly fewer outpatient and neurologist visits with higher ASD costs compared to those with private insurance in the United States.34 Knowledge and awareness of epilepsy were found to be low in low-income populations, which could be contributory to the disparity.35,36 Some studies have shown that disparities in access to specialty care are lower in communities with comprehensive epilepsy centers.10,12 However, disparities in SUDEP rates existed in NYC where there are 9 level 3 or 4 epilepsy centers,37 suggesting that disparities in disease outcomes may exist. Our findings are consistent with studies that found that living in low-income communities is associated with increased mortality for many chronic diseases.38,39 PWE in low-income communities may live there in part as a result of disability that could be related to refractory epilepsy or underlying cause of epilepsy. The SUDEP risk is higher in patients with refractory epilepsy, especially in those with continuing convulsive seizures.5 Even though there was no difference between the 2 groups in intellectual disability, we were not able to assess disability status, seizure frequency, or seizure severity for a majority of the decedents. In addition, people in poorer communities may undergo medico-legal death investigation at a higher rate than those living in more affluent communities. While we did find a potential disparity between the lowest and highest SES quartiles in how often an ME office declined to investigate natural epilepsy deaths, even when we accounted for this 38% higher waived case rate in the highest SES quartile in our estimates, the rate of SUDEP remained higher in the lowest SES quartile group.
We observed a decrease in the estimated SUDEP rate between 2009 to 2010 and 2014 to 2015. We performed probabilistic bias analysis to assess the impact of incomplete SUDEP ascertainment based on reported estimates24,25 on our observed results and found that the direction of temporal trends in SUDEP rates remained consistent. It is also unlikely that this decrease is due to changes in case ascertainment or overall case volume or staffing. There were no substantive changes in investigation criteria of ME offices during the examined time course. The 3 ME offices participating in this study were actively involved in SUDEP research collaborations since 2012 and therefore should have increased awareness of epilepsy as a cause of or contributor to sudden death and would predict improved case ascertainment between the 2 study periods. Despite this bias toward improved recognition of SUDEP cases, we found fewer SUDEP cases regardless of increased epilepsy prevalence and overall increased numbers of autopsies in the ME offices. Potential causes of this decreased rate of SUDEP are not well understood but may reflect an increased awareness of SUDEP among physicians and PWE between the 2 study periods due to educational efforts40–43 and increased federal and foundation funding for prevention of SUDEP.44,45 Perhaps a better understanding by patients, caregivers, and providers of modifiable SUDEP risk factors such as seizure frequency and nocturnal supervision has translated to reduced SUDEP rates. Another possibility is that SUDEP rates decreased because of improved access to specialized epilepsy centers by patients who were previously uninsured or underinsured after the introduction of the Affordable Care Act in March 2010. Expansion of Medicaid programs to increase coverage is associated with improved access to care and decreased mortality.46 The 3 ME offices in this study were in states that elected to receive federal funds to expand Medicaid eligibility under the Affordable Care Act in 2014. To assess the impact of health care reform on SUDEP rates, future studies should include ME offices in states that did not participate in Medicaid expansion. However, despite possible improved care access, the disparities in SUDEP rates between the poorest and wealthiest persisted, suggesting that other factors besides insurance and access influence the impact of community SES on epilepsy mortality.
We found that community SES has a significant impact on SUDEP rates in 3 geographically diverse communities in the United States. Like other causes of premature mortality in epilepsy, SUDEP risk is likely associated with poverty secondary to poor seizure control due to reduced access to specialty care, medications, and adequate disease self-management. Further studies are needed to understand the causes of disparities in epilepsy mortality in poorer communities to identify potential targets for intervention.
Acknowledgment
The authors thank Rosemarie Kobau, PhD, and Mathew Zack, PhD, for providing the National Health Interview Survey data.
Glossary
- ASD
antiseizure drug
- BMI
body mass index
- CDC
Centers for Disease Control and Prevention
- CI
confidence interval
- IRR
incident rate ratio
- MD
Maryland
- ME
medical examiner
- NYC
medical examiner
- PWE
people with epilepsy
- RR
rate ratio
- SDC
San Diego County
- SES
socioeconomic status
- SUDEP
sudden unexpected death in epilepsy
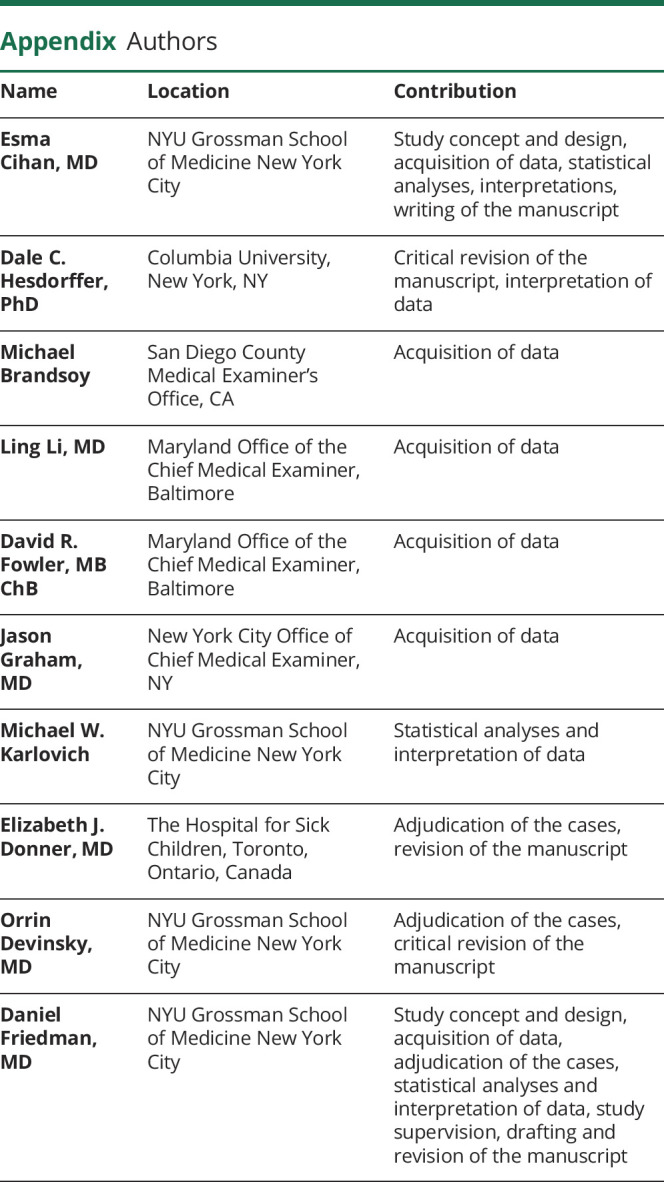
Appendix. Authors
Study funding
This study was funded by Finding a cure for Epilepsy and Seizures. D.F. was supported in part by the New York University Clinical and Translational Science Award grant UL1 TR001445 from the National Center for Advancing Translational Sciences, NIH.
Disclosure
E. Cihan reports no disclosures. D. Hesdorffer reports serving as an associate editor of Epilepsia and an advisor to the Mount Sinai Injury Prevention Center, has a subcontract from the Epilepsy Study Consortium, and serves as a consultant for a Mindfulness study funded by Patient-Centered Outcomes Research Institute. I. M. Brandsoy, L. Li, D. Fowler, J. Graham, and M. Karlovich report no disclosures. E. Donner received grant support from the Ontario Brain Institute. O. Devinsky has received grant support, paid to his institutions, from GW Pharmaceuticals Ltd, Novartis, PTC Pharmaceuticals, Marinus, and Zogenix and has equity interest in Qstate Biosciences, Tilray/Privateer Holdings, Tevard, Rettco, Empatica, Engage, Receptor Life Sciences, Silver Spike, and Egg Rock/Papa & Barkley. He has received consulting fees from Cavion and GW Pharma. He is the principal investigator of NASR and receives funding from the National Institute of Neurological Disorders and Stroke (NINDS) Center for SUDEP Research, as well as other NINDS, National Institute of Mental Health, CDC, Department of Defense, and Multidisciplinary Undergraduate Research agencies. D. Friedman receives salary support for consulting and clinical trial–related activities performed on behalf of The Epilepsy Study Consortium, a nonprofit organization. Dr. Friedman receives no personal income for these activities. NYU receives a fixed amount from the Epilepsy Study Consortium toward Dr. Friedman's salary. Within the past year, The Epilepsy Study Consortium received payments for research services performed by Dr. Friedman from Biogen, Crossject, Engage Pharmaceuticals, Eisai, SK Life Science, Takeda, Xenon, and Zynerba. He has also served as a paid consultant for Eisai. He has received travel reimbursement from Medtronics and the Epilepsy Foundation. He receives research support from the CDC, NINDS, Epilepsy Foundation, Empatica, Epitel, UCB, Inc, and Neuropace. He serves on the scientific advisory board for Receptor Life Sciences. He holds equity interests in Neuroview Technology and Receptor Life Sciences. Go to Neurology.org/N for full disclosures.
References
- 1.Levira F, Thurman DJ, Sander JW, et al. Premature mortality of epilepsy in low- and middle-income countries: a systematic review from the Mortality Task Force of the International League against Epilepsy. Epilepsia 2017;58:6–16. [DOI] [PMC free article] [PubMed] [Google Scholar]
- 2.Thurman DJ, Logroscino G, Beghi E, et al. The burden of premature mortality of epilepsy in high-income countries: a systematic review from the Mortality Task Force of the International League Against Epilepsy. Epilepsia 2017;58:17–26. [DOI] [PMC free article] [PubMed] [Google Scholar]
- 3.Nashef L. Sudden unexpected death in epilepsy: terminology and definitions. Epilepsia 1997;38(suppl):S6–S8. [DOI] [PubMed] [Google Scholar]
- 4.Sillanpaa M, Shinnar S. Long-term mortality in childhood-onset epilepsy. N Engl J Med 2010;363:2522–2529. [DOI] [PubMed] [Google Scholar]
- 5.Tomson T, Nashef L, Ryvlin P. Sudden unexpected death in epilepsy: current knowledge and future directions. Lancet Neurol 2008;7:1021–1031. [DOI] [PubMed] [Google Scholar]
- 6.Ryvlin P, Cucherat M, Rheims S. Risk of sudden unexpected death in epilepsy in patients given adjunctive antiepileptic treatment for refractory seizures: a meta-analysis of placebo-controlled randomised trials. Lancet Neurol 2011;10:961–968. [DOI] [PubMed] [Google Scholar]
- 7.Sperling MR, Feldman H, Kinman J, Liporace JD, O'Connor MJ. Seizure control and mortality in epilepsy. Ann Neurol 1999;46:45–50. [DOI] [PubMed] [Google Scholar]
- 8.Sperling MR, Harris A, Nei M, Liporace JD, O'Connor MJ. Mortality after epilepsy surgery. Epilepsia 2005;46(suppl 11):49–53. [DOI] [PubMed] [Google Scholar]
- 9.Bakken IJ, Revdal E, Nesvag R, et al. Substance use disorders and psychotic disorders in epilepsy: a population-based registry study. Epilepsy Res 2014;108:1435–1443. [DOI] [PubMed] [Google Scholar]
- 10.Schiltz NK, Koroukian SM, Singer ME, Love TE, Kaiboriboon K. Disparities in access to specialized epilepsy care. Epilepsy Res 2013;107:172–180. [DOI] [PMC free article] [PubMed] [Google Scholar]
- 11.Kelvin EA, Hesdorffer DC, Bagiella E, et al. Prevalence of self-reported epilepsy in a multiracial and multiethnic community in New York City. Epilepsy Res 2007;77:141–150. [DOI] [PubMed] [Google Scholar]
- 12.Begley CE, Basu R, Reynolds T, et al. Sociodemographic disparities in epilepsy care: results from the Houston/New York City Health Care Use and Outcomes Study. Epilepsia 2009;50:1040–1050. [DOI] [PubMed] [Google Scholar]
- 13.Burneo JG, Jette N, Theodore W, et al. Disparities in epilepsy: report of a systematic review by the North American Commission of the International League Against Epilepsy. Epilepsia 2009;50:2285–2295. [DOI] [PMC free article] [PubMed] [Google Scholar]
- 14.Espinosa Jovel CA, Ramirez Salazar S, Rincon Rodriguez C, Sobrino Mejia FE. Factors associated with quality of life in a low-income population with epilepsy. Epilepsy Res 2016;127:168–174. [DOI] [PubMed] [Google Scholar]
- 15.Devinsky O. Psychiatric comorbidity in patients with epilepsy: implications for diagnosis and treatment. Epilepsy Behav 2003;4(suppl 4):S2–S10. [DOI] [PubMed] [Google Scholar]
- 16.Wilson DA, Malek AM, Wagner JL, Wannamaker BB, Selassie AW. Mortality in people with epilepsy: a statewide retrospective cohort study. Epilepsy Res 2016;122:7–14. [DOI] [PubMed] [Google Scholar]
- 17.Center for State, Tribal, Local, and Territorial Support, Public Health Law Program, Centers for Disease Control and Prevention. Investigations and autopsies. Available at: cdc.gov/phlp/publications/coroner/investigations.html. Accessed September 10, 2019.
- 18.Nashef L, So EL, Ryvlin P, Tomson T. Unifying the definitions of sudden unexpected death in epilepsy. Epilepsia 2012;53:227–233. [DOI] [PubMed] [Google Scholar]
- 19.Thurman DJ, Beghi E, Begley CE, et al. Standards for epidemiologic studies and surveillance of epilepsy. Epilepsia 2011;52(suppl 7):2–26. [DOI] [PubMed] [Google Scholar]
- 20.Charlson Comorbidity Index. MD Calc Website. Available at: mdcalc.com/charlson-comorbidity-index-cci. Accessed March 5, 2018. [Google Scholar]
- 21.American Community Survey, US Census Bureau website. Available at: census.gov/programs-surveys/acs/. Accessed November 10, 2016. [Google Scholar]
- 22.US Census 2010. Census website. Available at: www.census.gov/2010census/. Accessed November 10, 2016. [Google Scholar]
- 23.National Center for Health Statistics. Centers for Disease Control and Prevention website. Available at: cdc.gov/nchs/index.htm. Accessed November 10, 2016. [Google Scholar]
- 24.Sveinsson O, Andersson T, Carlsson S, Tomson T. The incidence of SUDEP: a nationwide population-based cohort study. Neurology 2017;89:170–177. [DOI] [PubMed] [Google Scholar]
- 25.Devinsky O, Friedman D, Cheng JY, Moffatt E, Kim A, Tseng ZH. Underestimation of sudden deaths among patients with seizures and epilepsy. Neurology 2017;89:886–892. [DOI] [PMC free article] [PubMed] [Google Scholar]
- 26.Lash TL, Fox MP, Fink AK. A guide to implementing quantitative bias analysis. In: Applying Quantitative Bias Analysis to Epidemiologic Data. New York: Springer; 2009:13–32. [Google Scholar]
- 27.Lash TL, Fox MP, MacLehose RF, Maldonado G, McCandless LC, Greenland S. Good practices for quantitative bias analysis. Int J Epidemiol 2014;43:1969–1985. [DOI] [PubMed] [Google Scholar]
- 28.Lash TL, Fox MP, Fink AK. Probabilistic bias analysis. In: Applying Quantitative Bias Analysis to Epidemiologic Data. New York: Springer; 2009:117–150. [Google Scholar]
- 29.Greenlund SF, Croft JB, Kobau R. Epilepsy by the numbers: epilepsy deaths by age, race/ethnicity, and gender in the United States significantly increased from 2005 to 2014. Epilepsy Behav 2017;69:28–30. [DOI] [PubMed] [Google Scholar]
- 30.Harden C, Tomson T, Gloss D, et al. Practice guideline summary: sudden unexpected death in epilepsy incidence rates and risk factors: report of the Guideline Development, Dissemination, and Implementation Subcommittee of the American Academy of Neurology and the American Epilepsy Society. Neurology 2017;88:1674–1680. [DOI] [PubMed] [Google Scholar]
- 31.Schraeder PL, Delin K, McClelland RL, So EL. Coroner and medical examiner documentation of sudden unexplained deaths in epilepsy. Epilepsy Res 2006;68:137–143. [DOI] [PubMed] [Google Scholar]
- 32.Thurman DJ, Kobau R, Luo YH, Helmers SL, Zack MM. Health-care access among adults with epilepsy: the U.S. National Health Interview Survey, 2010 and 2013. Epilepsy Behav 2016;55:184–188. [DOI] [PMC free article] [PubMed] [Google Scholar]
- 33.Begley C, Basu R, Lairson D, et al. Socioeconomic status, health care use, and outcomes: persistence of disparities over time. Epilepsia 2011;52:957–964. [DOI] [PubMed] [Google Scholar]
- 34.Halpern MT, Renaud JM, Vickrey BG. Impact of insurance status on access to care and out-of-pocket costs for U.S. individuals with epilepsy. Epilepsy Behav 2011;22:483–489. [DOI] [PubMed] [Google Scholar]
- 35.Masri A, Aburahma S, Khasawneh A, et al. Parental knowledge and attitudes towards epilepsy: a study from Jordan. Seizure 2017;53:75–80. [DOI] [PubMed] [Google Scholar]
- 36.Neni SW, Latif AZ, Wong SY, Lua PL. Awareness, knowledge and attitudes towards epilepsy among rural populations in East Coast Peninsular Malaysia: a preliminary exploration. Seizure 2010;19:280–290. [DOI] [PubMed] [Google Scholar]
- 37.National Association of Epilepsy Centers. Available at: naec-epilepsy.org/. Accessed March 5, 2018.
- 38.Abegunde DO, Mathers CD, Adam T, Ortegon M, Strong K. The burden and costs of chronic diseases in low-income and middle-income countries. Lancet 2007;370:1929–1938. [DOI] [PubMed] [Google Scholar]
- 39.Mari-Dell'Olmo M, Gotsens M, Palencia L, et al. Socioeconomic inequalities in cause-specific mortality in 15 European cities. J Epidemiol Community Health 2015;69:432–441. [DOI] [PubMed] [Google Scholar]
- 40.So EL, Bainbridge J, Buchhalter JR, et al. Report of the American Epilepsy Society and the Epilepsy Foundation Joint Task Force on Sudden Unexplained Death in Epilepsy. Epilepsia 2009;50:917–922. [DOI] [PubMed] [Google Scholar]
- 41.Miller WR, Young N, Friedman D, Buelow JM, Devinsky O. Discussing sudden unexpected death in epilepsy (SUDEP) with patients: practices of health-care providers. Epilepsy Behav 2014;32:38–41. [DOI] [PMC free article] [PubMed] [Google Scholar]
- 42.Morton B, Richardson A, Duncan S. Sudden unexpected death in epilepsy (SUDEP): don't ask, don't tell? J Neurol Neurosurg Psychiatry 2006;77:199–202. [DOI] [PMC free article] [PubMed] [Google Scholar]
- 43.Friedman D, Donner EJ, Stephens D, Wright C, Devinsky O. Sudden unexpected death in epilepsy: knowledge and experience among U.S. and Canadian neurologists. Epilepsy Behav 2014;35:13–18. [DOI] [PMC free article] [PubMed] [Google Scholar]
- 44.Hirsch LJ, Donner EJ, So EL, et al. Abbreviated report of the NIH/NINDS workshop on sudden unexpected death in epilepsy. Neurology 2011;76:1932–1938. [DOI] [PMC free article] [PubMed] [Google Scholar]
- 45.Jeffs TC, Donner EJ. Our epilepsy story: SUDEP aware. Epilepsia 2015;56:9–11. [DOI] [PubMed] [Google Scholar]
- 46.Sommers BD, Baicker K, Epstein AM. Mortality and access to care among adults after state Medicaid expansions. N Engl J Med 2012;367:1025–1034. [DOI] [PubMed] [Google Scholar]
Associated Data
This section collects any data citations, data availability statements, or supplementary materials included in this article.
Data Availability Statement
Anonymized data will be shared by request from any qualified investigator.


