Abstract
Objective
We previously identified 4 empirically derived mild cognitive impairment (MCI) subtypes via cluster analysis within the Alzheimer's Disease Neuroimaging Initiative (ADNI) and demonstrated high correspondence between patterns of cortical thinning at baseline and each cognitive subtype. We aimed to determine whether our MCI subtypes demonstrate unique longitudinal atrophy patterns.
Methods
ADNI participants (295 with MCI and 134 cognitively normal [CN]) underwent annual structural MRI and neuropsychological assessments. General linear modeling compared vertex-wise differences in cortical atrophy rates between each MCI subtype and the CN group. Linear mixed models examined trajectories of cortical atrophy over 3 years within lobar regions of interest.
Results
Compared to the CN group, those with amnestic MCI (memory deficit) initially demonstrated greater atrophy rates within medial temporal lobe regions that became more widespread over time. Those with dysnomic/amnestic MCI (naming/memory deficits) showed greater atrophy rates largely localized to temporal lobe regions. The mixed MCI (impairment in all cognitive domains) group showed greater atrophy rates in widespread regions at all time points. The cluster-derived normal group, who had intact neuropsychological performance and normal cortical thickness at baseline despite their MCI diagnosis via conventional diagnostic criteria, continued to show normal cognition and minimal cortical atrophy over 3 years.
Conclusions
ADNI's purported amnestic MCI sample produced more refined cognitive subtypes with unique longitudinal cortical atrophy rates. These novel MCI subtypes reliably reflect underlying atrophy, reduce false-positive diagnostic errors, and improve prediction of clinical course. Such improvements have implications for the selection of participants for clinical trials and for providing more precise risk assessment for individuals diagnosed with MCI.
The diagnostic criteria for mild cognitive impairment (MCI), as operationalized by large-scale studies such as the Alzheimer's Disease Neuroimaging Initiative (ADNI), include a subjective memory complaint, an objective memory impairment, normal general cognitive functioning, and intact activities of daily living/absence of dementia.1–5 This diagnostic method, which focuses exclusively on the amnestic form of MCI and does not consider nonamnestic subtypes,4 has nonetheless been shown to produce heterogeneous MCI cohorts. In a previous study6 using data from ADNI's MCI cohort, cluster analysis of participants’ neuropsychological test scores identified 4 cognitive subtypes: amnestic MCI (34.9%) with an isolated memory impairment; dysnomic/amnestic MCI (18.5%) with impairments in language (i.e., confrontation naming) and memory; mixed MCI (12.5%) with memory, language, and attention/executive function deficits; and a cluster-derived normal (CDN) group (34.2%) who, despite meeting ADNI's criteria for MCI diagnosis, demonstrated intact performance on more extensive cognitive testing and normal Alzheimer disease (AD) biomarkers.6–8
We previously investigated differences in regional cortical thickness in these 4 empirically derived MCI subtypes and found that the unique patterns of cortical atrophy identified at baseline closely corresponded to the cognitive profile of each subtype.8 The current study builds on our prior work by examining whole-brain neocortical atrophy rates within each subtype to determine whether they have prognostic value for improving the prediction of clinical course in MCI.
Methods
Data were obtained from the ADNI database (adni.loni.usc.edu). ADNI was launched in 2003 by the National Institute on Aging, National Institute of Biomedical Imaging and Bioengineering, Food and Drug Administration, private pharmaceutical companies, and nonprofit organizations. The primary goal of ADNI is to test whether neuroimaging, other biological markers, and clinical and neuropsychological assessment can be combined to measure the progression of MCI and early AD. ADNI is the result of the efforts of many coinvestigators from a range of academic institutions and private corporations, and participants have been recruited from >50 sites across the United States and Canada. Participants in ADNI are between the ages of 55 and 90 years, completed at least 6 years of education, are fluent in English or Spanish, and are free of any significant neurologic disease other than AD. For more information, see adni-info.org.
Standard protocol approvals, registrations, and patient consents
The ADNI study was approved by an ethics standards committee on human experimentation at each institution. Written informed consent was obtained from all participants.
Data availability
The data are available on request to qualified investigators. The data used for this study are available from the ADNI database (adni.loni.usc.edu).
Participants
Participants were individuals with MCI (n = 295) and cognitively normal (CN; n = 134) individuals from our baseline cortical thickness study8 who had longitudinal neuroimaging data available. ADNI participants underwent annual structural MRI and neuropsychological assessments. For the current study, we examined annual follow-up data for up to 3 years after baseline.
ADNI's MCI diagnosis was based on the following criteria5: (1) subjective memory concern as reported by the participant, study partner, or clinician; (2) abnormal memory function documented by scoring within the education-adjusted ranges on delayed free recall of Story A from the Wechsler Memory Scale–Revised Logical Memory II subtest; (3) Mini-Mental State Examination score between 24 and 30; (4) global Clinical Dementia Rating Scale score of 0.5, indicating mild impairment, with a Memory Box score of at least 0.5; and (5) largely intact general cognition and functional performance, such that a diagnosis of AD could not be made.
All participants who had been diagnosed with MCI by ADNI were previously classified into 1 of 4 MCI subtypes: amnestic MCI, dysnomic/amnestic MCI, mixed MCI, and a CDN group.6,8 These MCI subgroups were determined by performing a cluster analysis of participants' baseline neuropsychological test scores on 2 measures of memory (Rey Auditory Verbal Learning Test [AVLT] delayed recall; AVLT recognition), 2 measures of language (Animal Fluency; 30-item Boston Naming Test), and 2 measures of attention/executive function (Trail Making Test, Parts A and B). Prior to the cluster analysis, raw neuropsychological scores for each MCI participant were converted into age- and education-adjusted z scores based on regression coefficients derived from the CN group.6
All CN individuals included in our previous studies6,8 and in the current study were individuals who remained classified as CN based on ADNI's criteria5 (i.e., they did not progress to MCI or dementia) for the duration of their participation in the ADNI study.
MRI processing and analysis
Image processing and analyses were performed at the Center for Multimodal Imaging and Genetics, University of California, San Diego. T1-weighted MRIs were downloaded from the ADNI database and processed with FreeSurfer software (version 5.3.0). All baseline scans had been previously quality controlled,8 and we applied this same method to scans from the follow-up visits. We excluded a total of 52 follow-up scans from the analyses (22 scans from the year 1 follow-up, 19 scans from year 2, and 11 scans from year 3) due to poor quality. Images were excluded if they had significant motion artifact or poor segmentation of gray/white matter boundaries. Cortical thickness estimates were computed at each vertex (≈1-mm spacing) across the cortical mantle and within 32 gyral-based regions of interest (ROIs) per hemisphere using the Desikan-Killiany atlas.9 Mean thickness for each ROI was calculated by averaging the cortical thickness measurements across vertices within a given region based on unsmoothed data.
Statistical analyses
Analysis of variance and χ2 tests examined group differences in demographics, APOE ε4 genotype, CSF AD biomarkers (available for 57% of the sample), and rates of progression to dementia. To assess stability of the cluster groups, linear mixed models examined longitudinal neuropsychological performance within each group on the same 6 measures that were used to characterize participants at baseline while covarying for demographic variables. To assess attrition, analysis of variance and χ2 tests were performed to examine whether demographic or diagnostic characteristics differed between participants who had data available at each time point and those who did not. Analyses were conducted with the Statistical Package for the Social Sciences version 25 (SPSS IBM, Armonk, NY).
Longitudinal change in cortical thickness was calculated from T1-weighted images with quantitative anatomic regional change analysis.10 This involves nonlinear registration of participants' baseline image to each of their follow-up images. The cortical atrophy rate was calculated as the percent volume change at each vertex from baseline to each follow-up. General linear modeling was used to compare differences in cortical atrophy rates between the CN group and each MCI group separately, controlling for age, age2, sex, education, time since baseline, and magnet strength (false discovery rate corrected for p < 0.05 across both hemispheres), and cortical volume difference maps were concatenated at each time point by resampling individual surfaces into a common sphere that aligned cortical vertices across participants.11 Differences in cortical atrophy at each time point were also examined between the 3 impaired MCI subtypes (amnestic, dysnomic/amnestic, and mixed MCI). The vertex-wise analyses using quantitative anatomic regional change values allowed visualization of the dynamic pattern of atrophy across time.
Linear mixed models were then used to examine trajectories of cortical atrophy among diagnostic groups over the full 3-year period within 12 composite lobar ROIs. The visit variable included 4 time points (baseline and year 1, 2, and 3 follow-ups) and was modeled as a continuous parameter. Both linear and quadratic effects of visit were examined, but including quadratic visit did not improve model fit based on the −2 log likelihood, Akaike information criterion, and bayesian information criterion. Covariates included in the model were age, age2, sex, education, time since baseline, and magnet strength. The random effects of intercept and slope were included. The full information maximum likelihood method was used to estimate the model, allowing all available data to be used for parameter estimates.12
For composite ROIs showing a significant group main effect or a group × visit interaction, each MCI subtype was compared to the CN reference group (12 ROIs: Bonferroni-corrected p < 0.004). Secondary analyses also tested the models with amnestic MCI or dysnomic/amnestic MCI as the reference group to examine differences between the 3 cognitively impaired MCI subtypes.
Results
Demographic, biomarker, and clinical characteristics of MCI subtypes
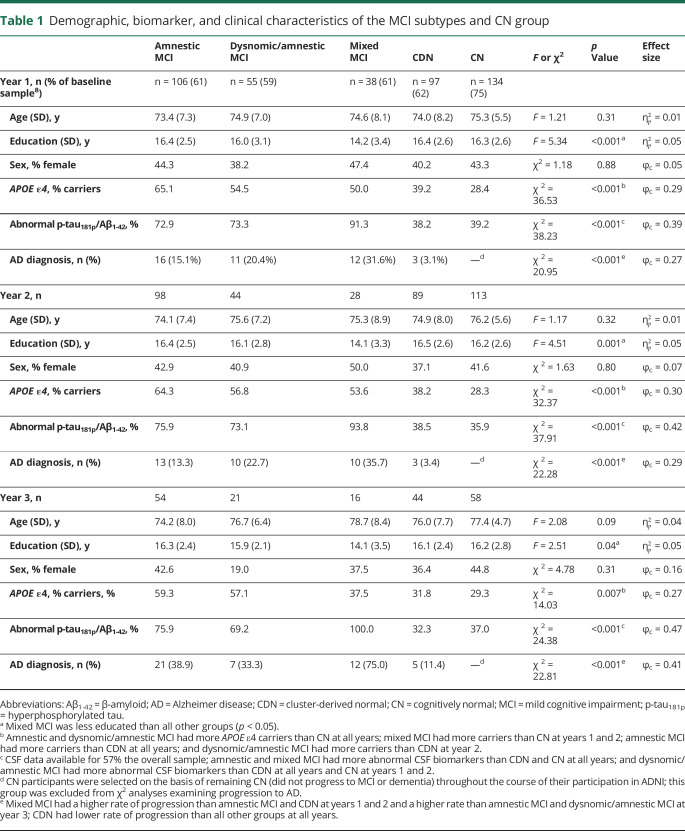
There were no significant group differences in age or sex, but mixed MCI was the least educated group (table 1). The 3 impaired MCI subtypes had a higher prevalence of APOE ε4 carriers and abnormal CSF AD biomarkers (based on established cut-point concentrations13) compared to the CDN and CN groups, which did not differ. Over the 3-year follow-up period, a proportion of participants progressed to a diagnosis of probable AD. At years 1 and 2, the mixed MCI group had a higher rate of progression to AD (32%–36%) than the amnestic MCI group (13%–15%). At year 3, the mixed MCI group had a higher rate of progression (75%) than both the amnestic MCI (39%) and dysnomic/amnestic MCI (33%) groups. As anticipated, the CDN group had a lower rate of progression to probable AD than all other groups at all time points.
Table 1.
Demographic, biomarker, and clinical characteristics of the MCI subtypes and CN group
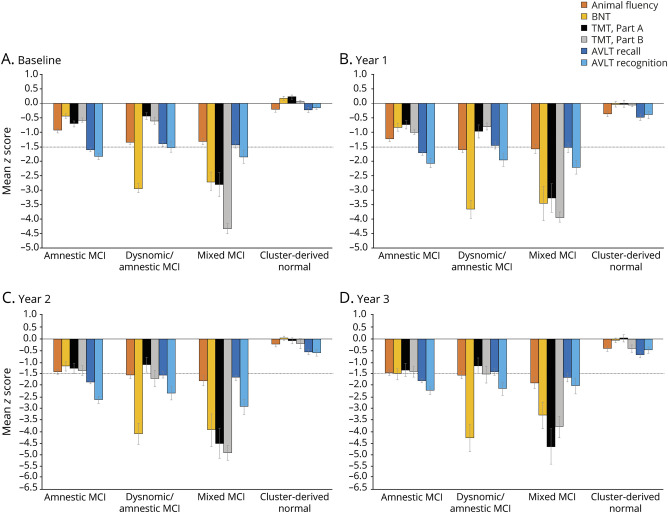
Examination of longitudinal neuropsychological data showed stability of the cluster groups with regard to their overall pattern of cognitive performance (figure 1), although each group showed cognitive decline over time. The amnestic MCI group demonstrated a consistent memory deficit and began showing impairment (with scores approaching or below −1.5 SD) in the areas of language and attention/executive functioning by years 2 and 3; linear mixed models showed a decline from baseline on all 6 cognitive scores (p < 0.001). The dysnomic/amnestic MCI group showed consistent deficits in naming and memory at all time points, along with impairment in executive functioning at years 2 and 3; linear mixed models showed a decline from baseline on all cognitive scores (p ≤ 0.004) with the exception of AVLT recall. The mixed MCI group showed consistent impairment across cognitive measures and a decline from baseline on all scores (p ≤ 0.004) except for Trail Making Test, Part B, which was likely at floor levels at baseline. Finally, although the CDN group declined on all measures (p ≤ 0.02) except Animal Fluency, all scores remained within normal limits at all time points.
Figure 1. Neuropsychological performance of the cluster groups at each time point.
Mean demographically corrected z scores at (A) baseline, (B) year 1, (C) year 2, and (D) year 3. Error bars denote SEM; horizontal dotted line indicates the typical cutoff for impairment (−1.5 SDs). AVLT = Rey Auditory Verbal Learning Test; BNT = Boston Naming Test; MCI = mild cognitive impairment; TMT = Trail Making Test.
Attrition
Attrition from baseline to year 1 did not differ on age (F = 0.02, p = 0.88), education (F = 0.01, p = 0.94), or sex (χ2 = 0.24, p = 0.61). However, there was an effect of diagnostic group (χ2 = 11.96, p = 0.02) in that the CN group has less attrition than all other groups. Attrition from baseline to year 2 did not differ on age (F = 0.42, p = 0.52), education (F = 0.01, p = 0.94), sex (χ2 < 0.001, p = 0.98), or diagnostic group (χ2 = 8.60, p = 0.07). Attrition from baseline to year 3 also did not differ on age (F = 0.07, p = 0.79), education (F = 1.14, p = 0.29), sex (χ2 = 0.86, p = 0.35), or diagnostic group (χ2 = 4.54, p = 0.34).
Cortical atrophy in MCI subtypes relative to CN participants
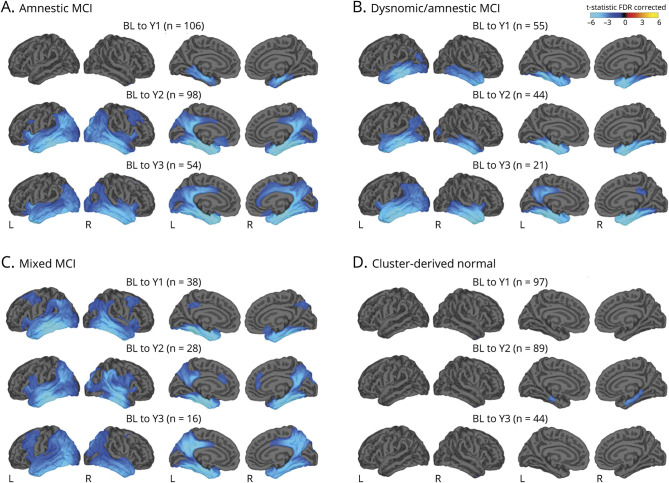
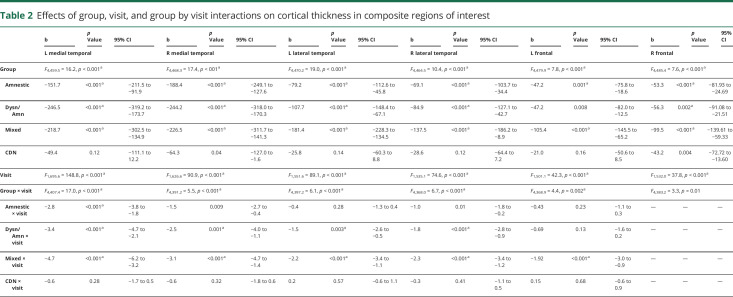
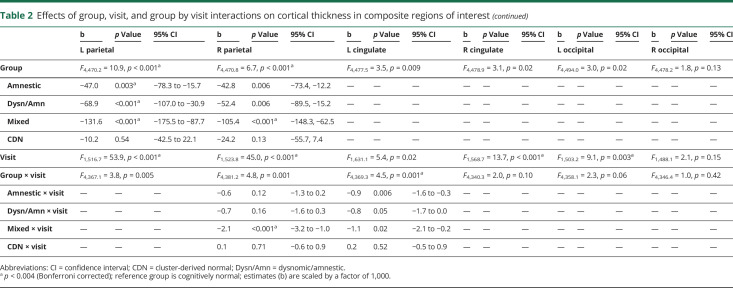
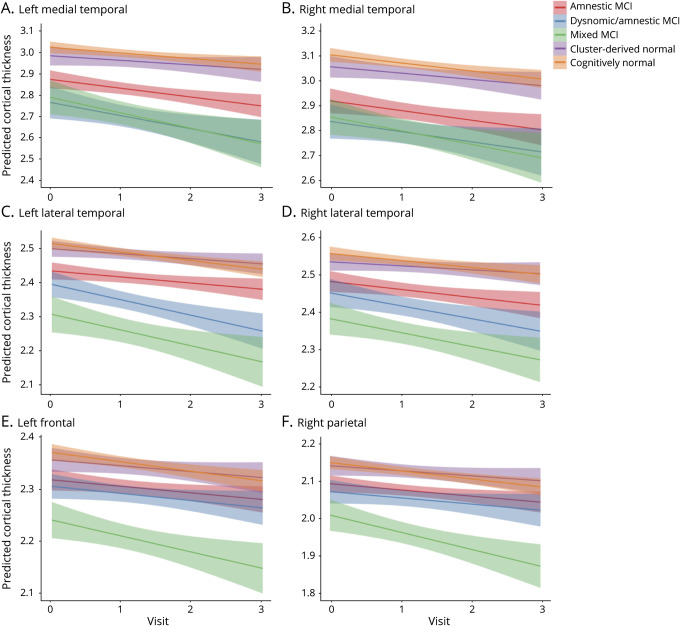
Differences in cortical atrophy rates at each time point between each MCI subtype relative to the CN group are displayed in figure 2. Linear mixed models examining trajectories of cortical atrophy over 3 years revealed a significant main effect of group for bilateral medial temporal, lateral temporal, frontal, and parietal ROIs; a significant main effect of visit for bilateral medial temporal, lateral temporal, frontal, parietal, right cingulate, and left occipital ROIs; and a significant group × visit interaction for bilateral medial temporal, lateral temporal, left frontal, right parietal, and left cingulate ROIs (p < 0.004; table 2 and figure 3).
Figure 2. Surface-based atrophy rate maps showing differences in cortical atrophy rates between each MCI subgroup and the CN group from baseline to each annual follow-up visit.
Cyan/blue shades represent areas where the mild cognitive impairment (MCI) subgroup had greater atrophy relative to the cognitively normal (CN) group. Surface-based maps are false discovery rate (FDR) corrected and covary for age, age2, sex, education, days from baseline (BL), and magnet strength. Number of CN participants at each time point: year (Y) 1, n = 134; Y2, n = 113; and Y3, n = 58.
Table 2.
Effects of group, visit, and group by visit interactions on cortical thickness in composite regions of interest
Figure 3. Trajectories of cortical thickness by group in select composite regions of interest showing significant group × visit interactions.
(A) Left medial temporal, (B) right medial temporal, (C) left lateral temporal, (D) right lateral temporal, (E) left frontal, and (F) right parietal; 0 = baseline; 1 = year 1; 2 = year 2; and 3 = year 3. Error bars represent 95% confidence intervals. MCI = mild cognitive impairment.
Consistent with their isolated deficit in memory, the amnestic MCI group showed bilateral medial temporal lobe cortical thickness reductions at baseline compared to the CN group.8 Longitudinally, surface-based atrophy rate maps showed that the amnestic MCI group demonstrated atrophy restricted to bilateral medial temporal lobe regions at year 1. This atrophy became more pronounced in medial temporal regions and more widespread over the subsequent 2 years, affecting lateral temporal, frontal, parietal, cingulate, and occipital regions (figure 2A). Linear mixed models examining cortical atrophy in composite ROIs across the full 3-year interval confirmed greater cortical thinning overall (main effect of group) in bilateral medial temporal, lateral temporal, frontal, and left parietal areas relative to the CN group (p ≤ 0.003), as well as an increased rate of cortical atrophy (group × visit interaction) in the left medial temporal lobe (p < 0.001; table 2 and figure 3).
At baseline, the dysnomic/amnestic MCI group demonstrated reduced cortical thickness in lateral and medial temporal lobe regions, consistent with their naming and memory deficits.8 Longitudinally, surface-based atrophy rate maps showed that the dysnomic/amnestic MCI group exhibited atrophy localized largely to bilateral temporal lobe regions over the 3 years of follow-up, along with circumscribed areas of atrophy in cingulate, right parietal, and occipital lobe regions (figure 2b). Linear mixed models confirmed greater cortical thinning overall in bilateral medial and lateral temporal, right frontal, and left parietal areas relative to the CN group (p ≤ 0.002), as well as an increased rate of cortical atrophy in bilateral medial and lateral temporal lobes (p ≤ 0.003; table 2 and figure 3).
The mixed MCI group showed a widespread pattern of cortical thinning compared to the CN group at baseline, which reflected their extensive neuropsychological dysfunction.8 Longitudinally, surface-based atrophy rate maps showed that the mixed MCI group demonstrated atrophy in bilateral medial temporal, lateral temporal, frontal, parietal, and occipital regions at all follow-up visits, as well as atrophy in cingulate regions at years 2 and 3 (figure 2C). Linear mixed models revealed greater cortical thinning overall in bilateral medial temporal, lateral temporal, frontal, and parietal areas relative to the CN group (p < 0.001), as well as an increased rate of cortical atrophy in bilateral medial and lateral temporal, left frontal, and right parietal regions (p < 0.001; table 2 and figure 3).
Lastly, the CDN group demonstrated cortical thickness at baseline that did not differ from the CN group, consistent with the normal neuropsychological performance of those participants.8 Longitudinally, surface-based atrophy rate maps showed that the CDN group exhibited cortical atrophy that was largely comparable to the CN group over the 3-year follow-up period. The only exception was greater atrophy in some medial temporal lobe regions at the year 2 follow-up visit (figure 2D). Linear mixed models over the 3-year interval revealed no significant differences in overall cortical thinning relative to the CN group (p > 0.004) and no differences in cortical atrophy rate (p > 0.20; table 2 and figure 3).
Cortical atrophy comparisons between MCI subtypes
Differences in cortical atrophy were examined between the 3 cognitively impaired MCI subtypes. Surface-based atrophy rate maps showed that, relative to the amnestic MCI group, the dysnomic/amnestic MCI group demonstrated greater atrophy from baseline to year 1 in lateral temporal lobe regions, primarily on the left; there were no differences between the amnestic and dysnomic/amnestic MCI groups at subsequent follow-up visits. Linear mixed models examining the trajectory of cortical atrophy across the full 3-year interval revealed no differences in overall cortical thinning or cortical atrophy rate between the amnestic and dysnomic/amnestic MCI groups once Bonferroni correction was applied (difference in atrophy rate for left lateral temporal ROI: p = 0.04).
Relative to the amnestic MCI group, surface-based atrophy rate maps showed that the mixed MCI group had greater atrophy in the left medial temporal, bilateral lateral temporal, bilateral frontal, and bilateral parietal regions at year 1 and greater atrophy in right lateral temporal and right parietal regions at year 2; there were no significant differences at year 3. Linear mixed models across the 3-year interval showed that the mixed MCI group had greater cortical thinning overall in the left lateral temporal lobe and left parietal lobe relative to the amnestic MCI group (p < 0.001). There were no significant differences in cortical atrophy rate between the 2 groups once Bonferroni correction was applied, although several regions differed on the basis of a less stringent threshold (left lateral temporal: p = 0.004; left frontal: p = 0.005; bilateral parietal: p = 0.007).
Relative to the dysnomic/amnestic MCI group, surface-based atrophy rate maps showed that the mixed MCI group had greater atrophy in right lateral temporal, right parietal, and bilateral cingulate regions at year 2; there were no significant differences at years 1 or 3. Linear mixed models across the full 3-year interval showed that the mixed MCI group had greater cortical thinning overall in the left cingulate relative to dysnomic/amnestic MCI (p < 0.001). There were no significant differences in cortical atrophy rate between the 2 groups once Bonferroni correction was applied.
Discussion
We demonstrated unique patterns of longitudinal cortical atrophy over a 3-year period in our 4 cognitive subtypes of MCI, which were empirically derived via cluster analysis of neuropsychological scores. Rather than grouping all participants into a single amnestic MCI group, as was originally done by ADNI, the identification of these subgroups revealed varying levels of severity of both cognitive impairment and cortical thinning, as well as differing rates of progression to AD. The MCI subgroups were found to be robust over time; their overall pattern of performance on neuropsychological testing remained largely stable over the 3-year interval. The identification of these unique MCI subtypes and their differing cortical atrophy trajectories may have important prognostic value for improving the prediction of clinical course.
Within our empirically derived amnestic MCI group, cortical atrophy was initially restricted to the medial temporal lobe regions in the first year and then became more widespread over the subsequent 2 years. This trajectory is consistent with the pattern of atrophy that has been observed in previous studies of prodromal AD. For example, one study14 examined cortical thickness differences between diagnostic groups (healthy elderly, MCI, AD) in a non-ADNI sample (i.e., participants from a university memory clinic) and found that medial temporal lobe thinning was the most significant difference between healthy elderly and MCI, while lateral temporal lobe thinning was the most pronounced difference between MCI and AD; frontal and parietal changes were also observed at the MCI stage but became more diffuse in AD. A pair of studies15,16 from the Mayo Clinic's Alzheimer's Disease Research Program using voxel-based morphometry found that participants with conventionally defined single-domain amnestic MCI had gray matter loss in the medial and inferior temporal lobes compared to CN participants, while those with multiple-domain amnestic MCI also showed involvement of the posterior temporal lobe, parietal association cortex, and posterior cingulate.15 Furthermore, such gray matter loss was seen only in participants with amnestic MCI who later progressed to AD, indicating that patterns of atrophy on MRI correspond to their subsequent clinical course.16 These consistent findings between previous studies of prodromal AD and our empirically derived amnestic MCI group provide validation for our MCI subtyping technique and its ability to produce reliable cognitive phenotypes.
Our dysnomic/amnestic MCI group is a unique subtype that is not specifically identified by the conventional MCI subtyping scheme. Instead, given their impairment in both language and memory domains, these individuals would be subsumed by a catch-all “multidomain amnestic MCI” label according to Petersen/Winblad criteria.1–5 The dysnomic/amnestic MCI group was distinguished by greater left lateral temporal thinning at early time points (baseline8 and year 1 follow-up) and a corresponding impairment in confrontation naming ability that was not observed in the amnestic MCI group. Given these additional findings in the dysnomic/amnestic MCI group, it is possible that this subtype represents a more advanced stage of MCI relative to the amnestic MCI group. However, there is also evidence to the contrary; the dysnomic/amnestic MCI subtype displayed many similarities to the amnestic MCI subtype, including rate of progression to AD and cortical atrophy rates over the entire 3-year interval.
The mixed MCI group showed multidomain cognitive impairment and extensive cortical thinning relative to the CN group. They also evinced increased atrophy rates across widespread neocortical regions relative to the amnestic and dysnomic/amnestic MCI groups in the first 1 to 2 years of follow-up; no differences in cortical atrophy were observed at year 3, although it should be noted that sample sizes of some of the groups were relatively small at that time point, which may have limited our power to detect group differences. The mixed MCI group also showed the highest rate of progression to a diagnosis of AD over the 3-year period, with as many of 75% of the group developing AD by year 3. As with our dysnomic/amnestic MCI subtype, individuals in our mixed MCI group would also be classified as having “multidomain amnestic MCI” according to Petersen/Winblad criteria.1–5 However, our findings suggest that the mixed MCI group is clearly more at risk than the dysnomic/amnestic MCI group, providing further evidence for the value of identifying these smaller, more refined MCI subtypes.
Comparisons of the MCI subtypes suggest that some of the groups may represent different stages of disease.17 For example, the trajectory of cortical thinning observed in our amnestic MCI group appears to map onto the spread of neurofibrillary tangle (NFT) pathology described by Braak et al.18 In the Braak staging schema, pretangle material initially appears in the transentorhinal region (stages 1a, 1b, I–II), followed by formation of NFTs spreading from entorhinal/medial temporal cortex to adjacent neocortical association areas (e.g., lateral temporal and frontal cortices; stages III–IV).18 Thus, it is possible that the observed longitudinal cortical atrophy pattern in our amnestic MCI subtype may reflect the accumulation and progression of underlying NFT pathology. Similarly, it could be speculated that the mixed MCI group may be closer to the later stages (V–VI) based on the Braak staging schema in which NFT pathology becomes more widespread, moving to primary and secondary cortical regions.18
As many as one-third of the participants in the ADNI MCI cohort were classified into the CDN group,6 a subgroup who were diagnosed with MCI based on the ADNI diagnostic method5 (i.e., subjective memory complaint, delayed memory for 1 story, cognitive screening measure, clinical judgment) but scored within normal limits on more extensive neuropsychological testing. Our research group has conducted a number of studies examining this CDN group and has found them to have normal CSF biomarkers of β-amyloid and tau,6 normal β-amyloid burden on PET imaging,7 and normal cortical thickness8 at baseline. Longitudinal data have also shown that the CDN group remains functionally independent over time,19 overreports subjective cognitive difficulty despite normal objective cognitive performance over time,20 and shows a low rate of progression to dementia.6 In the current study, the CDN group showed consistently normal neuropsychological performance across visits and exhibited cortical atrophy that was largely comparable to that of the CN group over the 3-year follow-up period. Taken together, the data strongly suggest that ADNI's diagnostic criteria for MCI produce a high rate of false-positive diagnostic errors, secondary to the unreliability of using a single test score to diagnose MCI21,22 and the lack of relationship between subjective memory complaints and objective performance.20,23 This issue is not specific to ADNI; large false-positive MCI groups have been identified in other samples when the conventional diagnostic criteria are used, including community-based samples24 and clinical trials.25
Despite largely normal cortical thickness over the 3-year period, results showed that the CDN group had greater atrophy relative to the CN group in some medial temporal lobe regions at the year 2 follow-up visit. In addition, 5 individuals in the CDN group progressed to a diagnosis of AD. Incorporation of additional neuropsychological measures and additional cognitive domains (e.g., visuospatial) into our classification of empirically derived MCI subtypes may improve classification accuracy (i.e., those 5 individuals may have been moved to an impaired MCI subtype).24,26 However, this was limited by ADNI's relatively brief neuropsychological battery, and previous work has shown that visuospatial measures available in ADNI have psychometric properties (e.g., ceiling effect) that limit their ability to discriminate between normal and mildly impaired individuals.26 Nonetheless, this small cost in sensitivity is outweighed by greatly increased specificity, as the vast majority of participants in the CDN group appear to be better categorized as CN rather than MCI. Improvement in the specificity of an MCI diagnosis has substantial implications for the selection of participants for clinical trials in that accurate MCI diagnoses and removal of false positives at study enrollment can lead to more efficient trials and more robust study findings.25 False-positive MCI diagnoses may also have clinical implications, including psychological consequences that could result from an inaccurate diagnosis or the potential for inappropriate medication use.
A limitation of the current study was our inability to examine cortical atrophy trajectories in participants who met criteria for a nonamnestic MCI subtype as ADNI's intention is to recruit only participants with amnestic MCI. This also limited our ability to investigate less common variants27 of AD and their cortical thickness profiles, reducing the generalizability of the findings. That said, the ADNI MCI criteria are highly representative of those used for participant selection in clinical trials28; therefore, findings in the current sample are at least partly representative of the population of interest. Our investigation of cortical atrophy differences obviated the possibility of examining subcortical structures (e.g., hippocampus, thalamus, putamen) that have been shown to play an important role in AD pathogenesis,29,30 and future work investigating group differences in atrophy of subcortical regions is warranted. Another weakness of the current study was attrition over the 3-year follow-up period. Although attrition was not related to demographic variables and did not differ across MCI subtypes, there may still be important differences between individuals who completed each follow-up visit and those who did not. Lastly, the ADNI sample tends to be well educated and relatively homogeneous with regard to ethnic and racial diversity, which limits the generalizability of our findings.
Strengths of this study include the longitudinal design, examination of cortical atrophy both at the vertex-wise level and in lobar ROIs, application of a novel MCI subtyping technique, and examination of longitudinal stability of the cluster groups. The identification of unique cortical atrophy trajectories has clear prognostic value, given previous research showing an association between regional cortical atrophy rates in MCI and a corresponding domain-specific decline in cognition.31 Our findings show that ADNI's purported amnestic MCI sample is heterogeneous and can be broken down into more refined cognitive subtypes with unique profiles of cortical atrophy and differing rates of progression to AD. Our cluster analysis method produces robust MCI subtypes that have been shown to be highly robust and stable across cohorts.24,25,32 Identification of these novel MCI subtypes can reduce false-positive diagnostic errors, improve the prediction of clinical course, and promote greater specificity of cognitive signatures to underlying pathology. Such improvements have clear implications for the selection of participants for clinical trials aimed at finding disease-modifying therapies of AD and for providing more precise risk assessments for individuals diagnosed with MCI.
Glossary
- AD
Alzheimer disease
- ADNI
Alzheimer's Disease Neuroimaging Initiative
- AVLT
Auditory Verbal Learning Test
- CDN
cluster-derived normal
- CN
cognitively normal
- MCI
mild cognitive impairment
- NFT
neurofibrillary tangle
- ROI
region of interest
Appendix 1. Authors

Appendix 2. Coinvestigators

Study funding
This work was supported by the Alzheimer's Association (AARG-17-500358 to E.C.E.; AARF-17-528918 to K.R.T.), the US Department of Veterans Affairs Clinical Sciences Research and Development Service (Career Development Award-2 1IK2 CX001415 to E.C.E.), and the NIH (R01 AG049810 and R01 AG054049 to M.W.B.; K24 AG026431 to M.W.B.; R01 NS065838 to C.R.M.; San Diego State University Advancing Diversity in Aging Research Program R25 AG043364). Data collection and sharing for this project were funded by the ADNI (NIH grant U01 AG024904) and Department of Defense ADNI (Department of Defense award W81XWH-12-2-0012). ADNI is funded by the National Institute on Aging, by the National Institute of Biomedical Imaging and Bioengineering, and through generous contributions from the following: AbbVie, Alzheimer's Association; Alzheimer's Drug Discovery Foundation; Araclon Biotech; BioClinica, Inc; Biogen; Bristol-Myers Squibb Co; CereSpir, Inc; Cogstate; Eisai Inc; Elan Pharmaceuticals, Inc; Eli Lilly and Com EuroImmun; F. Hoffmann-La Roche Ltd and its affiliated company Genentech, Inc; Fujirebio; GE Healthcare; IXICO Ltd; Janssen Alzheimer Immunotherapy Research & Development, LLC; Johnson & Johnson Pharmaceutical Research & Development LLC.; Lumosity; Lundbeck; Merck & Co, Inc; Meso Scale Diagnostics, LLC; NeuroRx Research; Neurotrack Technologies; Novartis Pharmaceuticals Corp; Pfizer Inc; Piramal Imaging; Servier; Takeda Pharmaceutical Co; and Transition Therapeutics. The Canadian Institutes of Health Research is providing funds to support ADNI clinical sites in Canada. Private sector contributions are facilitated by the Foundation for the NIH (fnih.org). The grantee organization is the Northern California Institute for Research and Education, and the study is coordinated by the Alzheimer's Therapeutic Research Institute at the University of Southern California. ADNI data are disseminated by the Laboratory for Neuro Imaging at the University of Southern California.
Disclosure
E. Edmonds, A. Weigand, S. Hatton, A. Marshall, K. Thomas, and D. Ayala report no disclosures relevant to the manuscript. M. Bondi is a consulting editor for the Journal of the International Neuropsychological Society; serves as a consultant for Eisai, Novartis, and Roche; and receives royalties from Oxford University Press. C. McDonald reports no disclosures relevant to the manuscript. Go to Neurology.org/N for full disclosures.
References
- 1.Petersen RC, Smith GE, Waring SC, Ivnik RJ, Tangalos EG, Kokmen E. Mild cognitive impairment: clinical characterization and outcome. Arch Neurol 1999;56:303–308. [DOI] [PubMed] [Google Scholar]
- 2.Petersen RC. Mild cognitive impairment as a diagnostic entity. J Intern Med 2004;256:183–194. [DOI] [PubMed] [Google Scholar]
- 3.Petersen RC, Morris JC. Mild cognitive impairment as a clinical entity and treatment target. Arch Neurol 2005;62:1160–1163. [DOI] [PubMed] [Google Scholar]
- 4.Winblad B, Palmer K, Kivipelto M, et al. Mild cognitive impairment: beyond controversies, towards a consensus: report of the International Working Group on Mild Cognitive Impairment. J Intern Med 2004;256:240–246. [DOI] [PubMed] [Google Scholar]
- 5.Petersen RC, Aisen PS, Beckett LA, et al. Alzheimer's Disease Neuroimaging Initiative (ADNI): clinical characterization. Neurology 2010;74:201–209. [DOI] [PMC free article] [PubMed] [Google Scholar]
- 6.Edmonds EC, Delano-Wood L, Clark LR, et al. Susceptibility of the conventional criteria for mild cognitive impairment to false-positive diagnostic errors. Alzheimers Dement 2015;11:415–424. [DOI] [PMC free article] [PubMed] [Google Scholar]
- 7.Bangen KJ, Clark AL, Werhane M, et al. Cortical amyloid burden differences across empirically-derived mild cognitive impairment subtypes and interaction with APOE ε4 genotype. J Alzheimers 2016;52:849–861. [DOI] [PMC free article] [PubMed] [Google Scholar]
- 8.Edmonds EC, Eppig J, Bondi MW, et al. Heterogeneous cortical atrophy patterns in MCI not captured by conventional diagnostic criteria. Neurology 2016;87:2108–2116. [DOI] [PMC free article] [PubMed] [Google Scholar]
- 9.Desikan RS, Segonne F, Fischl B, et al. An automated labeling system for subdividing the human cerebral cortex on MRI scans into gyral based regions of interest. Neuroimage 2006;31:968–980. [DOI] [PubMed] [Google Scholar]
- 10.Holland D, Dale AM. Nonlinear registration of longitudinal images and measurement of change in regions of interest. Med Image Anal 2011;15:489–497. [DOI] [PMC free article] [PubMed] [Google Scholar]
- 11.Fischl B, Sereno MI, Tootell RB, Dale AM. High-resolution intersubject averaging and a coordinate system for the cortical surface. Hum Brain Mapp 1999;8:272–284. [DOI] [PMC free article] [PubMed] [Google Scholar]
- 12.Singer JD, Willett JB. Applied Longitudinal Data Analysis: Modeling Change and Event Occurrence. New York: Oxford University Press; 2003. [Google Scholar]
- 13.Shaw LM, Vanderstichele H, Knapik-Czajka M, et al. Cerebrospinal fluid biomarker signature in Alzheimer's Disease Neuroimaging Initiative subjects. Ann Neurol 2009;65:403–413. [DOI] [PMC free article] [PubMed] [Google Scholar]
- 14.Singh V, Chertkow H, Lerch JP, Evans AC, Dorr AE, Kabani NJ. Spatial patterns of cortical thinning in mild cognitive impairment and Alzheimer's disease. Brain 2006;129:2885–2893. [DOI] [PubMed] [Google Scholar]
- 15.Whitwell JL, Petersen RC, Negash S, et al. Patterns of atrophy differ among specific subtypes of mild cognitive impairment. Arch Neurol 2007;64:1130–1138. [DOI] [PMC free article] [PubMed] [Google Scholar]
- 16.Whitwell JL, Shiung MM, Przybelski BS, et al. MRI patterns of atrophy associated with progression to AD in amnestic mild cognitive impairment. Neurology 2008;70:512–520. [DOI] [PMC free article] [PubMed] [Google Scholar]
- 17.Edmonds EC, McDonald CR, Marshall A, et al. Early versus late MCI: improved MCI staging using a neuropsychological approach. Alzheimers Dement 2019;15:699–708. [DOI] [PMC free article] [PubMed] [Google Scholar]
- 18.Braak H, Thal DR, Ghebremedhin E, Del Tredici K. Stages of the pathological process of Alzheimer's disease: age categories from 1 to 100 years. J Neuropathol Exp Neurol 2011;70:960–969. [DOI] [PubMed] [Google Scholar]
- 19.Thomas KR, Edmonds EC, Delano-Wood L, Bondi MW. Longitudinal trajectories of informant-reported daily functioning in empirically defined subtypes of mild cognitive impairment. J Int Neuropsychol Soc 2017;23:521–527. [DOI] [PMC free article] [PubMed] [Google Scholar]
- 20.Edmonds EC, Weigand AJ, Thomas KR, et al. Increasing inaccuracy of self-reported subjective cognitive complaints over 24 months in empirically derived subtypes of mild cognitive impairment. J Int Neuropsychol Soc 2018;24:842–853. [DOI] [PMC free article] [PubMed] [Google Scholar]
- 21.Brooks BL, Iverson GL, Holdnack JA, Feldman HH. Potential for misclassification of mild cognitive impairment: a study of memory scores on the Wechsler Memory Scale-III in healthy older adults. J Int Neuropsychol Soc 2008;14:463–478. [DOI] [PubMed] [Google Scholar]
- 22.Bondi MW, Edmonds EC, Jak AJ, et al. Neuropsychological criteria for mild cognitive impairment improves diagnostic precision, biomarker associations, and prediction of progression. J Alzheimers Dis 2014;42:275–289. [DOI] [PMC free article] [PubMed] [Google Scholar]
- 23.Lenehan ME, Klekociuk SZ, Summers MJ. Absence of a relationship between subjective memory complaint and objective memory impairment in mild cognitive impairment (MCI): is it time to abandon subjective memory complaint as an MCI diagnostic criterion? Int Psychogeriatr 2012;24:1505–1514. [DOI] [PubMed] [Google Scholar]
- 24.Clark LR, Delano-Wood L, Libon DJ, et al. Are empirically derived subtypes of mild cognitive impairment consistent with conventional subtypes? J Int Neuropsychol Soc 2013;19:635–645. [DOI] [PMC free article] [PubMed] [Google Scholar]
- 25.Edmonds EC, Ard MC, Edland SD, Galasko DR, Salmon DP, Bondi MW. Unmasking the benefits of donepezil via psychometrically precise identification of mild cognitive impairment: a secondary analysis of the ADCS vitamin E and donepezil in MCI study. Alzheimers Dement 2017;4:11–18. [DOI] [PMC free article] [PubMed] [Google Scholar]
- 26.Eppig JS, Edmonds EC, Campbell L, Sanderson-Cimino M, Delano-Wood L, Bondi WM. Statistically derived subtypes and associations with cerebrospinal fluid and genetic biomarkers in mild cognitive impairment: a latent profile analysis. J Int Neuropsychol Soc 2017;23:564–576. [DOI] [PMC free article] [PubMed] [Google Scholar]
- 27.Murray ME, Graff-Radford NR, Ross OA, Petersen RC, Duara R, Dickerson DW. Neuropathologically defined subtypes of Alzheimer's disease with distinct clinical characteristics: a retrospective study. Lancet Neurol 2011;10:785–796. [DOI] [PMC free article] [PubMed] [Google Scholar]
- 28.Petersen RC, Thomas RG, Grundman M, et al. Vitamin E and donepezil for the treatment of mild cognitive impairment. N Engl J Med 2005;352:2379–2388. [DOI] [PubMed] [Google Scholar]
- 29.Cash DM, Ridgway GR, Liang Y, et al. The pattern of atrophy in familial Alzheimer disease: volumetric MRI results from the DIAN study. Neurology 2013;81:1425–1433. [DOI] [PMC free article] [PubMed] [Google Scholar]
- 30.Pini L, Pievani M, Bocchetta M, et al. Brain atrophy in Alzheimer's disease and aging. Aging Res Rev 2016;30:25–48. [DOI] [PubMed] [Google Scholar]
- 31.McDonald CR, Gharapetian L, McEvoy LK, et al. Relationship between regional atrophy rates and cognitive decline in mild cognitive impairment. Neurobiol Aging 2012;33:242–253. [DOI] [PMC free article] [PubMed] [Google Scholar]
- 32.Machulda MM, Lundt ES, Albertson SM, et al. Neuropsychological subtypes of incident mild cognitive impairment in the Mayo Clinic Study of Aging. Alzheimers Dement 2019;15:878–887. [DOI] [PMC free article] [PubMed] [Google Scholar]
Associated Data
This section collects any data citations, data availability statements, or supplementary materials included in this article.
Data Availability Statement
The data are available on request to qualified investigators. The data used for this study are available from the ADNI database (adni.loni.usc.edu).


