Abstract
Objective
To explore the accuracy of combined neurology expert forecasts in predicting primary endpoints for trials.
Methods
We identified one major randomized trial each in stroke, multiple sclerosis (MS), and amyotrophic lateral sclerosis (ALS) that was closing within 6 months. After recruiting a sample of neurology experts for each disease, we elicited forecasts for the primary endpoint outcomes in the trial placebo and treatment arms. Our main outcome was the accuracy of averaged predictions, measured using ordered Brier scores. Scores were compared against an algorithm that offered noncommittal predictions.
Results
Seventy-one neurology experts participated. Combined forecasts of experts were less accurate than a noncommittal prediction algorithm for the stroke trial (pooled Brier score = 0.340, 95% subjective probability interval [sPI] 0.340 to 0.340 vs 0.185 for the uninformed prediction), and approximately as accurate for the MS study (pooled Brier score = 0.107, 95% confidence interval [CI] 0.081 to 0.133 vs 0.098 for the noncommittal prediction) and the ALS study (pooled Brier score = 0.090, 95% CI 0.081 to 0.185 vs 0.090). The 95% sPIs of individual predictions contained actual trial outcomes among 44% of experts. Only 18% showed prediction skill exceeding the noncommittal prediction. Independent experts and coinvestigators achieved similar levels of accuracy.
Conclusion
In this first-of-kind exploratory study, averaged expert judgments rarely outperformed noncommittal forecasts. However, experts at least anticipated the possibility of effects observed in trials. Our findings, if replicated in different trial samples, caution against the reliance on simple approaches for combining expert opinion in making research and policy decisions.
Many decisions in neurology draw on expert judgments about the risks and benefits of new treatments. In the context of policy, experts are often called upon to provide judgments when making recommendations in clinical practice guidelines where high-level evidence is lacking.1–4 In research, combined (i.e., averaged) expert judgments, like those that might emerge from grant review panels or ethics committees, often inform decisions about which trials to fund, the selection of effect sizes underlying power calculations, or the risk/benefit appraisal of a trial. The unusual challenges in financing and conducting neurology trials also call for methods that elicit the most accurate judgments possible regarding the promise of new treatments.
Little is known about how well pooled neurology expertise can anticipate responses for treatments in trials. In clinical care settings, individual neurointensivists showed some ability to predict outcomes for mechanically ventilated patients, but limited ability to predict quality of life.5 In another study, individual neurosurgeons tended to offer overly optimistic predictions about the outcome of patients with severe head injury.6 Some commentators argue that public funding of neuroscience research initiatives reflect overly optimistic projections of impact.7 Outside of neurology, individual oncologists tend to overestimate the survival of patients.8,9
However, none of the above studies directly measured whether pooled expert judgments can be used to predict treatment responses in clinical trials. According to the principle of clinical equipoise, expert communities should not be able to reliably predict the outcome of clinical trials.10 However, for 3 reasons, expert communities should in principle manifest at least a modicum of skill in predicting trial outcomes on primary endpoints. First, pooled expert opinion should, in principle, be able to provide reasonably accurate predictions of disease progression for patients assigned to placebo, since such populations resemble those in clinical care (assuming the sample is similar to the general population). Second, even uncertain forecasts implied by clinical equipoise are potentially more informative than misinformed forecasts. Consider how this works in weather: a series of 50% predictions for rain might be highly uncertain and clinical equipoise–like, but nevertheless more accurate and informative than a series of 90% predictions if, in fact, it never rains. Third, whereas primary endpoints in trials typically concern a single measure of efficacy, clinical equipoise entails judgments about safety and quality of life as well as efficacy. Whereas primary outcome effects might be somewhat predictable in a trial, uncertainties underwriting clinical equipoise often concern the relationship between the magnitude of benefit and safety as well as quality of life concerns.
We used 3 randomized neurology trials to explore whether combined neurology expert predictions could outperform uninformative predictions in anticipating primary outcomes. Second, we tested whether the averaged predictions of coinvestigators associated with these trials were more accurate than those of independent experts, and characterized the prediction accuracy of individual experts in our sample.
Methods
Trial sample
We sought randomized interventional trials in 3 different areas of neurology that had the following characteristics: (1) relatively high-profile and hence likely to be familiar to experts not affiliated with the trial; (2) prospectively registered on ClinicalTrials.gov; (3) specifying an expected primary completion date between June 2015 and Jan 2016; (4) principal investigators of trial receptive to our using their trial for our prediction study, and sharing primary outcome results within a reasonable time frame; (5) access to a roster of coinvestigators. We further sought to have one trial in a disease area, relapsing-remitting multiple sclerosis (MS), where the baseline probability of a positive outcome was higher.
We used 3 trials that met these criteria: Effect of Natalizumab on Infarct Volume in Acute Ischemic Stroke (ACTION) (testing natalizumab in stroke),11 Supplementation of VigantOL® Oil Versus Placebo as Add-on in Patients With Relapsing Remitting Multiple Sclerosis Receiving Rebif® Treatment (SOLAR) (testing vitamin D in relapsing-remitting MS),12 and Efficacy, Safety and Tolerability Study of 1 mg Rasagiline in Patients With Amyotrophic Lateral Sclerosis (ALS) Receiving Standard Therapy (Riluzole): An AMG Trial With a Market Authorized Substance (ALS-Rag) (testing rasagiline in ALS).13 For all 3 trials, blinded interim analyses had been performed for data monitoring at the time predictions were elicited; the only information communicated to investigators at this time was a recommendation to continue recruitment. All 3 trials ultimately reached their target enrollment; outcomes on primary endpoints were statistically nonsignificant for all 3.
Expert sample
We sampled coinvestigators and neurologists who had no affiliation with the trials (independent experts). First, we solicited all coinvestigators for each trial and reconfirmed their status as coinvestigators. Second, we recruited a sample of independent preclinical and clinical experts for each trial based on coauthorship on recent research articles related to the trial. For the latter, we searched PubMed using MeSH terms for disease name and either drug name or drug type. For example, for ACTION, we searched for articles about stroke and natalizumab or inflammation. Authors on original publications were extracted in order of appearance to compile a list of approximately 50 eligible experts. Experts were approached up to 3 times by email, at weekly intervals. We sought a target of 10–15 experts per stratum for each trial. This sample size target was selected based on findings in judgment aggregation research that suggest sample sizes of 514 forecasters can be sufficient to achieve crowd accuracy better than the best individuals. Whereas these studies feature forecaster selection based on past performance, sample selection for our study was based on field expertise rather than performance. Target sample sizes used in our study reflect our secondary goal of probing for differences in forecast skill between coinvestigators and independent experts.
Forecast elicitation method
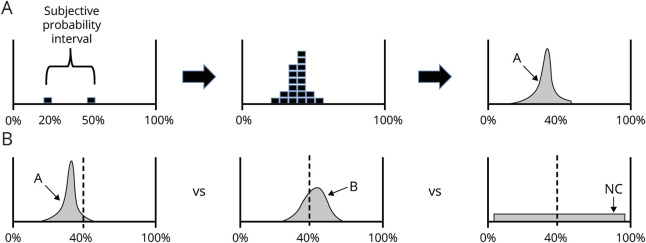
A schematic depiction of how we collected forecasts, and how they were scored for accuracy, is provided in figure 1. We elicited subjective probability distributions for primary outcome measures of evolution of disease in placebo and treatment arms, using an approach based on the Sheffield Elicitation Framework (SHELF), a well-established approach for collecting forecast distributions and scoring their accuracy.15 At invitation and before elicitation, experts were encouraged to review the ClinicalTrials.gov registration record, which contained details about sample size, patient eligibility, and treatment. The elicitation began by explaining the importance of trying to provide the most accurate predictions possible. It then proceeded to ask experts to forecast upper and lower 95% confidence boundaries (hereafter termed subjective probability intervals [sPIs], because they represent probabilistic beliefs obtained from participants rather than values estimated from a sampled population)16,17 on the primary endpoint for the placebo arm. For example, in our ALS study, experts were asked the highest 18-month patient survival rate (i.e., the proportion of patients surviving 18 months). In this context, the 95% sPI should be selected such that 95% of the actual predicted outcomes would be within the lower and upper bounds. The elicited intervals were then divided into up to 10 bins (aiming for bins of 2, 5, or 10 units), depending on how the interval could be reasonably divided. Experts were then given 20 “chips”—each representing approximately 5% of their probability belief—and asked to place one at each boundary (2 total). We then asked them to distribute the remaining 18 chips within the bins. The same procedure was repeated for the treatment arm. Before finalizing predictions, experts were asked to review their 2 distributions in relation to each other and revise their predictions if desired. Each expert was asked to offer forecasts for the placebo and treatment arms of only one trial. Experts in our sample used a median of 8.5 bins for their forecasts. In accordance with best practices in crowdsourcing predictions,18 judgments were elicited independently; that is, no information was shared among experts when the judgments were collected.
Figure 1. Collection and scoring of predictions.
(A) Elicitation. Predictions were collected from each expert in 3 steps. First, experts were asked to state the upper and lower boundary of treatment response they expect (subjective probability interval). Here, the expert is expressing that he or she is 95% certain the measured effect for treatment arm (proportion of patients with multiple sclerosis [MS] who have disease-free status at week 48) will fall between 20% and 50%. Next, the expert was given 18 chips and asked to fill in his or her distribution. In the third step, the prediction is mathematically smoothed. In the top panel, the expert has assigned the highest probability to 37% of patients being free from disease activity at 48 weeks. (B) Scoring. In the above illustration, consider predictions elicited from 2 experts (A and B) about outcomes in the treatment arm for the MS trial. The dashed line at 40% indicates the actual proportion of disease-free patients at 48 weeks reported for the trial. Note that A's predictions are sharp, assigning greater probability to a narrow range of outcome possibilities; B's predictions are more uncertain because they include a wider range of possible results. Both A and B have captured the actual outcome within their distribution, but a large amount of their predictions include values that are much higher or lower than actual measured results. The noncommittal prediction algorithm (NC) assigns the same probability for all outcomes between 2.5% and 97.5%. In this example, B's prediction skill will be scored as better (i.e., a lower ordered Brier score) than A's, because A produced a subjective probability distribution that exhibited higher confidence in values that were distant from the observed trial outcome.
Interviews
Predictions were collected over the course of a 20–30 minute interview, face-to-face, by telephone, or by video chat. Experts were offered 5 minutes of standardized instruction on our elicitation method. Experts were free to ask questions about the elicitation approach, and individuals performing elicitations could intervene when experts provided responses that indicated they might have misunderstood the task (e.g., after specifying a range, placing chips outside the range; using more than 20 chips). Then, basic demographic information was collected, followed by the forecast elicitation as described above. All interviews were conducted from March to November 2015 (stroke trial), March to September 2015 (MS trial), and July to December 2016 (ALS trial).
Analysis
Results of trials were obtained from publications or ClinicalTrials.gov. Combined predictions in each of the placebo and treatment arms for each trial were calculated by averaging individual forecast distributions across experts using the algorithm provided within the SHELF framework, which combines forecast distributions of individual forecasters into one combined distribution per question. Estimates of differences between outcomes in placebo and treatment arms were based on the median estimates of each forecaster.
Combined and individual forecast distributions were scored for accuracy using the ordered Brier scoring rule. This scoring rule adapts the Brier score, which is normally used to score prediction skill for binary events (e.g., the occurrence or nonoccurrence of an event) to predictions across a continuous variable. Brier scores measure the average squared deviation between a prediction and the true answer, coded as 1 if an event occurs, and 0 otherwise. As implied, Brier scores penalize confident, inaccurate forecasts especially strongly.
We use the variant of the score adapted to ordered categories.19 Ordered scoring rules penalize experts less if their predictions approach the actual results. Thus, ordered scores tend to be lower than those used to assess binary forecasts, holding skill levels constant. Experts receive better scores if their predictions are closer to the actual results. The minimum score of 0 denotes perfect accuracy, while the maximum possible score of 1 denotes perfect inaccuracy. In the context of the current elicitation of forecasts across ordered categories, Brier scores should not be interpreted as high or low in an absolute sense, as scores vary across cases for reasons other than prediction skill. As an approximate guide, ordered Brier score values denote skill if they are lower than those earned by noncommittal prediction algorithms, as discussed below.
As a secondary outcome measure, we calculated a rescaled ordered Brier score, in which the scores across participants for each trial were rescaled to a distribution with a mean of 0 and an SD of 1. This enables comparisons of relative accuracy scores across trials, similar to combining scores in a meta-analysis across different scales of pain or other metrics. Brier scores for each expert were derived by averaging their Brier scores for treatment and placebo arm predictions.
To benchmark forecast skill, we calculated Brier scores based on noncommittal prediction algorithms. For the MS and ALS trials, which both used a proportion primary endpoint, the noncommittal prediction was defined as a flat probability distribution ranging from 0% to 100%. More specifically, we divided the range of possible outcomes for the primary efficacy endpoint (proportions of patients, for both trials) into 10 bins. The bottom border of the lowest bin was 2.5% and the top border of the highest bin was 97.5%. This setup was identical to the maximum number of bins available to the experts. The range of probabilities was then divided equally across the 10 bins, the equivalent of placing 2 out of 20 chips in each of 10 bins. For the stroke trial, we defined the noncommittal prediction as a uniform distribution ranging from complete disappearance of the infarct (i.e., −100%) to a growth in infarct volume that, based on consultation with a stroke neuroimaging specialist, would be expected to be fatal in 80% of patients (+1,500%). These distributions are uninformed, but also relatively cautious, so they do not produce extremely high Brier scores, that is, high squared errors denoting extreme inaccuracy. In contrast, highly confident (i.e., very sharp) forecast distributions may yield very low or very high Brier scores.
Our primary analysis probed whether averaging the forecasts of our expert sample resulted in predictions that were more accurate than noncommittal prediction algorithms. Sampling variation was estimated through bootstrapping, running 500 iterations by resampling forecast distributions, while keeping the number of observations equal to the actual number per trial and arm.
Secondarily, we probed average forecast skill of individual experts. We calculated ordered Brier scores for each pooled distribution, calculated for each bootstrap iteration.
To assess the accuracy of individual experts, we calculated how often the observed value of each endpoint fell within the middle 95% of the probability distribution for each individual expert's forecasts (referred to as individual expert 95% sPI). To account for sampling error in estimating trial outcomes, we also calculated the proportion of individual experts' 95% sPIs that contained values within 2 standard errors of the observed outcomes. We also used a linear mixed-effects regression model with random intercepts for study arm to test the relationship between forecast skill and the following characteristics of individuals: coinvestigators vs independent experts (binary), h-index (continuous variable), and trial experience (categorical variable with levels high, low, and unknown). We defined statistical significance as p ≤ 0.05. As all analyses were exploratory, adjustments for multiple comparisons were performed only as a sensitivity analysis, by using wider 99% confidence intervals (CIs) in addition to 95% CIs in aggregate accuracy comparisons.
Standard protocol approvals, registrations, and patient consents
Our protocol received ethics approval from McGill IRB and Charité. All participants provided written informed consent prior to the interview.
Data availability
Anonymized data will be made available upon request to the corresponding author.
Results
Expert sample
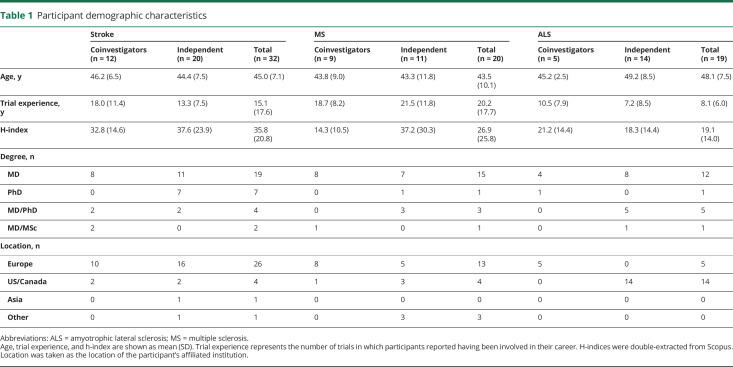
We invited 220 disease experts; 71 agreed to participate in our survey (32% response rate). All participants who started the survey also completed it. Demographic characteristics of survey respondents are provided in table 1.
Table 1.
Participant demographic characteristics
Primary outcome aggregated absolute predictions
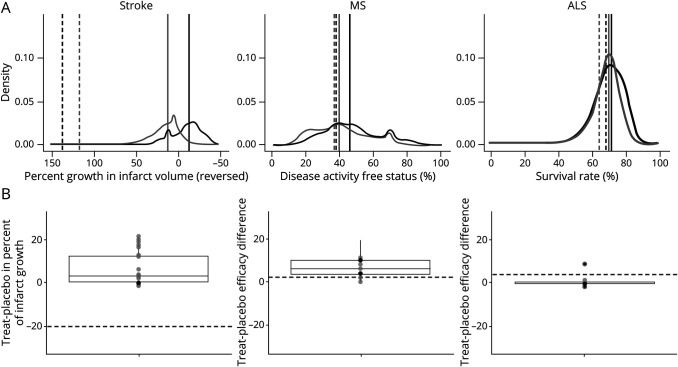
Combined absolute predictions on primary outcome measures for placebo response were similar to those for experimental intervention for all 3 trials (figure 2A). Combined estimates of outcomes for placebo and treatment arms did not consistently point to an expectation that experimental interventions would show a large advantage over placebo (figure 2B). For all 3 trials, the interquartile range across experts of their median predictions of treatment effects did not capture reported treatment effects.
Figure 2. Aggregated predictions of response and treatment effects.
(A) Probability density functions for efficacy endpoints. Horizontal axes have been scaled so that more favorable clinical outcomes are represented farther to the right. Gray distributions reflect averaged predictions for placebo arms; black distributions are averaged predictions for experimental arms. Solid vertical lines denote medians of aggregated forecast distributions for placebo and experimental arms; dotted lines denote median observed values in trial publication. (B) Predicted differences between experimental treatment and control. Predicted treatment differences were derived from probability densities by subtracting median placebo prediction for each forecaster from the median forecast for the experimental treatment; positive values thus denote a predicted positive clinical effect of the experimental treatment. Dotted line represents actual difference observed in trial. ALS = amyotrophic lateral sclerosis; MS = multiple sclerosis.
Combined expert prediction skill
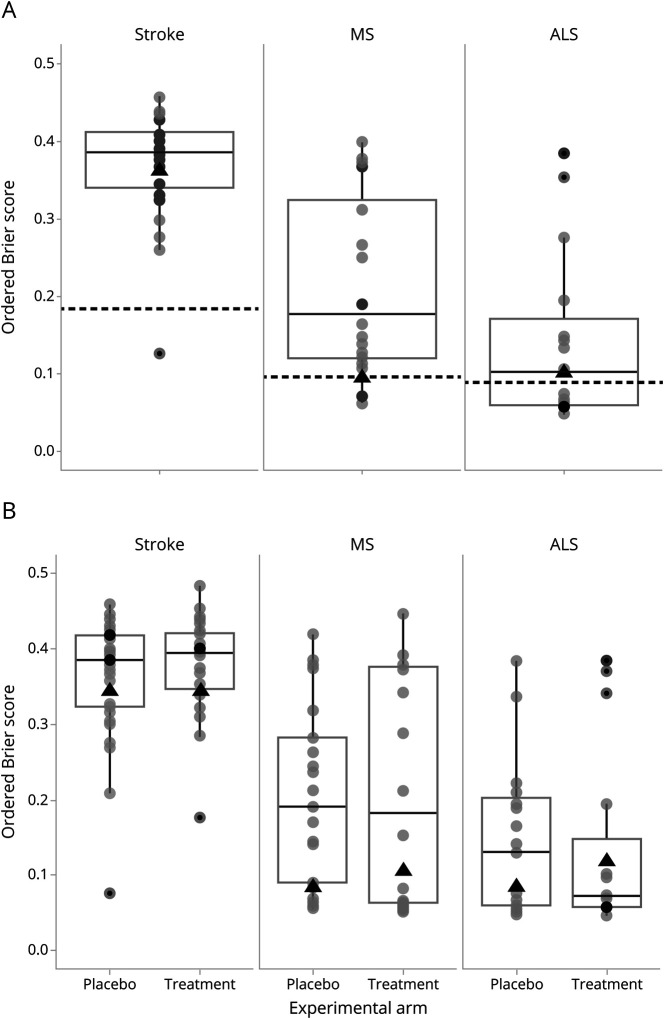
Forecast skill for combined expert predictions in each of the 3 trials is reflected in figure 3; scores are presented against a noncommittal prediction algorithm, whereby forecasts were uniform across the range from worst to best possible outcomes for all patients.
Figure 3. Ordered Brier scores for all forecasters for 3 neurology trials.
(A) Combined placebo and treatment arms. (B) Separated placebo and treatment arms. Each forecaster is represented with a circle. Box plots show medians and 25% and 75% percentiles of distributions across participants. Dotted black lines denote Brier scores for noncommittal forecast algorithms. Black triangles display the mean Brier scores for the aggregated distribution across all experts. ALS = amyotrophic lateral sclerosis; MS = multiple sclerosis.
Combined predictions of experts resulted in predictions that were significantly less accurate than the noncommittal algorithm for the stroke trial, yielding identical mean Brier scores for each of the 2 arms = 0.340 (95% CI 0.340–0.340, as both limits of the prediction distributions were situated above the observed value) vs 0.185 for the noncommittal algorithm. Combined predictions were approximately as accurate as the noncommittal algorithm for both the MS study (mean pooled Brier across 2 arms = 0.095, 95% CI 0.081–0.133 vs 0.098 for the noncommittal algorithm) and the ALS study (mean pooled Brier across the 2 arms = 0.103, 95% CI 0.081–0.185 vs 0.090 for the noncommittal algorithm). The pattern for all the 3 trials was identical when using wider 99% bootstrap CIs rather than 95% CIs.
Forecasts for the placebo arms in the MS and ALS studies were somewhat more accurate than the noncommittal algorithm: mean Brier = 0.085, 95% CI 0.081–0.098 vs 0.098 for noncommittal algorithm in MS and mean Brier = 0.087, 95% CI 0.081–0.133 vs 0.090 for noncommittal algorithm in the ALS study. Forecasts for the treatment arms were less accurate than the noncommittal algorithm: mean Brier = 0.105, 95% CI 0.081– 0.133 vs 0.098 for noncommittal algorithm in MS and mean Brier = 0.119, 95% CI 0.98–0.185 vs 0.090 for noncommittal algorithm in ALS (figure 3B).
Combined forecasts of coinvestigators did not show greater optimism about the efficacy advantage of treatment over placebo arms vs the combined forecasts of independent experts (data not shown). When each group's forecast distributions were combined, coinvestigators and independent experts had similar accuracy in predicting primary endpoint outcomes across the 2 arms (Brier scores: 0.340 for coinvestigators vs 0.340 for independent experts in the stroke study, 0.133 vs 0.090 for the MS study, and 0.116 vs 0.107 for the ALS study).
Individual expert prediction skill
The 95% sPI of each expert's individual forecast distribution contained the observed trial outcomes among 3.1%, 81.6%, and 71.8% of stroke, MS, and ALS experts, respectively. A sensitivity analysis calculated the proportions of individual experts' 95% sPIs containing values within 2 standard errors of the observed outcomes. The estimates were only available for the MS and ALS trials, which utilized proportions as efficacy outcomes. These proportions were 89.5% and 82.1% of MS and ALS experts, respectively. For all 3 trials, prediction skill of individual experts generally underperformed the noncommittal algorithm. Few experts (3%) predicted more accurately than the noncommittal algorithm for stroke, whereas 15% and 47% of experts provided more accurate predictions than the noncommittal algorithm for MS and ALS, respectively. Individual expert skill in predicting outcomes was similar for placebo and treatment arms.
The accuracy of combined estimates exceeded the accuracy of individual experts for 2 of the trials (stroke and MS). Specifically, combining predictions generally resulted in Brier scores that were lower (better) than 69% and 75% of individual predictions for the placebo and treatment arms of the stroke trial, 81% and 56% for the MS trial, and 53% and 37% for the ALS trial.
Factors associated with individual prediction skill
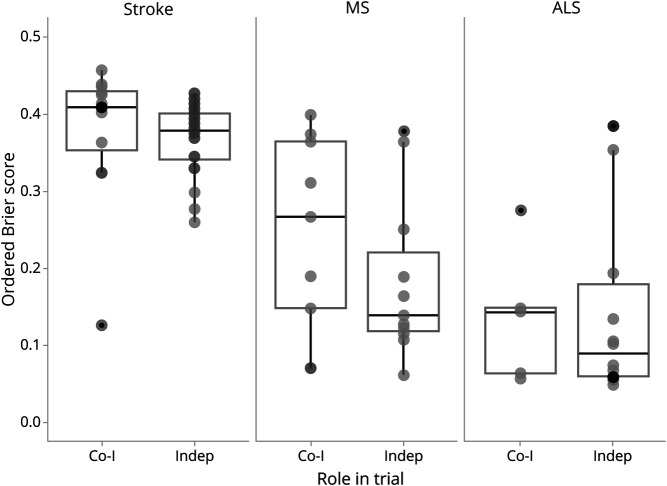
The proportions of individual coinvestigators and independent experts who made predictions that were more accurate than the noncommittal algorithm were as follows: 8% for coinvestigators vs 0% for independent experts in the stroke trial, 22% vs 9% in the MS trial, and 40% vs 50% for the ALS trials. Across the 3 trials, independent experts and coinvestigators did not differ significantly in forecast accuracy (table 2). Within each individual trial, independent experts achieved approximately equal Brier scores relative to coinvestigators for the stroke trial (coinvestigators mean 0.38 [SD 0.09] vs independent 0.37 [0.05]), the MS trial (coinvestigators 0.25 [0.14] vs independent 0.18 [0.12]), and the ALS trial (coinvestigators 0.14 [0.10] vs independent 0.15 [0.13]) (figure 4). Independent experts and coinvestigators did not show large skill differences in predicting responses in either placebo or treatment arms.
Table 2.
Predictors of forecast accuracy, expressed in terms of standardized Brier scores, based on responses across 3 trials
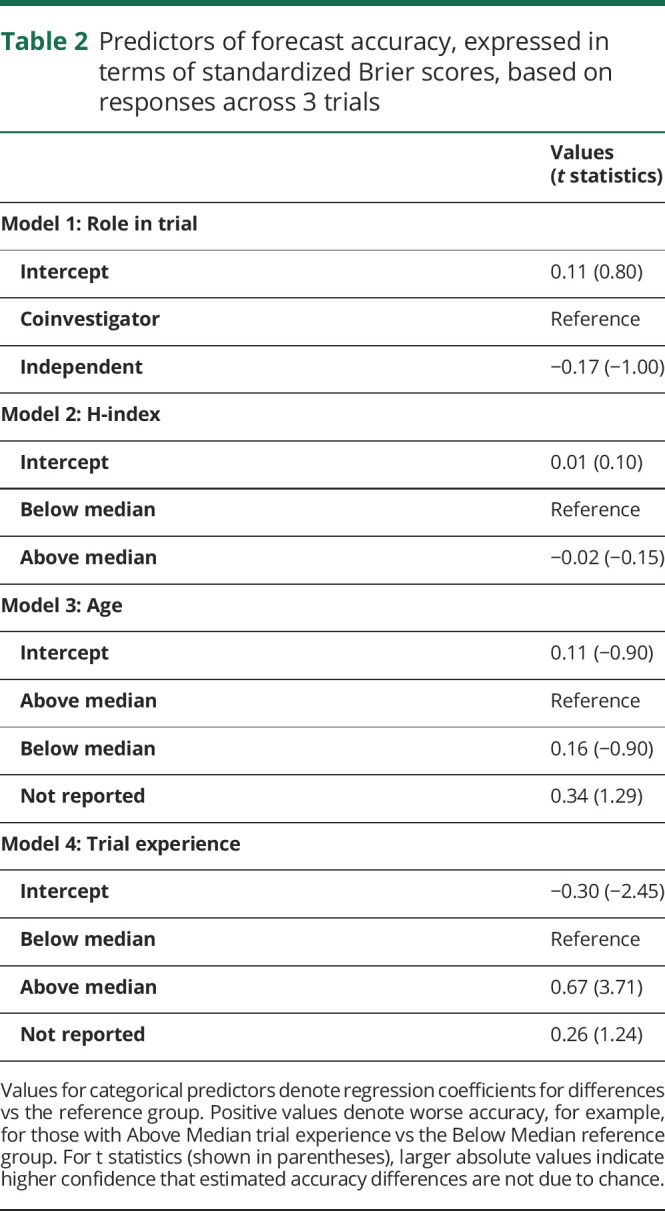
Figure 4. Ordered Brier scores for efficacy outcomes, combined across placebo and treatment arms, by coinvestigator (Co-I) vs non-coinvestigator (Indep) role.
Box plots reflect interquartile range and medians. ALS = amyotrophic lateral sclerosis; MS = multiple sclerosis.
We performed exploratory analyses to test for association between expert characteristics and forecasting skill (table 2). Experience in trials had a negative association with accuracy: experts with above-median years of trial experience registered higher (worse) Brier scores than those with below-median experience. Research output and impact, as measured by the h-index, was not associated with better or worse Brier scores. Age was also unrelated to accuracy.
Discussion
Combining predictions of neurology experts did not produce accurate predictions of primary endpoint outcomes for treatment arms any better than a noncommittal algorithm, which assigns the same probability of trial outcomes across the full range of possibilities. Combined judgments for the control arms outperformed the noncommittal algorithm by a small margin for 2 out of the 3 trials. The stroke trial proved especially difficult for experts to forecast. This likely reflects the unbounded format of the outcome variable, percentage change in infarct volume. It also likely underscores the limited familiarity and clinical actionability for the imaging endpoints used in that trial. However, the endpoints used in the MS and ALS trials—disease activity free status and survival rate, respectively—are common and should be readily interpretable by experts in these disease areas. That the wisdom of expert communities failed to outperform uninformative forecasting, like the noncommittal algorithm, might be taken as evidence that our sample of experts was poorly informed about the trials they were asked to forecast. However, 37.5% of our sample were coinvestigators and hence well-acquainted with the design characteristics and eligibility of patients entering the trial. That coinvestigators did not show major differences with independent experts suggests a complete misunderstanding of trial methods is less plausible. We further note that combined expert opinion did exhibit realistic skepticism regarding the relative effectiveness of treatment vs placebo. Our inability to use crowdsourcing to predict outcomes in the treatment arm of all trials is consistent with studies of oncologists predicting cancer trial outcomes and researchers predicting preclinical cancer replication study outcomes,20,21 but contrasts with success using crowdsourcing to accurately forecast medical prognoses,14 diagnosis,22,23 and emergence of epidemic diseases.24–26
At the level of individual experts, 19% of neurologist experts outperformed the noncommittal algorithm. Focusing only on the MS and ALS trials, approximately 76% of individual 95% sPIs captured the mean observed result, indicating moderate overconfidence in relation to observed outcomes, in line with what others have seen with prediction in other areas.27 It should be noted that estimates provided in trials themselves reflect random variation. If we account for this and credit experts for forecasts that come close to the observed outcomes, the proportion of 95% sPIs capturing the observed outcomes increases to 90% for MS experts and 82% for ALS experts. That 95% sPIs for most MS and ALS experts contained the actual outcome for each trial arm indicates some skill in anticipating outcomes.
While combining forecasts for placebo arms resulted in better predictions than the noncommittal algorithm for 2 of the trials, and experts expressed generally realistic expectations about differences between placebo and treatment arms, expert forecasts underperformed the noncommittal algorithm for treatment arm estimates. It is possible that providing experts with model-based information on expected response in placebo arms would enable greatly improved prediction of disease response in treatment arms. The limited prediction skill exhibited by individual neurology experts somewhat conflicts with evidence elsewhere showing neurologists have moderate to good skills in predicting outcomes for critically ill neurologic patients5 and functional outcomes after intracerebral hemorrhage.28,29
Our findings should be interpreted in light of several limitations. First, with only 6 events (2 arms in 3 trials) and no previous studies of prediction in neurology research, the present study should be understood as hypothesis generating, and patterns observed in this study may not generalize to other neurology trials. The observed outcomes of the trials are subject to potential biases and random variation. Expert forecasts may have fared better had they been assessed relative to an idealized “true” outcome for each trial. However, such values would be impossible to obtain absent numerous repetitions of the trials in our study. As none of the 3 trials resulted in a positive outcome, our study was not able to measure how well expert forecasts could discriminate between effective and ineffective treatments tested in trials. This limitation reflects the practical constraints our team encountered in identifying neurology trials that met eligibility criteria. Second, though our participants were either coinvestigators in each trial or productive researchers with relevant expertise, we cannot exclude the possibility that a different sample of experts might have shown greater skill. It might also be informative to examine predictions generated by a wider pool of knowledgeable individuals, including practitioners. Third, we did not directly elicit estimates of differences between treatment and placebo. Thus, our observation that predicted differences were realistically skeptical is based on assumptions about independence between treatment and placebo predictions and should be interpreted with caution. Fourth, that predictions were so far off for the stroke study demonstrates the sensitivity of our methodology to familiarity with endpoints. Fifth, our results are based on a particular method of eliciting forecasts and aggregating them. It is possible that other elicitation approaches, stronger performance incentives, or different methods for combining predictions might produce greater accuracy. At the same time, it is possible that the settings in which research decisions actually take place would produce worse forecasts due to factors like groupthink or risk aversion.30 Finally, the noncommittal algorithm yields identical predictions for the placebo and treatment arms. Therefore, they would not be expected to perform as well if the trials observed large treatment effects.
The fact that at least some experts (but not all of them) entertained the possibility of disease responses in treatment arms for each of the trials in our study is consistent with there having been a state of clinical equipoise at the time of elicitation. Moreover, even the extreme and confident pessimism expressed in the ALS trial does not rule out equipoise. Given the safety profile of rasagiline, the nonavailability of effective disease-modifying treatments, and the inexorable course of ALS, harboring a low but nonzero expectation of observing a treatment benefit is compatible with the trial having fulfilled clinical equipoise. However, the observation that most experts were unable to outperform a completely noncommittal prediction algorithm, even for the placebo arm, suggests deficits in prediction skill, rather than intrinsic unpredictability of trial outcomes.
Decision-making in research by definition entails high levels of uncertainty. If replicated in other studies, our findings would have several possible implications for decision-making in research. First, if combined forecasts outperform the majority of individual estimates, synthesizing diverse viewpoints is critical for good decision-making about trial design and priority setting.18 Second, our findings suggest that simple wisdom of the crowd approaches for estimating treatment effects are unlikely to be an adequate substitute for randomized trials in neurology. Finally, in our study, coinvestigators were no more optimistic and no more skilled at prediction than independent investigators. Such findings, should they generalize, are reassuring for human protections and informed consent. They suggest that the individuals who enroll their own patients are not any more likely than independent experts to harbor biases that would interfere with balanced communications about risk and benefit.
Acknowledgment
The authors thank the neurologists and experts who participated in the study and Russell Steele and Joachim Fiebach for consultation.
Glossary
- ACTION
Effect of Natalizumab on Infarct Volume in Acute Ischemic Stroke
- ALS
amyotrophic lateral sclerosis
- ALS-Rag
Efficacy, Safety and Tolerability Study of 1 mg Rasagiline in Patients With Amyotrophic Lateral Sclerosis (ALS) Receiving Standard Therapy (Riluzole): An AMG Trial With a Market Authorized Substance
- CI
confidence interval
- MS
multiple sclerosis
- SOLAR
Supplementation of VigantOL® Oil Versus Placebo as Add-on in Patients With Relapsing Remitting Multiple Sclerosis Receiving Rebif® Treatment
- sPI
subjective probability interval
Appendix. Authors
Footnotes
Podcast: NPub.org/3xoxf9
Study funding
Canadian Institutes of Health Research (EOG 201303).
Disclosure
The authors report no relevant disclosures. Go to Neurology.org/N for full disclosures.
References
- 1.Poonacha TK, Go RS. Level of scientific evidence underlying recommendations arising from the National Comprehensive Cancer Network clinical practice guidelines. J Clin Oncol 2011;29:186–191. [DOI] [PubMed] [Google Scholar]
- 2.Hart RG, Bailey RD. An assessment of guidelines for prevention of ischemic stroke. Neurology 2002;59:977–982. [DOI] [PubMed] [Google Scholar]
- 3.Shaneyfelt TM, Centor RM. Reassessment of clinical practice guidelines: go gently into that good night. JAMA 2009;301:868–869. [DOI] [PubMed] [Google Scholar]
- 4.Tricoci P, Allen JM, Kramer JM, Califf RM, Smith SC. Scientific evidence underlying the ACC/AHA clinical practice guidelines. JAMA 2009;301:831–841. [DOI] [PubMed] [Google Scholar]
- 5.Finley Caulfield A, Gabler L, Lansberg MG, et al. Outcome prediction in mechanically ventilated neurologic patients by junior neurointensivists. Neurology 2010;74:1096–1101. [DOI] [PMC free article] [PubMed] [Google Scholar]
- 6.Kaufmann MA, Buchmann B, Scheidegger D, Gratzl O, Radü EW. Severe head injury: should expected outcome influence resuscitation and first-day decisions? Resuscitation 1992;23:199–206. [DOI] [PubMed] [Google Scholar]
- 7.Hendricks VF. Scientific Research Can Be Prone to Bubbles Too: Neuroscience Risks Being the Next One [online]. The Conversation; 2014. Available at: theconversation.com/scientific-research-can-be-prone-to-bubbles-too-neuroscience-risks-being-the-next-one-33797. Accessed September 14, 2018. [Google Scholar]
- 8.Mackillop WJ, Quirt CF. Measuring the accuracy of prognostic judgments in oncology. J Clin Epidemiol 1997;50:21–29. [DOI] [PubMed] [Google Scholar]
- 9.Christakis NA, Smith JL, Parkes CM, Lamont EB. Extent and determinants of error in doctors' prognoses in terminally ill patients: prospective cohort study. BMJ 2000;320:469–473. [DOI] [PMC free article] [PubMed] [Google Scholar]
- 10.Freedman B. Equipoise and the ethics of clinical research. N Engl J Med 1987;317:141–145. [DOI] [PubMed] [Google Scholar]
- 11.Elkins J, Veltkamp R, Montaner J, et al. Safety and efficacy of natalizumab in patients with acute ischaemic stroke (ACTION): a randomised, placebo-controlled, double-blind phase 2 trial. Lancet Neurol 2017;16:217–226. [DOI] [PubMed] [Google Scholar]
- 12.Supplementation of VigantOL® Oil Versus Placebo as Add-on in Patients With Relapsing Remitting Multiple Sclerosis Receiving Rebif® Treatment (SOLAR) [online]. Available at: clinicaltrials.gov/ct2/show/NCT01285401. Accessed September 14, 2018. [Google Scholar]
- 13.Ludolph AC, Schuster J, Dorst J, et al. Safety and efficacy of rasagiline as an add-on therapy to riluzole in patients with amyotrophic lateral sclerosis: a randomised, double-blind, parallel-group, placebo-controlled, phase 2 trial. Lancet Neurol 2018;17:681–688. [DOI] [PubMed] [Google Scholar]
- 14.Kattan MW, O'Rourke C, Yu C, Chagin K. The wisdom of crowds of doctors: their average predictions outperform their individual ones. Med Decis Making 2016;36:536–540. [DOI] [PubMed] [Google Scholar]
- 15.Oakley J, O'Hagan A. SHELF: the Sheffield Elicitation Framework (version 2.0) [online]. 2010. Available at: tonyohagan.co.uk/shelf/. Accessed February 13, 2013. [Google Scholar]
- 16.Garthwaite PH, Kadane JB, O'Hagan A. Statistical methods for eliciting probability distributions. J Am Stat Assoc 2005;100:680–701. [Google Scholar]
- 17.Murphy AH, Winkler RL. Credible interval temperature forecasting: some experimental results. Mon Wea Rev 1974;102:784–794. [Google Scholar]
- 18.Surowiecki J. The Wisdom of Crowds: Why the Many Are Smarter than the Few and How Collective Wisdom Shapes Business, Economies, Societies, and Nations. New York: Doubleday & Co; 2004. [Google Scholar]
- 19.Jose VRR, Nau RF, Winkler RL. Sensitivity to distance and baseline distributions in forecast evaluation. Manag Sci 2009;55:582–590. [Google Scholar]
- 20.Benjamin D, Mandel DR, Kimmelman J. Clinical Researchers Perceive Risk and Benefit Uniquely when Forecasting the Results of Cancer Trials. Vancouver: Society for Judgment and Decision Making; 2017. [Google Scholar]
- 21.Benjamin D, Mandel DR, Kimmelman J. Can cancer researchers accurately judge whether preclinical reports will reproduce? PLOS Biol 2017;15:e2002212. [DOI] [PMC free article] [PubMed] [Google Scholar]
- 22.Kurvers RHJM, Herzog SM, Hertwig R, et al. Boosting medical diagnostics by pooling independent judgments. PNAS 2016;113:8777–8782. [DOI] [PMC free article] [PubMed] [Google Scholar]
- 23.Kurvers RHJM, Krause J, Argenziano G, Zalaudek I, Wolf M. Detection accuracy of collective intelligence assessments for skin cancer diagnosis. JAMA Dermatol 2015;151:1346–1353. [DOI] [PubMed] [Google Scholar]
- 24.Tung C, Chou T, Lin J. Using prediction markets of market scoring rule to forecast infectious diseases: a case study in Taiwan. BMC Public Health 2015;15:766. [DOI] [PMC free article] [PubMed] [Google Scholar]
- 25.Li EY, Tung C-Y, Chang S-H. The wisdom of crowds in action: forecasting epidemic diseases with a web-based prediction market system. Int J Med Inform 2016;92:35–43. [DOI] [PubMed] [Google Scholar]
- 26.Polgreen PM, Nelson FD, Neumann GR. Using prediction markets to forecast trends in infectious diseases. Microbe 2006;1. [DOI] [PubMed] [Google Scholar]
- 27.Moore DA, Tenney ER, Haran U. Overprecision in Judgment: The Wiley Blackwell Handbook of Judgment and Decision Making [online]. John Wiley & Sons, Ltd; 2015:182–209. Available at: onlinelibrary.wiley.com/doi/abs/10.1002/9781118468333.ch6. Accessed December 18, 2018. [Google Scholar]
- 28.Navi BB, Kamel H, McCulloch CE, et al. Accuracy of neurovascular fellows' prognostication of outcome after subarachnoid hemorrhage. Stroke 2012;43:702–707. [DOI] [PubMed] [Google Scholar]
- 29.Hwang DY, Dell CA, Sparks MJ, et al. Clinician judgment vs formal scales for predicting intracerebral hemorrhage outcomes. Neurology 2016;86:126–133. [DOI] [PMC free article] [PubMed] [Google Scholar]
- 30.Sunstein C. Infotopia: How Many Minds Produce Knowledge. Oxford: Oxford University Press; 2006. [Google Scholar]
Associated Data
This section collects any data citations, data availability statements, or supplementary materials included in this article.
Data Availability Statement
Anonymized data will be made available upon request to the corresponding author.


