Abstract
Objective
To determine whether neurofilament light (NfL), glial fibrillary acidic protein (GFAP), tau, and ubiquitin C-terminal hydrolase-L1 (UCH-L1) measured in serum relate to traumatic brain injury (TBI) diagnosis, injury severity, brain volume, and diffusion tensor imaging (DTI) measures of traumatic axonal injury (TAI) in patients with TBI.
Methods
Patients with TBI (n = 162) and controls (n = 68) were prospectively enrolled between 2011 and 2019. Patients with TBI also underwent serum, functional outcome, and imaging assessments at 30 (n = 30), 90 (n = 48), and 180 (n = 59) days, and 1 (n = 84), 2 (n = 57), 3 (n = 46), 4 (n = 38), and 5 (n = 29) years after injury.
Results
At enrollment, patients with TBI had increased serum NfL compared to controls (p < 0.0001). Serum NfL decreased over the course of 5 years but remained significantly elevated compared to controls. Serum NfL at 30 days distinguished patients with mild, moderate, and severe TBI from controls with an area under the receiver-operating characteristic curve (AUROC) of 0.84, 0.92, and 0.92, respectively. At enrollment, serum GFAP was elevated in patients with TBI compared to controls (p < 0.001). GFAP showed a biphasic release in serum, with levels decreasing during the first 6 months of injury but increasing over the subsequent study visits. The highest AUROC for GFAP was measured at 30 days, distinguishing patients with moderate and severe TBI from controls (both 0.89). Serum tau and UCH-L1 showed weak associations with TBI severity and neuroimaging measures. Longitudinally, serum NfL was the only biomarker that was associated with the likely rate of MRI brain atrophy and DTI measures of progression of TAI.
Conclusions
Serum NfL shows greater diagnostic and prognostic utility than GFAP, tau, and UCH-L1 for subacute and chronic TBI.
Classification of evidence
This study provides Class III evidence that serum NfL distinguishes patients with mild TBI from healthy controls.
Traumatic brain injury (TBI) is one of the leading causes of mortality, morbidity, and high burden of disability.1 TBI is a complex disorder in which several pathophysiologic processes may occur depending on the injury subtype, including axonal injury, astrogliosis, and neuronal injury or death.2,3 There is a great need to identify and measure these injury subtypes noninvasively and reliably to develop mechanistically appropriate therapies.
TBI is recognized as a risk factor for late-life neurodegeneration.4–6 This evidence is especially strong in those with moderate to severe TBI.4–6 The mechanism of neurodegeneration is attributed to traumatic axonal injury (TAI), a direct consequence of trauma to the head. TAI could potentially be quantified with diffusion tensor imaging (DTI) MRI, which measures the diffusion of water in axons.7 However, DTI has several limitations, including limited availability, high cost, and cumbersome image postprocessing.7 TAI can also be assessed with CSF neurofilament light (NfL) protein or tau, with the former shown to be highly sensitive.8–10 Accessing CSF requires lumbar puncture, which is invasive and not readily available. Recent developments in the immunoassay technology field have made it possible to reliably measure tau and NfL in blood samples from both those with disease and healthy individuals.11,12 This technique has been modified to quantify glial fibrillary acidic protein (GFAP), a marker of astrogliosis, and ubiquitin C-terminal hydrolase-L1 (UCH-L1), a cytosolic neuronal protein.13 When measured acutely after TBI, these 4 candidate blood biomarkers have shown utility in distinguishing patients with intracranial hemorrhage on CT from those with negative CT findings.13–15 Blood NfL and tau have also shown utility in athletes with concussion when measured within hours after injury.16 To the best of our knowledge, NfL, GFAP, tau, and UCH-L1 have not been examined in patients with subacute and chronic TBI, across spectrum of TBI severities, or in relation to advanced imaging modalities such as DTI.
In this study, we examine NfL, GFAP, tau, and UCH-L1 in clinic-based patients with mild TBI (mTBI), moderate TBI, and severe TBI and longitudinal assessments for up to 5 years after injury. We hypothesized that patients with TBI would have increased concentrations of axonal and glial proteins in serum compared with controls, with higher concentrations in moderate or severe cases, and that concentrations of axonal and glial proteins would correlate with functional outcome, brain volumes, and DTI measures of TAI.
Methods
Study design and participants
In this prospective cohort study, we enrolled patients with subacute and chronic TBI between 2011 and 2019 at the Clinical Center, NIH, Bethesda, MD. The inclusion criteria for the TBI participants were as follows: (1) male or female >18 years of age; (2) clinical diagnosis of nonpenetrating TBI, and (3) injury occurring <1 year before enrollment. Exclusion criteria included (1) contraindications to MRI, including foreign metallic objects and noncompatible metallic devices or objects; (2) a history of major neurologic or psychiatric conditions such as multiple sclerosis, stroke, spinal cord injury, or psychosis; and (3) pregnancy. The severity of TBI was based on clinical history and the Department of Defense (DoD) and Veterans Affairs (VA) criteria.17,18 According to the DoD/VA criteria, a patient is classified as having mTBI if there is no abnormality on brain CT or conventional MRI. Thus, the CT and MRIs (T1- and T2-weighted and fluid-attenuated inversion recovery sequences) were assessed by a board-certified radiologist at the Clinical Center, NIH to ensure that patients were correctly classified in each severity category. Inclusion criteria for healthy controls were (1) ≥18 years of age, (2) good general medical and psychological health based on history and physical examination by licensed medical staff, (3) no history of heavy alcohol use or substance abuse, and (4) no history of head injury, regardless of cause. The participants were also offered longitudinal blood, imaging, and outcome assessments at 30 (±10 days), 90 (±30 days), and 180 (±30 days) days and at 1, 2, 3, 4, and 5 years (±2 months).
Quantification of NfL, GFAP, tau, and UCH-L1
We collected blood samples by venipuncture into gel separator tubes for serum and centrifuged the samples within 20 to 60 minutes. We divided the serum samples into aliquots and stored them at −80°C pending biochemical analysis. We analyzed NfL, GFAP, tau, and UCH-L1 concentrations in serum using the Neurology 4-plex assay kit (Quanterix Corp, Lexington, MA) on a single molecule array HD-1 Analyzer (Quanterix Corp). The average coefficients of variation of measurement of NfL, GFAP, tau, and UCH-L1 were 4%, 3%, 33%, and 30%, respectively.
Imaging acquisition and processing
We acquired MRIs on a 3T magnetic resonance scanner (Siemens Biograph, Munich, Germany) with a 16-channel head coil in Radiology and Imaging Sciences at the Clinical Center, NIH, Bethesda.
Brain volumetric analyses
The T1-weighted magnetization-prepared rapid gradient echo imaging included the following parameters: repetition time 2,530 milliseconds, echo time 3.03 milliseconds, flip angle 7°, voxel size 1 × 1 × 1 mm, matrix size 256 × 256, and slices 176. Briefly, images were corrected for intensity nonuniformity with the N4ITK algorithm19 and skull stripped with MONSTR.20 Anatomic brain segmentations (gray matter [GM], white matter [WM], and CSF) were done with FreeSurfer (version 6.3.0, surfer.nmr.mgh.harvard.edu) analysis of the T1-weighted magnetization-prepared rapid gradient echo images.
Diffusion tensor imaging
We acquired diffusion-weighted images on the same scanner as structural images with the following parameters: repetition time 17,000 milliseconds, echo time 98 milliseconds, flip angle 90°, voxel size 2 × 2 × 2 mm, matrix size 128 ×128, and slices 75. The acquisition included 10 images at b = 0 s/mm2, 10 images with noncollinear directional gradients at b = 300 s/mm2, and 60 images with noncollinear directional gradients at b = 1,100 s/mm2. Diffusion-weighted images were processed with the TORTOISE software21 for tensor estimation. Briefly, we preprocessed images for motion correction and eddy current correction, with adjustments to the gradient table performed on the basis of patient position. Distortions due to echo planar imaging susceptibility artifacts were corrected by first performing brain extraction on an anatomic T2-weighted SPACE acquisition (repetition time 3200 milliseconds, echo time 280 milliseconds, flip angle 120°, spatial resolution 0.98 × 0.98 × 1 mm, resampled to 0.49 × 0.49 × 1 mm). Next, a rigid registration performed aligned the T2-weighted image to the b = 0 image using the ANTS software package.22 Finally, we performed a deformable registration within TORTOISE from the b = 0 image to the T2-weighted image, and the resulting transformation was applied to each gradient direction. After distortion correction, we performed nonlinear least-squares tensor estimation followed by computation of fractional anisotropy (FA), axial diffusivity (AD), radial diffusivity (RD), and mean diffusivity (MD). Measurements were averaged across 39 regions of interest, defined automatically with the DOTS tract segmentation algorithm.23
Clinical, biochemical, and imaging outcomes
The primary outcome measures were changes in serum levels of NfL, GFAP, tau, and UCH-L1 from 30 days to 5 years after TBI in relation to TBI diagnosis, injury severity, functional outcome, brain volumes, and DTI. We assessed functional outcome with the Glasgow Outcome Scale–Extended (GOS-E).24 We tested associations between serum biomarkers and GM, WM, and corpus callosum (CC) volumes. The rationale for selecting these brain regions is that NfL is found predominantly in WM axons and that GM, WM, and CC volumes are surrogate markers of brain atrophy.25 CC is also a central WM structure and has been shown to be highly vulnerable to TAI.26 TAI is frequently quantified with DTI measures of FA (reduced in the chronic phase), RD (increased), and MD (increased).26
Statistical analysis
Blood biomarker concentrations in serum were nonnormally distributed because of biologically plausible higher values. Natural log-transformation produced plausibly normal distributions and was used for all regression analyses. We used analysis of variance to compare groups at baseline, followed by corrections for pairwise multiple comparisons with the Dunn test. To assess the change in biomarkers over time, we conducted linear mixed-effect models with random participant effect, and time (continuous) was used as a fixed effect. We determined the diagnostic utility of serum biomarkers by calculating the area under the receiver operating characteristic curve (AUROC). We tested the associations between blood biomarkers and GOS-E scores and GM, WM, and CC volumes using generalized linear models with age, education, sex, and total intracranial volume as covariates. For simplicity, we also report the relationships between serum biomarkers and cross-sectional measures using the Spearman rank correlation. Finally, we tested whether biomarker concentrations could predict future brain volume loss using the following formula:
Specifically, we examined whether biomarker concentrations could predict changes in brain volume (denoted Δ in the formula) over the subsequent assessment period (e.g., biomarker concentrations at 30-day study visit to predict brain volume change from 30 to 90 days; biomarker concentrations at 1 year to predict brain volume change from 1 to 2 years, etc). Similarly, we tested the association between serum biomarkers and longitudinal changes and DTI WM tracts. From these regression models, we extracted effect size (ß estimate) and p values, and only p values that survived multiple comparison with the Bonferroni method were considered significant.
We checked model assumptions by inspecting residuals (normality, histograms, Q-Q plots, and homogeneity of variance). In addition, we explored the potential effects of body mass index, diabetes mellitus, hypertension, hyperlipidemia, hematologic disorders (data available from Dryad, figure e-1A–e1E, doi:10.5061/dryad.44j0zpc98), and family history of dementia, diabetes mellitus, and hyperlipidemia on blood biomarker concentrations and found no significant associations (data available from Dryad, figure e-2A–e2C). All tests were 2 sided, and statistical significance was determined at p < 0.05. All statistical calculations were performed using R (version 3.0.3, R Foundation for Statistical Computing, Vienna, Austria).
Standard protocol approvals, registration, and patient consents
The NIH institutional review board approved the study. All participants gave written and informed consent.
Data availability
The data supporting the findings are available on request from the corresponding author.
Results
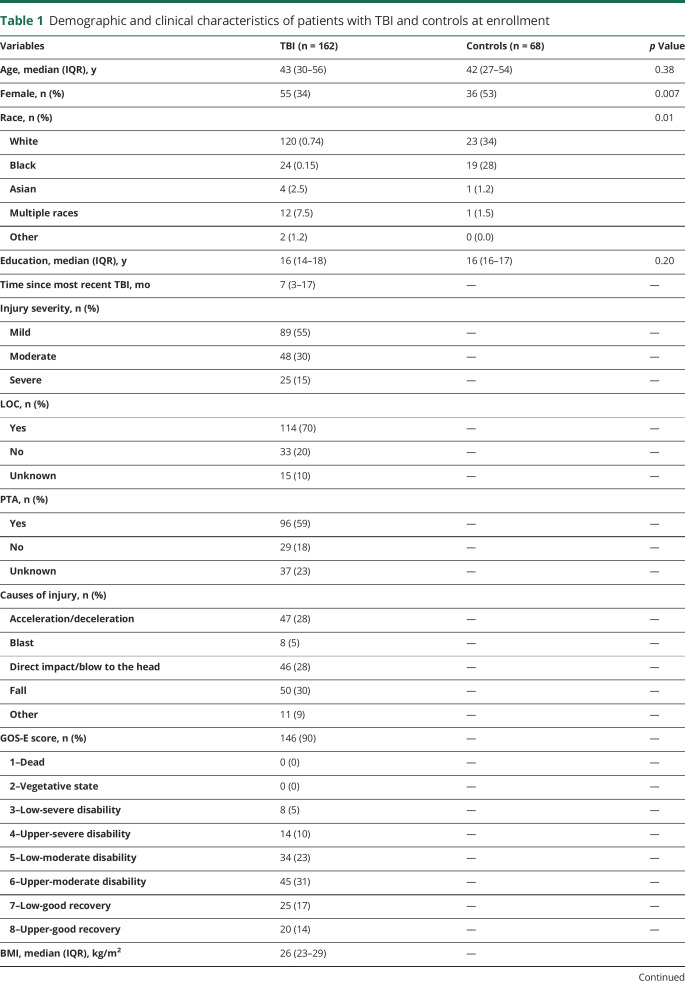
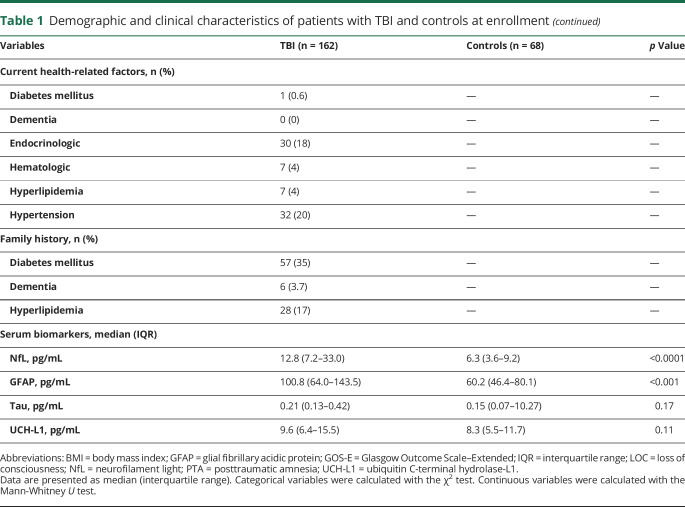
A total of 230 participants (162 with TBI [median 7 months after recent TBI] and 68 healthy controls) were enrolled at the Clinical Center, NIH. Patient with TBI also underwent serum, brain MRI, and outcome assessments at 30 (n = 30), 90 (n = 48), and 180 (n = 59) days and 1 (n = 82), 2 (n = 57), 3 (n = 46), 4 (n = 38), and 5 (n = 29) years after injury. Of 162 patients with TBI, 89 were classified as having mTBI and had no abnormalities on conventional MRI, 48 were classified as having moderate TBI, and 25 were classified as having severe TBI. Table 1 shows the demographic and clinical characteristics of the participants at enrollment. There were no significant differences in the concentrations of the biomarkers between patients with TBI with loss of consciousness vs those with no loss of consciousness (data available from Dryad, figure e-3, doi:10.5061/dryad.44j0zpc98). Serum NfL levels were increased in patients with TBI with posttraumatic amnesia vs those with no posttraumatic amnesia, while no differences were seen for the other biomarkers (data available from Dryad, figure e-4).
Table 1.
Demographic and clinical characteristics of patients with TBI and controls at enrollment
Biomarker concentrations at enrollment
Concentrations of NfL in the cross-sectional serum samples were 2.0 times higher in patients with TBI (all severities) than controls (median 12.8 [interquartile range 7.2–33] pg/mL vs median 6.3 [interquartile range 3.6–9.2] pg/mL, p < 0.0001). Concentrations of GFAP in serum were 1.67 times higher in patients with TBI than controls (median 100.8 [64.0–143.5] pg/mL vs median 60.2 [46.4–80.1] pg/mL, p < 0.001). There were no significant differences in concentrations of tau and UCH-L1 between the TBI groups and controls (table 1).
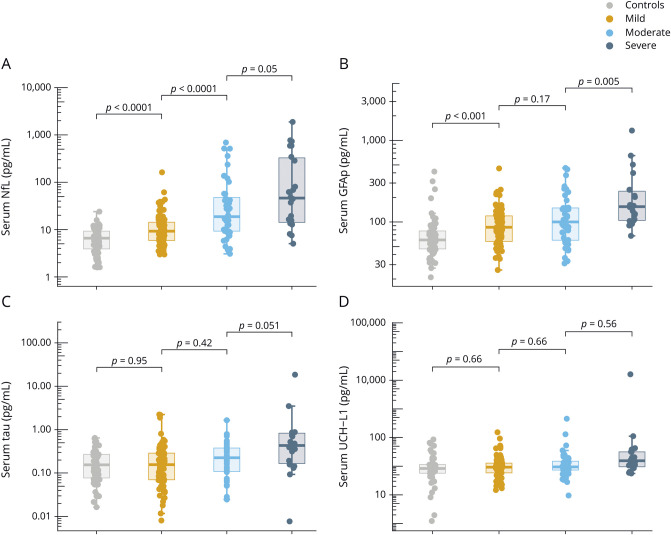
Serum NfL was elevated in patients with mTBI vs controls, moderate TBI vs mTBI, and severe TBI vs moderate TBI (p = 0.0001, p = 0.0001, and p = 0.05, respectively, figure 1A). Serum GFAP was elevated in those with mTBI vs controls and those with severe TBI vs moderate but not in patients with moderate TBI vs mTBI (p < 0.0001, p = 0.005, and p = 0.17, respectively, figure 1B). Serum concentrations of tau and UCH-L1 were significantly higher in patients with severe vs moderate TBI but did not significantly distinguish between patients with mTBI, those with moderate TBI, and controls (figure 1, C and D).
Figure 1. Biomarker concentrations across TBI severities at enrollment.
(A–D) Serum concentrations of neurofilament light (NfL), glial fibrillary acidic protein (GFAP), tau, and ubiquitin C-terminal hydrolase-L1 (UCH-L1) across traumatic brain injury (TBI) severities at a median of 7 months after TBI. Boxplots show the median and interquartile range. The p values are adjusted for multiple comparisons with the Holm-Bonferroni method.
Time course of blood-based biomarkers
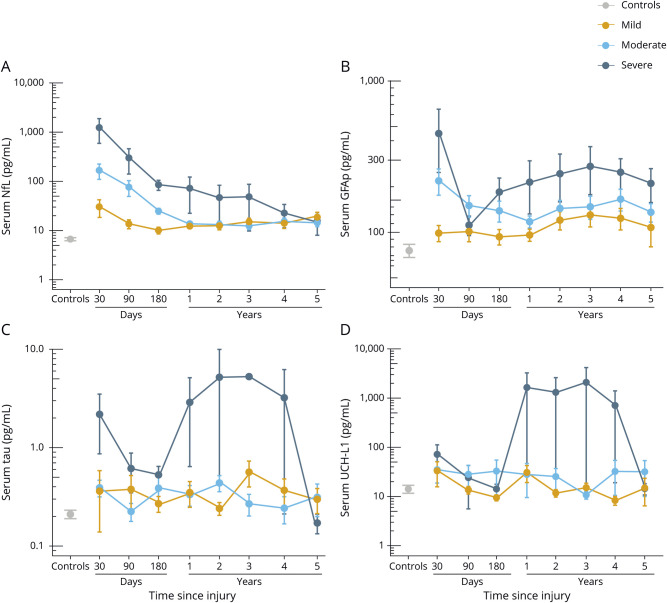
Serum NfL was increased at the 30-day time point, with levels decreasing in a linear fashion over the 5-year assessment period (ß = −0.09 log pg/mL, p < 0.0001, figure 2A). Next, we assessed whether longitudinal changes in serum NfL differed between patients with different TBI severity and compared to controls (data available from Dryad, table e-1, doi:10.5061/dryad.44j0zpc98). In summary, serum NfL remained elevated in mild to moderate cases compared to controls for up to 5 years after injury (data available from Dryad, table e-1).
Figure 2. Time course of the blood biomarkers.
(A–D) Time course of serum neurofilament light (NfL), glial fibrillary acidic protein (GFAP), tau, and ubiquitin C-terminal hydrolase-L1 (UCH-L1) across traumatic brain injury (TBI) severities. Error bars indicate SEM. The y-axes are log-transformed (log 10) for better visual clarity. The x-axes show the sampling time points after TBI.
Longitudinally, the decline in serum GFAP over the course of 5 years was not significant (ß = 0.003 log pg/mL, p = 0.60, figure 2B). We noticed a biphasic release of GFAP in serum, with levels decreasing during the first 6 months of injury but increasing over the subsequent time points (figure 2B). Consistently, pair-wise comparison revealed no significant differences in the concentrations of serum GFAP between patients with mTBI and controls at the 30-, 90-, and 180-day time points after correction for multiple comparisons; however, the levels were increased at the 1, 2, and 3-year time points (data available from Dryad, table e-1, doi:10.5061/dryad.44j0zpc98). For patients with moderate or severe TBIs, GFAP concentrations were increased compared to controls for up to 5 years (data available from Dryad, table e-1).
Serum tau concentrations were variable over the course of 5 years, and the decline in serum tau during this time was not significant (ß = −0.02 log pg/mL, p = 0.23, figure 2C). Serum tau concentrations were elevated only in severe cases compared with controls at the 90-day, 1-year, and 2-year time points (data available from Dryad, table e-1, doi:10.5061/dryad.44j0zpc98).
The time course for serum UCH-L1 over the 5-year period was variable, and there was no effect of time on UCH-L1 concentrations (ß = −0.025 log pg/mL, p = 0.08, figure 2D). In addition, there were no significant differences in serum UCH-L1 concentrations either across TBI severity or compared with controls at any measured time point except for the 30-day time point, when UCH-L1 was significantly elevated in patients with moderate TBI vs controls (data available from Dryad, table e-1, doi:10.5061/dryad.44j0zpc98).
Diagnostic utility of the biomarkers
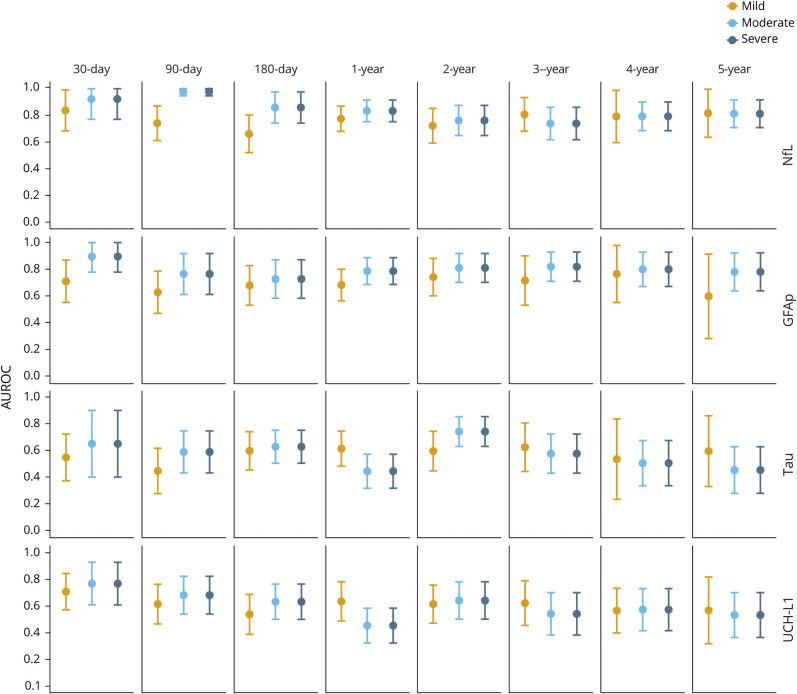
Serum NfL distinguished patients with mTBI from controls at the 30-day time point with an AUROC of 0.84 (figure 3). The highest AUROCs for NfL were measured for moderate to severe TBIs at the 30-, 90-, and 180-day time points (AUROCs 0.84–0.98, figure 3). The AUROC for NfL at the following time points decreased (figure 3). The AUROCs for GFAP over the course of 5 years ranged from 0.60 to 0.89 (figure 3). The highest AUROC for GFAP was measured at 30 days for patients with moderate and severe TBIs vs controls (both 0.89, figure 3). The AUROCs for tau and UCH-L1 distinguishing patients with TBI from controls over the course of 5 years were variable, ranging from 0.45 to 0.74 and 0.45 to 0.77, respectively (figure 3).
Figure 3. Diagnostic utility of blood biomarkers over time.
Plots show the diagnostic utility (area under the receiver operating characteristics curve [AUROC]) of serum neurofilament light (NfL), glial fibrillary acidic protein (GFAP), tau, and ubiquitin C-terminal hydrolase-L1 (UCH-L1) in distinguishing patients with traumatic brain injury from controls. Error bars indicate 95% confidence interval.
Serum NfL shows associations to functional outcome
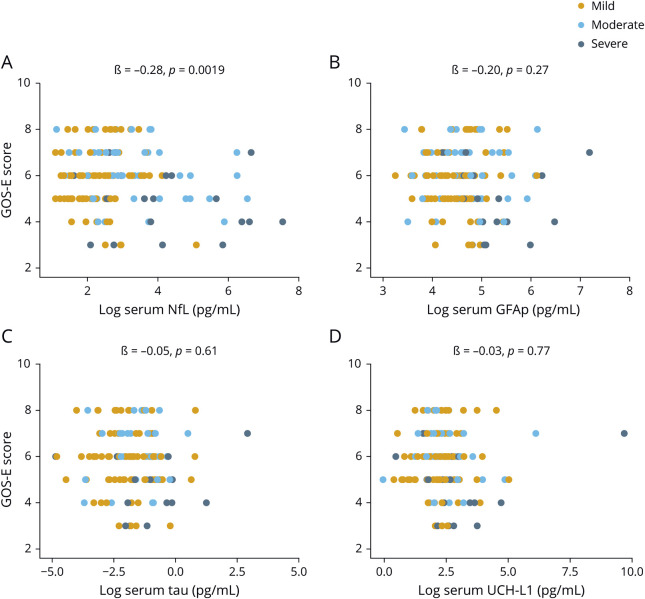
At enrollment, increased serum NfL concentrations correlated with worse GOS-E scores (ß = −0.28, p = 0.0019, figure 4A). The other biomarkers did not correlate with GOS-E scores (figure 4, B–D). Next, we assessed whether serum biomarkers could predict subsequent change in GOS-E scores. NfL and GFAP measured at 30 days were associated with an improvement in GOS-E at 90 days (data available from Dryad, table e-2, doi:10.5061/dryad.44j0zpc98). No significant changes were observed beyond the 30-day time point (data available from Dryad, table e-2). Changes in GOS-E scores were not associated with tau and UCH-L1 (data available from Dryad, table e-2).
Figure 4. Association between blood biomarkers and functional outcome at enrollment.
(A–D) Association between concentrations of neurofilament light (NfL), glial fibrillary acidic protein (GFAP), tau, and ubiquitin C-terminal hydrolase-L1(UCH-L1) at enrollment and Glasgow Outcome Scale–Extended (GOS-E) assessed cross-sectionally. The x-axes show the log-transformed values for visual clarity. The ß estimates and p values are from linear regression models, covaried for age, education, and sex.
Associations between blood biomarkers and brain MRI volumes
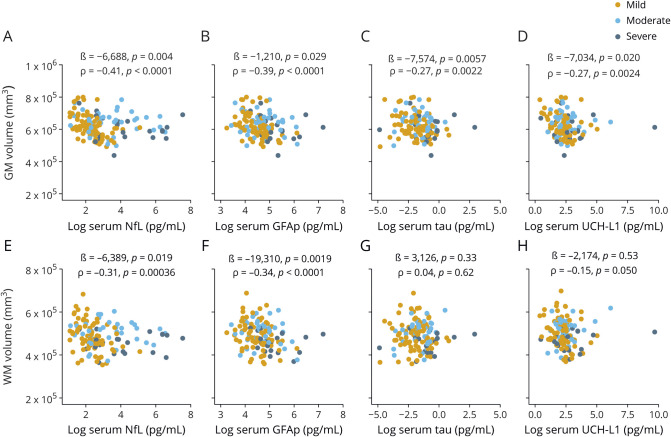
At enrollment, increased serum NfL, GFAP, tau, and UCH-L1 were associated with decreased total GM volume (figure 5, A–D). Increased NfL and GFAP were also associated with decreased WM volume (figure 5, E and F). There were no associations between tau, UCH-L1, and WM volume (figure 5, G and H). In addition, increased NfL was associated with decreased midanterior, central, and midposterior CC volumes (data available from Dryad, figure e-5, doi:10.5061/dryad.44j0zpc98). Similarly, increased GFAP was associated with decreased anterior, midanterior, central, and posterior CC volumes (data available from Dryad, figure e-5). Serum tau did not correlate with CC volumes (data available from Dryad, figure e-5). Increased UCH-L1 was associated with decreased anterior CC volume but not other segments of the CC (data available from Dryad, figure e-5).
Figure 5. Association between blood biomarkers and GM and WM volumes at enrollment.
(A–H) Association between serum concentrations of neurofilament light (NfL), glial fibrillary acidic protein (GFAP), tau, and ubiquitin C-terminal hydrolase-L1 (UCH-L1) and gray matter (GM) and white matter (WM) volumes (all patients with traumatic brain injury). The ß estimates and p values are from regression models, covaried for age, education, sex, and total intracranial volume. Associations were also assessed with the univariate Spearman rank correlation (ρ). Brain regions were normalized to total intracranial volume before analysis with ρ.
Longitudinally, serum NfL measured at 180 days predicted WM volume loss at 1 year (ß = −3,881, p = 0.001, data available from Dryad, table e-3, doi:10.5061/dryad.44j0zpc98). Serum NfL at 1 year predicted a loss in midanterior and central CC volumes at subsequent years (data available from Dryad, table e-3). In addition, NfL at the 3-year time point predicted a loss in central CC volume at the 4-year time point (data available from Dryad, table e-3). There were no significant relationships between GFAP, tau, or UCH-L1 and changes in brain volumes over time after correction for multiple comparisons (data available from Dryad, table e-3).
Associations between blood biomarkers and DTI measures of WM integrity
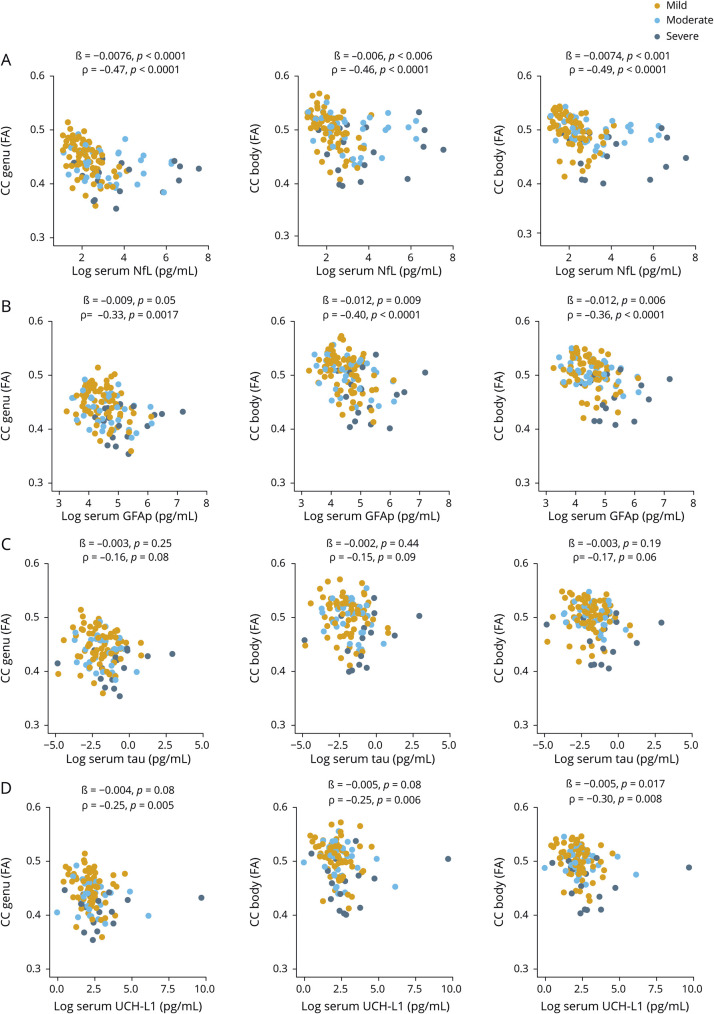
At enrollment, increased NfL was associated with decreased DTI FA for all segments of the CC, including the genu, body, and splenium (ß = −0.0075, p < 0.0001; ß = −0.0071, p = 0.004; and ß = −0.0075, p < 0.0001, respectively, figure 6A). In addition, increased GFAP was associated with reduced DTI FA for all segments of the CC (ß = −0.0075, p < 0.0001; ß = −0.0071, p = 0.004; and ß = −0.0075, p < 0.0001, respectively, figure 6B). Similarly, increased NfL and GFAP were associated with increases in DTI RD and MD for all segments of the CC (data available from Dryad, figures e-6 and e-7, doi:10.5061/dryad.44j0zpc98). Increased GFAP also was associated with DTI AD for all segments of the CC (data available from Dryad, figure e-8). There were no relationships between tau and UCH-L1 and DTI FA, AD, RD, and MD, except for UCH-L1 showing an association with DTI FA and the CC splenium (ß = −0.005, p = 0.017, figure 5 and data available from Dryad, figures e-6–e-8).
Figure 6. Serum biomarkers at enrollment in relation to DTI fractional anisotropy.
(A–D) Relationship between serum neurofilament light (NfL), glial fibrillary acidic protein (GFAP), tau, and ubiquitin C-terminal hydrolase-L1 (UCH-L1) measured at enrollment and diffusion tensor imaging (DTI) fractional anisotropy (FA) for corpus callosum (CC) integrity measured at enrollment. The ß estimates and p values are from regression models, covaried for age, education, and sex. We also assessed the relationship with univariate the Spearman rank correlation (ρ).
Longitudinally, serum NfL at the 180-day time point was associated with increases in DTI FA for the genu and splenium CC at the subsequent time points (ß = 0.004, p = 0.001; ß = 0.006, p < 0.0001, data available from Dryad, table e-4A, doi:10.5061/dryad.44j0zpc98). Serum NfL at the 3-year time point predicted a decrease in DTI FA for the genu CC at the 4-year time point (ß = −0.010, p < 0.0001, data available from Dryad, table e-4A). Similarly, increased NfL at the 3-year time point predicted increases in DTI RD for the genu CC from 3 to 4 years (ß = 16.4, p = 0.006, data available from Dryad, table e-4A). In addition, GFAP measured at 3 years predicted a change in DTI FA for the genu CC at 4 years (ß = −0.011, p = 0.0003, data available from Dryad, table e-4B). Serum tau measured at 4 years predicted a change in DTI FA for the splenium CC from 4 to 5 years (ß = −0.003, p = 0.007, data available from Dryad, table e-4C). Serum tau at 1 year predicted DTI MD changes for the body of the CC from 1 to 2 years (ß = 8.4, p = 0.009, data available from Dryad, table e-4C). There was no relationship between serum UCH-L1 and changes in DTI measures for CC integrity after correction for multiple comparisons (data available from Dryad, table e-4D).
Discussion
The main findings of this study are the following. (1) Concentrations of NfL and GFAP in serum were increased in patients with subacute and chronic TBI, while tau and UCHL-1 levels were increased in the severe cases only. (2) Serum NfL distinguished patients with TBI from controls at 30, 90, and 180 days with high accuracy; the diagnostic accuracy of GFAP, tau, and UCH-L1 was lower. (3) Serum NfL at enrollment showed a relationship to TBI severity and functional outcome, while the relationship was weaker for the other measured biomarkers. (4) Increased concentrations of NfL and GFAP in serum at enrollment correlated with MRI brain volumes and DTI measures of TAI. (5) Serum NfL was the only biomarker that was associated with the likely rate of brain atrophy and DTI measures of progression of TAI. Our findings suggest that NfL concentrations in serum offer rapid and accessible means of assessing and predicting neuronal damage in patients with TBI.
NfL is a component of the axonal cytoskeleton and is expressed primarily in large-caliber myelinated subcortical axons.27 In the context of TBI, serum NfL measured within 48 hours of injury has been shown to distinguish patients with CT findings from those with normal CT.13,28,29 In contrast to the existing studies, we found here that serum NfL can distinguish patients with mTBI, moderate TBI, and severe TBI from each other as well as from controls months to years after injury. The AUROC at 30 days for serum NfL for distinguishing those with mTBI (DoD/VA criteria were used) from controls was 0.84, while for moderate and severe cases, the AUROC was 0.94. AUROCs over the following time points decreased for all severities but remained statistically significant (e.g., the AUROC for distinguishing those with mTBI from controls at 5 years was 0.80). In addition, NfL measured in cross-sectional serum samples showed associations with GOS-E score. Compared to these findings, we previously observed increased concentrations of serum NfL up to 1 year after injury in patients with severe TBI, with initial levels associated with GOS-E score.12 Together, these findings suggest that a single TBI may cause long-term axonal degeneration that could be detectable in serum months to years after injury with NfL used as the biomarker.
GFAP is an intermediate filament protein that is expressed predominantly by astrocytes.30 In the context of TBI, serum GFAP measured acutely after injury distinguished patients with intracranial hemorrhage on CT from those with normal CT.13–15 Herein, serum GFAP measured a median of 7 months from the date of injury did not relate to injury severity but could distinguish patients with mTBI, moderate TBI, and severe TBI from controls. The highest AUROC for GFAP was measured at the 30-day time point for moderate to severe TBI cases (AUROC 0.89); however, beyond the 30-day time point, the AUROCs were low. In addition, there was no association between GFAP and outcome. Therefore, unlike previous studies in acute TBI,13–15 these results indicate that serum GFAP may not perform well as a biomarker in subacute or chronic TBI.
Tau is a microtubule-associated protein expressed predominantly in short cortical unmyelinated axons.31 In the context of TBI, increased concentrations of CSF tau have previously been found in acute samples from patients with moderate to severe TBI.10,32 In addition, plasma tau increased within hours after concussion in athletes compared with their preseason baseline.11,16 In the present study, serum tau concentrations were elevated in patients with severe TBI but did not relate to injury severity, functional outcome, or neuroimaging measures. These findings suggest that serum tau has limited utility when measured in the subacute and chronic phases of TBI.
UCH-L1 is found abundantly in neurons.33 Similar to serum GFAP, previous studies have reported that serum UCH-L1 measured within 48 hours after injury distinguishes patients with intracranial hemorrhage on CT from those with normal CT findings.13–15 In contrast to the previous studies, serum UCH-L1 measured here at a median of 7 months after injury was elevated in patients with severe TBI compared with controls but not in patients with mTBI or moderate TBI. Longitudinally, the levels of serum UCH-L1 were variable and did not relate to injury severity or outcome. Together, these findings indicate that serum UCH-L1 has limited diagnostic and prognostic utility in patients with subacute and chronic TBI. This is further supported by the higher analytic variability for lower concentrations of serum UCH-L1 seen here and previously.13
In the last part of this study, we attempted to cross-validate NfL, GFAP, tau, and UCH-L1 with brain MRI volumetric analysis and DTI. Increased serum NfL at enrollment was related to decreased GM, WM, and CC volumes. Decreased FA and increased RD and MD were observed in patients with elevated serum NfL at enrollment. In addition, serum NfL was associated with the likely rates of MRI markers of brain atrophy and progression of TAI. These findings are in direct comparison to a recent study of 9 patients that revealed a strong relationship between serum NfL measured 6 days after injury and TAI assessed with DTI 12 months later.34 Similar to NfL, serum GFAP showed a relationship with brain volumes and DTI measures but with limited prognostic utility. The associations of tau and UCH-L1 with brain volumes and DTI measures were weak, further indicating that tau and UCH-L1 measured in the subacute and chronic phases of TBI may not be as informative as when measured acutely. The convergent findings provided by the methodologies used here (i.e., serum biomarker levels, MRI volumetric analysis, and DTI) are principal proof of independent cross-validation of these methods. From the scientific perspective, the data provided by these 3 methods greatly increase the confidence of a relationship between serum biomarker levels and underlying neuropathology. From a clinical perspective, the complementary strengths of these methods and their relationship with clinical outcome provide multiple diagnostic and prognostic options to the clinician. For instance, MRI volumetric analysis provides no information on WM axonal microstructure yet is readily available and not technically challenging, while DTI provides more detailed and region-specific information on WM microstructure but has limited availability and high cost. On the other hand, serum NfL concentrations are related to TBI severity, clinical outcome, and imaging outcome and are readily measured with standard laboratory techniques.
Comparing the 4 serum neuronal injury biomarkers measured herein shows that the performance of NfL was robust in distinguishing patients with different TBI severities, showing stronger associations with functional outcome, brain volumes, and DTI measures of TAI relative to the other biomarkers. In addition, although serum NfL decreased in a linear fashion over time, it remained elevated in mild and moderate cases compared with controls for a prolonged period. In contrast to NfL, GFAP had a biphasic release in serum, with levels decreasing during the first 6 months of injury but increasing over the subsequent time points. These findings indicate that axonal injury and astrogliosis may persist for years after TBI and are more evident in moderate to severe cases, which is consistent with existing animal models and human histopathologic studies.35,36 Mechanistically, the kinetics observed for NfL and GFAP in serum after TBI provide insight into the persistence of neuroaxonal degeneration and astrogliosis/activation, respectively. Although serum GFAP was increased in patients with subacute and chronic TBI, it did not relate to injury severity or outcome. Finally, tau and UCH-L1 levels were variable and showed weak relationships with TBI severity and imaging outcomes. This suggests that tau and UCH-L1 may not be sensitive biomarkers for subacute and chronic TBI.
Our study is not without limitations. First, we did not have longitudinal blood samples and MRI assessments at all measured time points, which is an issue inherent in many long-term longitudinal studies. Second, serum may not be the optimal source for measurement of tau because tau concentrations in serum are lower than in plasma, possibly explaining the higher analytical variation for this biomarker. Third, we also observed higher analytical variations for UCH-L1, especially for the lower concentrations, limiting the utility of serum UCH-L1 as a biomarker for subacute or chronic TBI. Lastly, there was overlap in biomarker concentrations between the groups, especially between the mTBI group and controls, which could be due to several reasons, including intraindividual variability, limited sensitivity of the assay, and limitations of the current TBI classification.37
These findings suggest that a single mTBI to moderate TBI may cause long-term neuroaxonal degeneration and astrogliosis/activation. The collective evidence from this study suggests that serum NfL is a highly sensitive biomarker for neuroaxonal degeneration after subacute and chronic TBI and performs better than the other measured biomarkers. The strong relationships seen between serum NfL and DTI measures of TAI suggest that serum NfL could be used to assess TAI or as a prognostic blood biomarker of disease progression or neuroaxonal damage after TBI. Serum NfL may have a potential role in facilitating the development of novel disease-modifying therapeutics and possibly guiding treatment decisions once such treatments become available. To translate these findings into clinical practice, future research should standardize methods of quantification across analytical platforms and determine cutoffs across age and different injury subtypes.
Acknowledgment
The authors thank the study participants, their families, and the care providers who made this study possible. The views expressed in this manuscript are those of the authors and do not reflect the policy of the US Department of the Army, Navy, Air Force, DoD, or US government. The identification of specific products or scientific instrumentation is considered an integral part of the scientific endeavor and does not constitute endorsement or implied endorsement on the part of the author, DoD, or any component agency.
Glossary
- AD
axial diffusivity
- AUROC
area under the receiver operating characteristic curve
- CC
corpus callosum
- DoD
Department of Defense
- DTI
diffusion tensor imaging
- FA
fractional anisotropy
- GFAP
glial fibrillary acidic protein
- GM
gray matter
- GOS-E
Glasgow Outcome Scale–Extended
- MD
mean diffusivity
- mTBI
mild TBI
- NfL
neurofilament light
- RD
radial diffusivity
- TAI
traumatic axonal injury
- TBI
traumatic brain injury
- UCH-L1
ubiquitin C-terminal hydrolase-L1
- VA
Veterans Affairs
- WM
white matter
Appendix. Authors

Footnotes
Study funding
Funding provided by the Intramural Research Program at the NIH and the DoD (Center for Neuroscience and Regenerative Medicine).
Disclosure
P. Shahim, A. Politis, A. van der Merwe, B. Moore, V. Ekanayake, S. Lippa, Y. Chou, D. Pham, and J. Butman report no disclosures relevant to the manuscript. R. Diaz-Arrastia serves on the Scientific Advisory Board for BrainBox, Inc and Neural Analytics. H. Zetterberg has served on scientific advisory boards for CogRx, Samumed, Roche Diagnostics, and Wave; has given a scientific presentation in a Biogen-sponsored symposium; and is a cofounder of Brain Biomarker Solutions in Gothenburg AB, a GU Ventures–based platform company at the University of Gothenburg. K. Blennow has served as a consultant to or on advisory boards for Alector, Alzheon, CogRx, Biogen, Lilly, Novartis, and Roche Diagnostics and is a cofounder of Brain Biomarker Solutions in Gothenburg AB, a GU Venture–based platform company at the University of Gothenburg. J. Gill reports no disclosures relevant to the manuscript. D. Brody has served as a paid consultant for Pfizer Inc, Intellectual Ventures, Signum Nutralogix, Kypha Inc, Sage Therapeutics, iPerian Inc, Navigant, Avid Radiopharmaceuticals (Eli Lilly & Co), the St. Louis County Public Defender, the US Attorney's Office, the St. Louis County Medical Examiner, GLG, Stemedica, and Luna Innovations. Dr. Brody holds equity in Inner Cosmos. Dr. Brody receives royalties from sales of Concussion Care Manual (Oxford University Press). L. Chan reports no disclosures relevant to the manuscript. Go to Neurology.org/N for full disclosures.
References
- 1.Taylor CA, Bell JM, Breiding MJ, Xu L. Traumatic brain injury-related emergency department visits, hospitalizations, and deaths–United States, 2007 and 2013. MMWR Surveill Summ 2017;66:1–16. [DOI] [PMC free article] [PubMed] [Google Scholar]
- 2.Marion CM, Radomski KL, Cramer NP, Galdzicki Z, Armstrong RC. Experimental traumatic brain injury identifies distinct early and late phase axonal conduction deficits of white matter pathophysiology, and reveals intervening recovery. J Neurosci 2018;38:8723–8736. [DOI] [PMC free article] [PubMed] [Google Scholar]
- 3.Johnson VE, Stewart W, Smith DH. Axonal pathology in traumatic brain injury. Exp Neurol 2013;246:35–43. [DOI] [PMC free article] [PubMed] [Google Scholar]
- 4.Cole JH, Jolly A, de Simoni S, et al. Spatial patterns of progressive brain volume loss after moderate-severe traumatic brain injury. Brain 2018;141:822–836. [DOI] [PMC free article] [PubMed] [Google Scholar]
- 5.Smith DH, Chen XH, Pierce JE, et al. Progressive atrophy and neuron death for one year following brain trauma in the rat. J Neurotrauma 1997;14:715–727. [DOI] [PubMed] [Google Scholar]
- 6.Goddeyne C, Nichols J, Wu C, Anderson T. Repetitive mild traumatic brain injury induces ventriculomegaly and cortical thinning in juvenile rats. J Neurophysiol 2015;113:3268–3280. [DOI] [PMC free article] [PubMed] [Google Scholar]
- 7.Hulkower MB, Poliak DB, Rosenbaum SB, Zimmerman ME, Lipton ML. A decade of DTI in traumatic brain injury: 10 years and 100 articles later. AJNR Am J Neuroradiol 2013;34:2064–2074. [DOI] [PMC free article] [PubMed] [Google Scholar]
- 8.Zetterberg H, Hietala MA, Jonsson M, et al. Neurochemical aftermath of amateur boxing. Arch Neurol 2006;63:1277–1280. [DOI] [PubMed] [Google Scholar]
- 9.Shahim P, Tegner Y, Gustafsson B, et al. Neurochemical aftermath of repetitive mild traumatic brain injury. JAMA Neurol 2016;73:1308–1315. [DOI] [PubMed] [Google Scholar]
- 10.Ost M, Nylen K, Csajbok L, et al. Initial CSF total tau correlates with 1-year outcome in patients with traumatic brain injury. Neurology 2006;67:1600–1604. [DOI] [PubMed] [Google Scholar]
- 11.Shahim P, Tegner Y, Wilson DH, et al. Blood biomarkers for brain injury in concussed professional ice hockey players. JAMA Neurol 2014;71:684–692. [DOI] [PubMed] [Google Scholar]
- 12.Shahim P, Gren M, Liman V, et al. Serum neurofilament light protein predicts clinical outcome in traumatic brain injury. Sci Rep 2016;6:36791. [DOI] [PMC free article] [PubMed] [Google Scholar]
- 13.Gill J, Latour L, Diaz-Arrastia R, et al. Glial fibrillary acidic protein elevations relate to neuroimaging abnormalities after mild TBI. Neurology 2018;91:e1385–e1389. [DOI] [PMC free article] [PubMed] [Google Scholar]
- 14.Papa L, Brophy GM, Welch RD, et al. Time course and diagnostic accuracy of glial and neuronal blood biomarkers GFAP and UCH-L1 in a large cohort of trauma patients with and without mild traumatic brain injury. JAMA Neurol 2016;73:551–560. [DOI] [PMC free article] [PubMed] [Google Scholar]
- 15.Bazarian JJ, Biberthaler P, Welch RD, et al. Serum GFAP and UCH-L1 for prediction of absence of intracranial injuries on head CT (ALERT-TBI): a multicentre observational study. Lancet Neurol 2018;17:782–789. [DOI] [PubMed] [Google Scholar]
- 16.Shahim P, Tegner Y, Marklund N, Blennow K, Zetterberg H. Neurofilament light and tau as blood biomarkers for sports-related concussion. Neurology 2018;90:e1780–e1788. [DOI] [PMC free article] [PubMed] [Google Scholar]
- 17.Management of Concussion/mTBI Working Group. VA/DoD clinical practice guideline for management of concussion/mild traumatic brain injury. J Rehabil Res Dev 2009;46:CP1–68. [PubMed] [Google Scholar]
- 18.Department of Veterans Affairs, Department of Defense. VA/DOD clinical practice guideline for the management of concussion-mild traumatic brain injury. Available at: rehab.research.va.gov/jour/09/46/6/pdf/cpg.pdf. [Google Scholar]
- 19.Tustison NJ, Avants BB, Cook PA, et al. N4ITK: improved N3 bias correction. IEEE Trans Med Imaging 2010;29:1310–1320. [DOI] [PMC free article] [PubMed] [Google Scholar]
- 20.Roy S, Butman JA, Pham DL; Alzheimer’s Disease Neuroimaging Initiative. Robust skull stripping using multiple MR image contrasts insensitive to pathology. Neuroimage 2017;146:132–147. [DOI] [PMC free article] [PubMed] [Google Scholar]
- 21.Pierpaoli C, Walker L, Irfanoglu MO, et al. TORTOISE: An Integrated Software Package for Processing of Diffusion MRI Data. Presented at ISMRM 18th annual meeting; May 1–7, 2010; Stockholm, Sweden,.
- 22.Avants BB, Tustison NJ, Song G, Cook PA, Klein A, Gee JC. A reproducible evaluation of ANTs similarity metric performance in brain image registration. Neuroimage 2011;54:2033–2044. [DOI] [PMC free article] [PubMed] [Google Scholar]
- 23.Bazin PL, Ye C, Bogovic JA, et al. Direct segmentation of the major white matter tracts in diffusion tensor images. Neuroimage 2011;58:458–468. [DOI] [PMC free article] [PubMed] [Google Scholar]
- 24.Wilson JT, Pettigrew LE, Teasdale GM. Structured interviews for the Glasgow Outcome Scale and the extended Glasgow Outcome Scale: guidelines for their use. J Neurotrauma 1998;15:573–585. [DOI] [PubMed] [Google Scholar]
- 25.Yuan A, Rao MV, Veeranna, Nixon RA. Neurofilaments and neurofilament proteins in health and disease. Cold Spring Harb Perspect Biol 2017;9:a018309. [DOI] [PMC free article] [PubMed] [Google Scholar]
- 26.Hunter LE, Lubin N, Glassman NR, Xue X, Spira M, Lipton ML. Comparing region of interest versus voxel-wise diffusion tensor imaging analytic methods in mild and moderate traumatic brain injury: a systematic review and meta-analysis. J Neurotrauma 2019;36:1222–1230. [DOI] [PMC free article] [PubMed] [Google Scholar]
- 27.Friede RL, Samorajski T. Axon caliber related to neurofilaments and microtubules in sciatic nerve fibers of rats and mice. Anat Rec 1970;167:379–387. [DOI] [PubMed] [Google Scholar]
- 28.Iverson GL, Reddi PJ, Posti JP, et al. Serum neurofilament light is elevated differentially in older adults with uncomplicated mild traumatic brain injuries. J Neurotrauma 2019:36:2400–2406. [DOI] [PubMed] [Google Scholar]
- 29.Hossain I, Mohammadian M, Takala RSK, et al. Early levels of glial fibrillary acidic protein and neurofilament light protein in predicting the outcome of mild traumatic brain injury. J Neurotrauma 2019:36:1551–1560. [DOI] [PubMed] [Google Scholar]
- 30.Bignami A, Eng LF, Dahl D, Uyeda CT. Localization of the glial fibrillary acidic protein in astrocytes by immunofluorescence. Brain Res 1972;43:429–435. [DOI] [PubMed] [Google Scholar]
- 31.Trojanowski JQ, Schuck T, Schmidt ML, Lee VM. Distribution of tau proteins in the normal human central and peripheral nervous system. J Histochem Cytochem 1989;37:209–215. [DOI] [PubMed] [Google Scholar]
- 32.Neselius S, Brisby H, Theodorsson A, Blennow K, Zetterberg H, Marcusson J. CSF-biomarkers in Olympic boxing: diagnosis and effects of repetitive head trauma. PLoS One 2012;7:e33606. [DOI] [PMC free article] [PubMed] [Google Scholar]
- 33.Wilkinson KD, Deshpande S, Larsen CN. Comparisons of neuronal (PGP 9.5) and non-neuronal ubiquitin C-terminal hydrolases. Biochem Soc Trans 1992;20:631–637. [DOI] [PubMed] [Google Scholar]
- 34.Ljungqvist J, Zetterberg H, Mitsis M, Blennow K, Skoglund T. Serum neurofilament light protein as a marker for diffuse axonal injury: results from a case series study. J Neurotrauma 2017;34:1124–1127. [DOI] [PubMed] [Google Scholar]
- 35.Mouzon B, Bachmeier C, Ojo J, et al. Chronic white matter degeneration, but no tau pathology at one-year post-repetitive mild traumatic brain injury in a tau transgenic model. J Neurotrauma 2019:36:576–588. [DOI] [PMC free article] [PubMed] [Google Scholar]
- 36.Hsu ET, Gangolli M, Su S, et al. Astrocytic degeneration in chronic traumatic encephalopathy. Acta Neuropathol 2018;136:955–972. [DOI] [PubMed] [Google Scholar]
- 37.Gravesteijn B, Sewalt C, Ercole A, et al. Towards a new multidimensional classification of traumatic brain injury: a CENTER-TBI study. J Neurotrauma 2020:37:1002–1010. [DOI] [PubMed] [Google Scholar]
Associated Data
This section collects any data citations, data availability statements, or supplementary materials included in this article.
Data Availability Statement
The data supporting the findings are available on request from the corresponding author.


