Abstract
Objective
To determine whether serum neurofilament light (NfL) correlates with CSF NfL, traumatic brain injury (TBI) diagnosis, injury severity, brain volume, and diffusion tensor imaging (DTI) estimates of traumatic axonal injury (TAI).
Methods
Participants were prospectively enrolled in Sweden and the United States between 2011 and 2019. The Swedish cohort included 45 hockey players with acute concussion sampled at 6 days, 31 with repetitive concussion with persistent postconcussive symptoms (PCS) assessed with paired CSF and serum (median 1.3 years after concussion), 28 preseason controls, and 14 nonathletic controls. Our second cohort included 230 clinic-based participants (162 with TBI and 68 controls). Patients with TBI also underwent serum, functional outcome, and imaging assessments at 30 (n = 30), 90 (n = 48), and 180 (n = 59) days and 1 (n = 84), 2 (n = 57), 3 (n = 46), 4 (n = 38), and 5 (n = 29) years after injury.
Results
In athletes with paired specimens, CSF NfL and serum NfL were correlated (r = 0.71, p < 0.0001). CSF and serum NfL distinguished players with PCS >1 year from PCS ≤1 year (area under the receiver operating characteristic curve [AUROC] 0.81 and 0.80). The AUROC for PCS >1 year vs preseason controls was 0.97. In the clinic-based cohort, NfL at enrollment distinguished patients with mild from those with moderate and severe TBI (p < 0.001 and p = 0.048). Serum NfL decreased over the course of 5 years (ß = −0.09 log pg/mL, p < 0.0001) but remained significantly elevated compared to controls. Serum NfL correlated with measures of functional outcome, MRI brain atrophy, and DTI estimates of TAI.
Conclusions
Serum NfL shows promise as a biomarker for acute and repetitive sports-related concussion and patients with subacute and chronic TBI.
Classification of evidence
This study provides Class III evidence that increased concentrations of NfL distinguish patients with TBI from controls.
Traumatic brain injuries (TBIs) are among the most common maladies affecting humanity.1 In the United States, there are ≈2.8 million emergency department visits each year for TBI, of which ≈282,000 patients require hospitalization and ≈56,000 die.2 Several million cases of TBI resulting from sports-related concussions are uncounted because they do not lead to emergency department visits or medical encounters.2
TBI is generally classified as mild (mTBI), moderate, or severe on the basis of clinical features such as loss of consciousness, posttraumatic amnesia, and trauma-related abnormalities on cranial CT or MRI. While this classification scheme has some utility for the acute management of TBI, it has not been useful in clinical management or research during the subacute and chronic periods. Diffusion tensor imaging (DTI) has emerged as a potential technique to assess traumatic axonal injury (TAI), which is central to the pathophysiology of TBI.3,4 However, DTI has limitations, including limited availability, high cost, and requirement for cumbersome image postprocessing. Therefore, institutions such as the NIH and the European Commission have recognized surrogate markers of injury and recovery as a top research priority for TBI.5 Considering that TAI is central to the pathophysiology of TBI, biomarkers related to neuroaxonal injury are a critical area of research.
Neurofilament light (NfL) in CSF is a sensitive biomarker of neuroaxonal damage6 and has been validated in several neurodegenerative disorders.7–13 However, accessing CSF requires an invasive lumbar puncture. The ability to quantify NfL in peripheral blood has made it feasible to assess neurodegeneration after TBI rapidly and longitudinally.14 These recent studies notwithstanding,15–17 critical gaps remain in our knowledge, including the relationship between CSF and serum NfL, its time course after injury, and the relationship between NfL and neuroimaging outcomes. In addition, the relationship between serum NfL and the blood-brain barrier (BBB) is not well known, which is important in understanding the release of NfL into the bloodstream. In clinical settings, the CSF:serum albumin ratio is used as a surrogate marker of BBB function.18
In this study, we examine serum and CSF NfL from ice hockey players with sports-related repetitive concussion (RC), preseason controls, and healthy nonathletic controls. We also conducted a longitudinal assessment of serum NfL in a clinic-based cohort of patients with subacute and chronic TBI and assessed the relationship of NfL to brain MRI volumes and DTI. We hypothesized that serum NfL would correlate with CSF levels and be elevated in players with a history of RC, that patients with subacute and chronic TBI would have increased concentrations of serum NfL, and that serum NfL would correlate with white matter (WM) volumes and DTI estimates of WM integrity.
Methods
Study design and participants
Participants were enrolled prospectively across the 2 studies: professional hockey players with sports-related concussion and a clinic-based cohort with subacute and chronic TBI. The first cohort included professional Swedish hockey players with acute concussion (AC), nonconcussed hockey players who contributed samples during the preseason, and chronic concussed hockey players, as well as healthy controls enrolled at different sites in Sweden. Our second cohort was a clinic-based cohort who were enrolled at the Clinical Center, NIH, Bethesda, MD. The clinic-based cohort participants were also offered longitudinal blood, imaging, and outcome assessments at 30 (±10 days), 90 (±30 days), and 180 (±30 days) days and at 1, 2, 3, 4, and 5 years (±2 months). The inclusion and exclusion criteria for each study and detailed participant data for each study are given in the supplementary data available from Dryad (doi.org/10.5061/dryad.8pk0p2nj6).
Quantification of CSF and serum NfL
CSF NfL was measured with a commercial ELISA,19 while CSF and serum albumin concentrations were measured by immunonephelometry on a Beckman IMMAGE Immunochemistry system (Beckman Instruments, Beckman Coulter, Brea, CA). CSF:serum albumin ratio was calculated as CSF albumin (milligrams per liter)/serum albumin (grams per liter).
Serum NfL was measured on the Single Molecule Array (Simoa, Quanterix Corp, Lexington, MA) with an assay described previously.14 The average coefficient of variation of measurement of NfL in all samples was <4.0%. Samples at different sites and cohorts were analyzed at the same time with the same batch of reagents by certified laboratory technicians blinded to clinical information. A detailed description of the biochemical procedures is provided in supplementary data available from Dryad (doi.org/10.5061/dryad.8pk0p2nj6).
Imaging acquisition and processing
For the clinic-based cohort, MRI was acquired on a 3T magnetic resonance scanner (Siemens Biograph) in Radiology and Imaging Sciences, NIH Clinical Center.
Brain volumetric analyses
The T1-weighted magnetization-prepared rapid gradient echo imaging included the following parameters: repetition time 2,530 milliseconds, echo time 3.03 milliseconds, flip angle 7°, voxel size 1 × 1 × 1 mm, matrix size 256 × 256, and slices = 176. Briefly, images were corrected for intensity nonuniformity with the N4ITK algorithm20 and skull stripped with MONSTR.21 Anatomic brain segmentations (gray matter [GM], WM, and CSF) were done with FreeSurfer (version 6.3.0 surfer.nmr.mgh.harvard.edu) analysis of the T1-weighted magnetization-prepared rapid gradient echo images.
Diffusion tensor imaging
Diffusion-weighted images were acquired on the same scanner as structural images with the following parameters: repetition time 17,000 milliseconds, echo time 98 milliseconds, flip angle 90°, voxel size 2 × 2 × 2 mm, matrix size 128 ×128, and slices 75. The acquisition included 10 images at b = 0 s/mm2, 10 images with noncollinear directional gradients at b = 300 s/mm2, and 60 images with noncollinear directional gradients at b = 1,100 s/mm2. Diffusion-weighted images were processed with the TORTOISE software22 for tensor estimation. Briefly, images were preprocessed for motion correction and eddy current correction, with adjustments to the gradient table performed on the basis of patient position. Distortions due to echo planar imaging susceptibility artifacts were corrected by first performing brain extraction on an anatomic T2-weighted SPACE acquisition (repetition time 3,200 milliseconds, echo time 280 milliseconds, flip angle 120°, spatial resolution 0.98 × 0.98 × 1 mm, resampled to 0.49 × 0.49 × 1 mm). Next, a rigid registration was performed and aligned the T2-weighted image to the b = 0 image using the ANTS software package.23 Finally, a deformable registration was performed within TORTOISE from the b = 0 image to the T2-weighted image, and the resulting transformation was applied to each gradient direction. After distortion correction, nonlinear least-squares tensor estimation was performed, followed by computation of fractional anisotropy (FA), axial diffusivity (AD), radial diffusivity (RD), and mean diffusivity (MD). Measurements were averaged across 39 regions of interest, defined automatically with the DOTS tract segmentation algorithm.24
Clinical and neuroimaging outcome assessments
In the athlete cohort, severity of concussion was graded according to the days to return to play (RTP), according to the sports-related concussion guidelines.25 In players with persistent postconcussive symptoms (PCS) and a history of RC, outcome was measured on whether the player RTP within a year or resigned due to persistent PCS (≤1 vs >1 year). In the PCS group, symptom severity was assessed with the Rivermead Post-Concussion Questionnaire.26 In the clinic-based TBI cohort, severity was classified according to the US Department of Defense and Veterans Affairs guidelines.27 The Glasgow Outcome Scale–Extended (GOS-E) was used to measure functional outcome.28
We tested associations between serum NfL and GM, WM, and corpus callosum (CC) volumes. The rationale for selecting these brain regions is that NfL is found predominantly in WM axons and that GM, WM, and CC volumes are surrogate markers of general brain atrophy.29 The CC is a also a central WM structure and has been shown to be highly vulnerable to TAI.30 TAI is frequently quantified with the use of DTI measures of FA (reduced in the chronic phase), RD (increased), and MD (increased).30
Statistical analysis
The diagnostic utility of NfL was determined by calculating the area under the receiver operating characteristic curve (AUROC). Longitudinal changes in serum NfL were assessed with linear mixed-effects models with random intercept and slope. Generalized linear regression models were constructed for assessing the associations between cross-sectional measures of brain volume, DTI, GOS-E score, clinical variables, and serum NfL. For simplicity, we also report the Spearman rank correlations coefficient (ρ). All tests were 2 sided, and statistical significance was determined at p < 0.05. When appropriate, p values were corrected for multiple comparisons. All statistical calculations were performed with R (version 3.0.3, R Foundation for Statistical Computing, Vienna, Austria). A detailed description of the statistical methods is provided in the supplementary data (available from Dryad, doi.org/10.5061/dryad.8pk0p2nj6).
Standard protocol approvals, registration, and patient consents
The institutional review boards at the University of Gothenburg, Sweden, and NIH approved the studies. All participants gave written informed consent.
Data availability
The data supporting the findings are available on request to the corresponding author.
Results
NfL in sports-related concussion
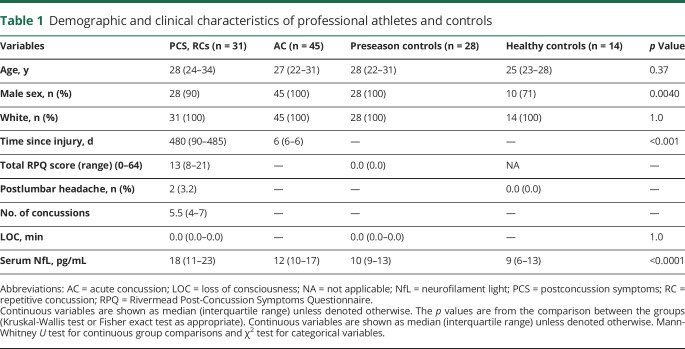
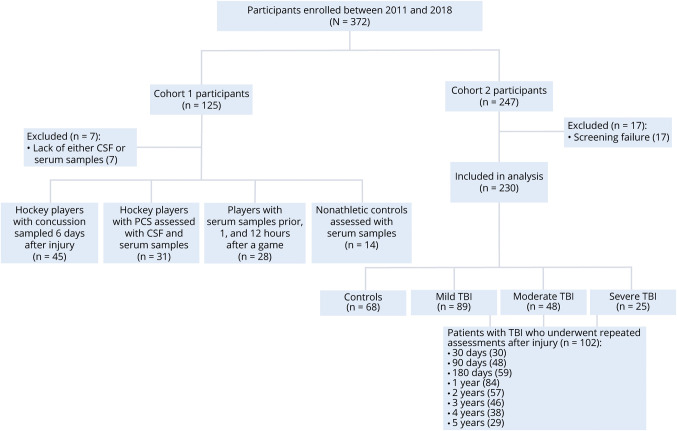
Demographic and clinical characteristics of the study participants are summarized in table 1. A total of 125 participants were enrolled between September 2013 and September 2018 (figure 1). Of 125 participants, 118 (45 with AC [sampled 6 days after injury], 31 with PCS due to RC [median 1.3 years since most recent concussion], 28 players who contributed samples during preseason, and 14 healthy controls) were included in the final analyses after the exclusion of 7 participants with missing CSF aliquots (figure 1). Players with PCS and healthy controls were assessed with paired CSF and serum sampling. Of 31 players with PCS, 12 of the players RTP or were symptom free within 1 year, while 19 had PCS >1 year and had resigned from professional play due to persistent symptoms, including headache, fatigue, difficulty concentrating, and irritability (figure e-1, available from Dryad, doi.org/10.5061/dryad.8pk0p2nj6). Six players with AC who developed PCS were also assessed with repeated blood draws and lumbar punctures. One of the teams was sampled before and 1 and 12 hours after a warmup game of hockey.
Table 1.
Demographic and clinical characteristics of professional athletes and controls
Figure 1. Flowchart of study participants.
Flowchart shows study participants in the 2 study cohorts. The first cohort included 45 professional ice hockey players with acute concussion sampled at 6 days after a sports-related concussion, 31 professional hockey players with postconcussion symptoms (PCS) due to repetitive concussions, 28 ice hockey players who underwent blood sampling at preseason, and 14 healthy controls. The players with persistent PCS due to repetitive concussions and healthy controls also underwent paired CSF and serum assessment. The second cohort includes 162 clinic-based patients with subacute and chronic traumatic brain injury (TBI) and 68 healthy controls after the exclusion 17 participants due to screen failure. Of 162, 102 underwent repeated blood, imaging, and functional assessments up to 5 years.
Serum NfL relates to CSF NfL
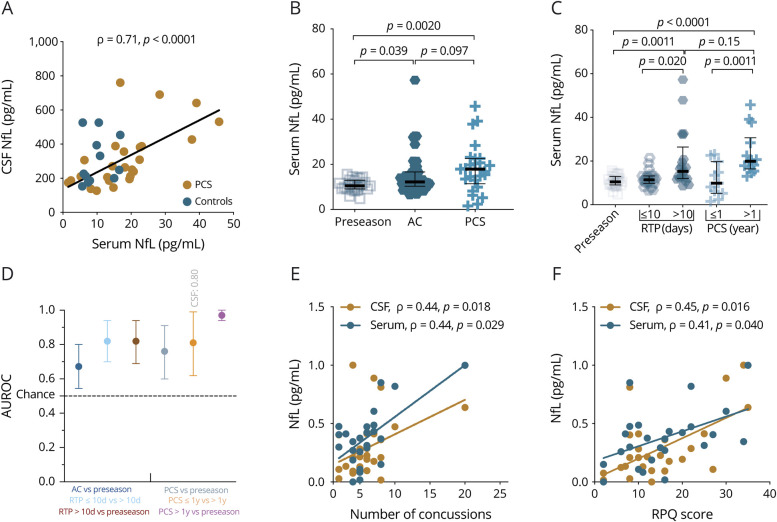
CSF NfL correlated closely with serum NfL in 28 players with RC and 14 healthy controls (r = 0.71, p < 0.0001, figure 2A). There were no associations between serum NfL and CSF:serum albumin ratio (figure e-2A, available from Dryad, doi.org/10.5061/dryad.8pk0p2nj6). Players with PCS >1 year had higher concentrations of CSF NfL than players with PCS ≤1 year (median 289.5 [interquartile range (IQR) 242.2–505.2] pg/mL vs median 198.7 [IQR 152.8–294.7] pg/mL, p = 0.0007, figure e-2B, available from Dryad).
Figure 2. Serum NfL shows diagnostic and prognostic utility for both AC and chronic repetitive concussion.
(A) Association between CSF and serum neurofilament light (NfL) obtained from players with postconcussion symptoms (PCS) due to repetitive mild concussion (n = 28) and healthy controls (n = 14). (B) Serum NfL concentrations in players who contributed blood samples during preseason, players with acute concussion (AC), and players with PCS. (C) Serum concentrations in relation to return to play (RTP) and duration of PCS. (D) Individual areas under the receiver operating characteristics curve (AUROCs) (error bars indicate the mean and 95% confidence interval) for how well serum NfL distinguishes players with AC from preseason controls, those with RTP ≥10 days from those with RTP <10 days, those with PCS >1 year from those with PCS ≤1 year, and players with PCS >1 year from preseason controls. (E) Higher concentration of CSF or serum NfL is associated with the number of concussions. (F) NfL increases with symptom severity score. Preseason samples are from professional hockey players who contributed samples during the preseason. The p values are from Kruskal-Wallis test, adjusted for multiple comparisons with the Benjamini-Hochberg procedure. Fitted lines are from the linear regression model (overlaid for visual clarity). The y-axes of plots E and F are normalized for comparison between CSF and serum values. RPQ = Rivermead Post-Concussion Questionnaire.
Serum NfL in relation to strenous excercise or body trauma
There were no differences in serum NfL measured before and 1 and 12 hours after a warmup game without concussion incident (figure e-2C, available from Dryad, doi.org/10.5061/dryad.8pk0p2nj6).
Serum NfL is associated with both AC and RC
Concentrations of NfL did not differ between hockey players who contributed serum samples during preseason and healthy controls (median 10 [IQR 9–13] pg/mL vs median 9 [IQR 6–13] pg/mL, p = 0.60, table e-1, available from Dryad, doi.org/10.5061/dryad.8pk0p2nj6). Serum NfL concentrations were increased in players with PCS compared to players who contributed samples during preseason (median 18 [IQR 11–23] pg/mL vs median 10 [IQR 9–13] pg/mL, p = 0.0036, figure 2B). Serum NfL concentrations did not differ between the PCS and AC groups after correction for multiple comparisons (median 18 [IQR 11–23] pg/mL vs median 12 [IQR 10–17] pg/mL, p = 0.09, figure 2B).
NfL predicts duration of PCS or RTP
Serum NfL concentrations at 6 days after AC were 1.3 times higher in players with RTP >10 days than in those with RTP ≤10 days (median 15.3 [IQR 12.0–26.4] pg/mL vs median 11.4 [IQR 9.8–13.2] pg/mL, p = 0.020, figure 2C). In the PCS group, concentrations of serum NfL were 2.0 times higher in players with PCS >1 year than in those with PCS ≤1 year (median 19.9 [IQR 16.5–30.7] pg/mL vs median 9.8 [IQR 5.2–19.8] pg/mL, p = 0.0011, figure 2C).
NfL shows prognostic utility for both AC and RC
Serum NfL measured at 6 days after AC could distinguish players with RTP >10 days vs those with RTP ≤10 days with an AUROC of 0.82 (95% confidence interval 0.70–0.94, figure 2D). In the persistent PCS group, CSF and serum NfL concentrations distinguished players with PCS >1 year from those with PCS ≤1 year with AUROCs of 0.80 (95% confidence interval 0.55–0.67) and 0.81 (95% confidence interval 0.62–0.99), respectively (figure 2D). Serum NfL distinguished players with persistent PCS >1 year from preseason controls with an AUROC of 0.97 (95% confidence interval 0.94–1.0, figure 2D).
Longitudinal assessment of serum NfL in a subset of players with RC
In the subset of acute concussed players (n = 6) who developed persistent PCS and agreed to undergo longitudinal assessments, we observed an increase in serum NfL over the months or years after concussion in all except 1 player who could RTP within 3 months (figure e-3, available from Dryad, doi.org/10.5061/dryad.8pk0p2nj6).
NfL is associated with number of concussions and symptom severity scores
Both CSF and serum NfL showed associations with number of concussions (r = 0.44, p = 0.018 and r = 0.44, p = 0.029, respectively, figure 2E) and Rivermead Post-Concussion Questionnaire scores (r = 0.45, p = 0.016 and r = 0.41, p = 0.040, respectively, figure 2F).
NfL in clinic-based TBI cohort
A total of 230 participants (162 with TBI [median 7 months after recent TBI] and 68 healthy controls) were enrolled at the Clinical Center, NIH (figure 1). Of 162 patients with TBI, 89 were classified as mTBI and had no abnormalities on conventional MRI, 48 had moderate TBI, and 25 had severe TBI. Demographic and clinical characteristics of the participants at enrollment are shown in table 2. Patients with TBI also underwent serum, functional outcome, and imaging assessments at 30 (n = 30), 90 (n = 48), and 180 (n = 59) days and 1 (n = 84), 2 (n = 57), 3 (n = 46), 4 (n = 38), and 5 (n = 29) years after injury.
Table 2.
Demographic characteristics of clinic-based participants at enrollment
Serum NfL is elevated in chronic TBI and relates to injury severity
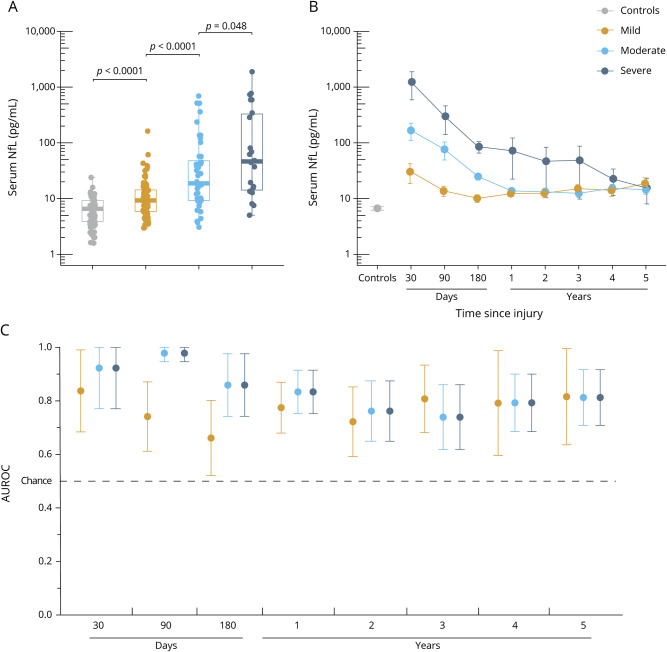
In cross-sectional serum samples, concentrations of NfL were 2.0 times higher in patients with TBI than in controls (median 12.8 [IQR 7.2–33] pg/mL vs median 6.3 [IQR 3.6–9.2] pg/mL, p < 0.0001, table e-1, available from Dryad, doi.org/10.5061/dryad.8pk0p2nj6). Serum NfL was elevated in patients with mTBI, moderate TBI, and severe TBI compared with controls (p < 0.001 for all, figure 3A), as well as in those with moderate TBI vs mTBI and severe vs moderate TBI (p < 0.001, p < 0.048, respectively, figure 3A).
Figure 3. Serum NfL shows diagnostic utility in patients with subacute and chronic TBI.
(A) Serum concentrations of neurofilament light (NfL) measured at enrollment (median 7 months after injury) across traumatic brain injury (TBI) severity and controls. The p values are from the Kruskal-Wallis test, adjusted for multiple comparisons with the Benjamin-Hochberg procedure. (B) Serum NfL over time in patients with longitudinal data. The y-axes of plots A and B are log-transformed for visual clarity. (C) Diagnostic accuracy (area under the receiver operating characteristic curve [AUROC], error bars indicate 95% confidence interval) of serum NfL measured at different time points after injury vs controls. Boxplots show the median and interquartile range.
Longitudinally, serum NfL decreased in a linear fashion over the course of 5 years (ß = −0.09 log pg/mL, p < 0.0001, figure 3B) but remained significantly elevated compared to controls for a prolonged period. Next, we assessed whether longitudinal changes in serum NfL concentrations differed among patients with different TBI severity and compared to controls (table e-1, available from Dryad, doi.org/10.5061/dryad.8pk0p2nj6). Serum NfL was increased in patients with mTBI, moderate TBI, and severe TBI compared with controls even at 5 years after injury (p = 0.0003, p = 0.0096, and p = 0.040, respectively, table e-1, available from Dryad).
Serum NfL shows diagnostic utility for subacute and chronic TBI
Serum NfL distinguished cases of mTBI, moderate TBI, and severe TBI from controls at 30 days with AUROCs of 0.84, 0.92, and 0.92, respectively (figure 3C). At 90 days, serum NfL distinguished cases of moderate and severe TBI from controls with AUROCs of 0.98, while at 180 days, the AUROCs for cases of mTBI and moderate TBI vs controls were both 0.85 (figure 3C). AUROCs over the following time points decreased for all severities but remained statistically significant (e.g., the AUROC for distinguishing those with mTBI from controls at 5 years was 0.80, figure 3C).
Association between serum NfL and functional outcome
At enrollment, increased serum NfL concentrations were associated with worse GOS-E scores assessed cross-sectionally (ß = −0.27 log pg/mL, p = 0.0015, figure e-4, available from Dryad, doi.org/10.5061/dryad.8pk0p2nj6). We also assessed whether serum NfL measured at different times after TBI could predict subsequent GOS-E score change. Higher serum NfL at 30 days was associated with an improvement in GOS-E score at 90 days (ß = 0.64 log pg/mL, p = 0.0002, table e-2, available from Dryad). No significant associations between NfL and GOS-E scores were observed beyond 30 days (table e-2, available from Dryad).
Associations between serum NfL and brain MRI volumes
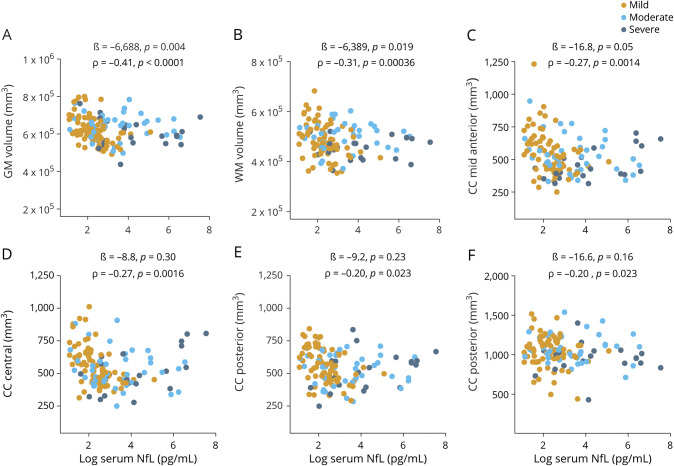
At enrollment, increased serum NfL concentrations were associated with a decrease in cross-sectional measures of total GM and WM volumes (ß = −6,958, p = 0.004 and ß = −6,389, p = 0.019, figure 4, A and B). Similarly, increased serum NfL concentrations were associated with a decreased volume in all segments of the CC except anterior after correction for multiple comparisons (figure 4, C–F and figure e-5, available from Dryad, doi.org/10.5061/dryad.8pk0p2nj6).
Figure 4. Association between serum NfL at enrollment and cross-sectional measures of GM, WM, and CC volumes.
(A–F) Association between serum neurofilament light (NfL) measured at enrollment and gray matter (GM), white matter (WM), and corpus callosum (CC) volumes assessed at enrollment (all patients with traumatic brain injury). The ß estimates and p values are from regression models, covaried for age, education, sex, and total intracranial volume. We also assessed the relationship with univariate Spearman rank correlation (ρ). Brain regions were normalized to total intracranial volume before analysis with ρ.
Longitudinally, serum NfL at 180 days predicted WM volume loss from 180 days to 1 year (ß = −3,881, p = 0.001, table e-3, available from Dryad, doi.org/10.5061/dryad.8pk0p2nj6). Serum NfL at 1 year was associated with the rate of volume loss in the midanterior CC from 1 to 2 years (ß = −34.5, p = 0.0001, table e-3, available from Dryad). Increased serum NfL at 3 years was associated with the rate of volume loss in central CC volume over the subsequent year (ß = −35.1, p = 0.0006, table e-3, available from Dryad).
Associations between serum NfL and DTI measures of WM integrity
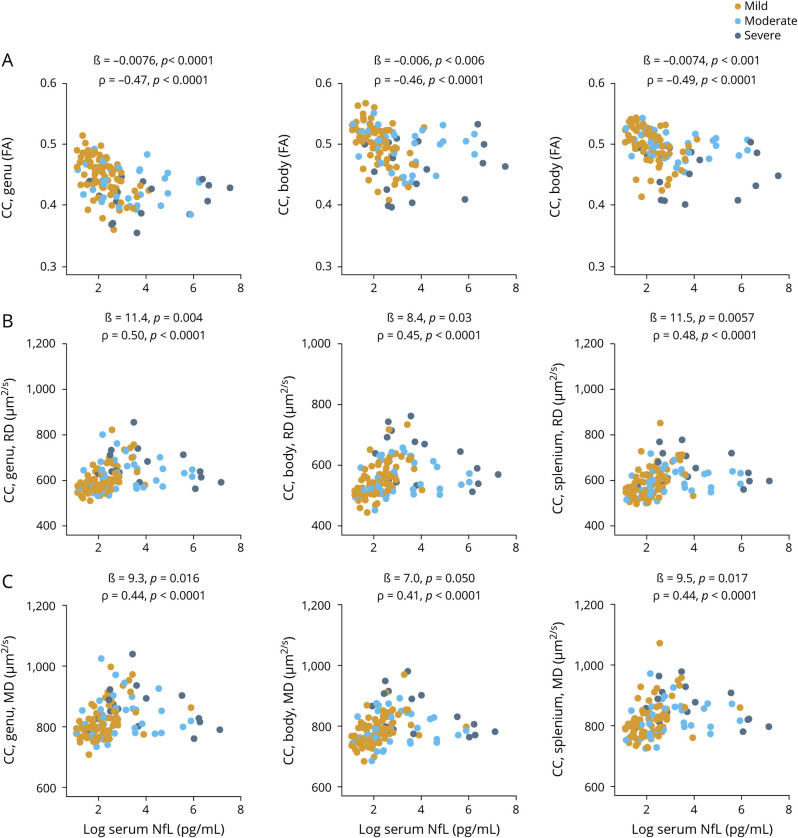
At enrollment, increased serum NfL was associated with a decrease in DTI FA for all segments of the CC (ß = −0.0075, p < 0.0001; ß = −0.0071, p = 0.004; and ß = −0.0075, p < 0.0001, respectively, figure 5A). Similarly, increased serum NfL correlated with increases in DTI RD and MD but not AD for all segments of the CC after correction for multiple comparisons (figure 5, B and C, and figure e-6, available from Dryad, doi.org/10.5061/dryad.8pk0p2nj6).
Figure 5. Serum NfL concentration at enrollment shows association with cross-sectional DTI white matter integrity.
(A–C) Association between serum neurofilament light (NfL) measured at enrollment and diffusion tensor imaging (DTI) measures of corpus callosum (CC) integrity measured at enrollment (all traumatic brain injury severities). The ß estimates and p values are from regression models, covaried for age, education, and sex. We also assessed the relationship with univariate Spearman rank correlation (ρ). FA = fractional anisotropy; MD = mean diffusivity; RD = radial diffusivity.
Serum NfL predicted subsequent DTI CC changes (table e-4, available from Dryad, doi.org/10.5061/dryad.8pk0p2nj6). The strongest associations were observed for serum NfL measured at 3 years, which predicted a decrease in DTI FA for the genu CC from 3 to 4 years (ß = −0.010, p < 0.0001, table e-4, available from Dryad). Similarly, NfL at 3 years predicted a positive change in DTI RD for the genu CC from 3 to 4 years (ß = 16.4, p = 0.006, table e-4, available from Dryad). For the other time points, the associations were weak (table e-4, available from Dryad).
Discussion
The main findings of this study are the following: (1) CSF NfL correlated strongly with serum values; serum NfL distinguished players with persistent PCS due to RC from players who contributed samples during the preseason with an AUROC of 0.97; and higher CSF and serum NfL levels were associated with a higher number of concussions and symptom severity. (2) In the clinic-based cohort, patients with TBI had increased concentrations of NfL compared with controls for up to 5 years, with higher concentrations in moderate or severe cases; serum NfL distinguished patients with TBI from controls at 30, 90, and 180 days with high accuracy and showed an association with functional outcome; serum NfL measured at enrollment correlated with brain volumes and DTI measures of WM axonal integrity; and finally, serum NfL measured during the chronic postinjury period was associated with the likely rate of brain atrophy and progression of TAI. Our findings suggest that NfL concentrations in serum offer rapid and accessible means of assessing and predicting neuronal damage in patients with TBI.
In hockey players with PCS due to RCs, we observed strong correlations between CSF and serum NfL. Since the development of the assay for ultrasensitive quantification of NfL in blood,14 we have observed correlations between CSF and serum samples from boxers measured 7 to 10 days after injury, as well as between serum NfL and ventricular CSF in patients with severe TBI.31 Similar results have been observed in other neurodegenerative disorders.7 Together, these findings suggest that serum NfL reflects CSF NfL. Thus, NfL in serum could be measured instead of CSF.
Paired CSF and serum sampling also allows assessment of serum NfL in relation to BBB integrity. We observed no associations between serum NfL and CSF:serum albumin ratio, suggesting that NfL may be released into the bloodstream at least partly independently of BBB integrity, consistent with a preclinical study showing no association between serum NfL and the BBB.32
Experimental and postmortem studies suggest that exposure to repetitive head trauma may cause chronic axonal degeneration.33,34 In direct support of this, we found higher serum NfL in hockey players with persistent PCS due to RC compared to hockey players who were assessed during the preseason, those with AC, and those with resolved PCS. In the subset of players with persistent PCS and longitudinal samples, serum NfL increased over the months and years after concussion, suggesting that repetitive head trauma may cause long-term axonal degeneration. Serum NfL also increased with number of concussions and symptom severity and showed a relationship to RTP in both players with AC and those with persistent PCS. In addition, serum NfL did not increase in players after a friendly warmup game without concussion. Together, these findings add support to the existing hypotheses that TAI may be an underlying mechanism for persistent PCS after RCs and that serum NfL is a sensitive biochemical marker for assessing TAI either acutely or in the months or years after injury.
In the clinic-based TBI cohort, we determined the time course of serum NfL and its relationship to advanced brain imaging. In this cohort, serum NfL distinguished patients with mTBI, moderate TBI, and severe TBI. Notably, serum NfL distinguished patients with mTBI (all negative MRI because Veterans Affairs/Department of Defense criteria were used) from controls, and the concentrations in mTBIs were elevated for up to 5 years after injury (AUROC 0.80), suggesting that a single mTBI may result in long-term axonal degeneration that can be detected with serum NfL. We also observed a modest association between NfL measured in cross-sectional serum samples and GOS-E scores. We previously observed increased concentrations of serum NfL up to 1 year after injury in patients with severe TBI, with initial levels associated with GOS-E scores.14 Together, these findings suggest that serum NfL may be a sensitive biomarker for assessing axonal degeneration months to years after TBI.
To further support this hypothesis, we attempted to cross-validate NfL with brain MRI volumetric analysis and DTI in our clinic-based cohort. We found that increased serum NfL is associated with decreased GM, WM, and CC volumes. For DTI measures, reduced FA in the CC was associated with increased serum NfL, while increases in RD and MD were associated with increased serum NfL. In addition, in longitudinal assessments, serum NfL measured during the chronic postinjury period was associated with the likely rate of MRI brain atrophy and DTI measures of progression of TAI. These DTI findings are in direct comparison to a recent study of 9 patients revealing a strong relationship between serum NfL measured 6 days after injury with TAI assessed with DTI 12 months later.35
That 2 independent studies and multiple methodologies herein yielded similar results is a principal proof of independent cross-validation of these methods. From the scientific perspective, this greatly increases the confidence of the 4 methods (blood, CSF, brain MRI volumes, and DTI). From a clinical perspective, these methods may have complementary strengths and limitations. For instance, MRI volumetric analysis is less technically challenging than DTI yet provides no information on WM axonal microstructure, while DTI provides more detailed and region-specific information on WM microstructure but has limited availability and high cost. Similarly, CSF NfL is invasive and not readily available, yet our results indicate that serum NfL corresponds closely to CSF levels. Thus, if the 4 measures provide convergent information, this provides flexibility to the clinician and those conducting interventional trials of TBI.
There are limitations to this study. In our athlete cohort, although we managed to get paired CSF and serum samples in the PCS group, we could not motivate the professional athletes with AC and athletes who contributed blood samples during preseason to also undergo lumbar puncture. Second, data on the number of concussions for players who contributed serum samples during the preseason were not part of the initial study design; thus, we could not take number of concussions into account. Third, we did not have longitudinal data on all participants to investigate the precise relationship between persistent PCS and RCs. Fourth, we did not have longitudinal data at all time points in the clinic-based cohort, an issue inherent to many longitudinal studies. Fifth, longer longitudinal follow-up than the present study is required to determine the relationship between blood NfL and progressive neurodegeneration. Lastly, we did not compare serum NfL to other CNS-derived serum biomarkers that have shown promise as biomarkers of injury such as glial fibrillary acidic protein, tau, and ubiquitin carboxy-terminal hydrolase-L1.15,36–38 However, we have conducted a detailed comparison of these biomarkers and their relationship to MRI brain volumetry and DTI measures of TAI in a companion article.39
This study shows that persistent PCS in professional athletes with a history of RC is associated with CSF and serum signs of neuroaxonal degeneration. Furthermore, this study shows that a single mTBI may cause long-term neuroaxonal degeneration. In addition, NfL shows potential as a prognostic blood biomarker for acute and repetitive sports-related concussion and in patients with subacute and chronic TBI. The strong relationships seen between serum NfL and DTI measures of TAI suggest that serum NfL could be used to assess TAI or as a prognostic blood biomarker of disease progression or neuroaxonal damage after TBI. In light of these findings, serum NfL may have a potential role in facilitating the development of novel disease-modifying therapeutics and possibly guiding treatment decisions. To translate these findings into clinical practice, future studies should standardize methods of quantification across different analytic platforms and determine cutoffs across age and severity.
Acknowledgment
The authors thank the study participants, their families, and the care providers who made this study possible. The views expressed in this manuscript are those of the authors and do not reflect the policy of the US Department of the Army, Navy, Air Force, Department of Defense, or US government. The identification of specific products or scientific instrumentation is considered an integral part of the scientific endeavor and does not constitute endorsement or implied endorsement on the part of the author, Department of Defense, or any component agency.
Glossary
- AC
acute concussion
- AD
axial diffusivity
- AUROC
area under the receiver operating characteristic curve
- BBB
blood-brain barrier
- CC
corpus callosum
- DTI
diffusion tensor imaging
- FA
fractional anisotropy
- GM
gray matter
- GOS-E
Glasgow Outcome Scale-Extended
- IQR
interquartile range
- MD
mean diffusivity
- mTBI
mild TBI
- NfL
neurofilament light
- PCS
postconcussive symptoms
- RC
repetitive concussion
- RD
radial diffusivity
- RTP
return to play
- TAI
traumatic axonal injury
- TBI
traumatic brain injury
- WM
white matter
Appendix. Authors
Footnotes
Study funding
Funding provided by the Intramural Research Program at the NIH and the Department of Defense (Center for Neuroscience and Regenerative Medicine). The corresponding author had full access to all the data in the study and had final responsibility for the decision to submit for publication.
Disclosure
P. Shahim, A. Politis, A. van der Merwe, B. Moore, D.L. Pham, and J. Butman report no disclosures relevant to the manuscript. R. Diaz-Arrastia serves on the Scientific Advisory Board or BrainBox, Inc and Neural Analytics. J. Gill reports no disclosures relevant to the manuscript. D. Brody has served as a paid consultant for Pfizer Inc, Intellectual Ventures, Signum Nutralogix, Kypha Inc, Sage Therapeutics, iPerian Inc, Navigant, Avid Radiopharmaceuticals (Eli Lilly & Co), the St. Louis County Public Defender, the US Attorney's Office, the St. Louis County Medical Examiner, GLG, Stemedica, and Luna Innovations. Dr. Brody holds equity in Inner Cosmos. Dr. Brody receives royalties from sales of Concussion Care Manual (Oxford University Press). H. Zetterberg has served on scientific advisory boards for CogRx, Samumed, Roche Diagnostics, and Wave; has given a scientific presentation in a Biogen-sponsored symposium; and is a cofounder of Brain Biomarker Solutions in Gothenburg AB, a GU Ventures–based platform company at the University of Gothenburg. K. Blennow has served as a consultant to or on advisory boards for Alector, Alzheon, CogRx, Biogen, Lilly, Novartis, and Roche Diagnostics and is a cofounder of Brain Biomarker Solutions in Gothenburg AB, a GU Venture–based platform company at the University of Gothenburg. L. Chan reports no disclosures relevant to the manuscript. Go to Neurology.org/N for full disclosures.
References
- 1.Maas AIR, Menon DK, Adelson PD, et al. Traumatic brain injury: integrated approaches to improve prevention, clinical care, and research. Lancet Neurol 2017;16:987–1048. [DOI] [PubMed] [Google Scholar]
- 2.Taylor CA, Bell JM, Breiding MJ, Xu L. Traumatic brain injury-related emergency department visits, hospitalizations, and deaths–United States, 2007 and 2013. MMWR Surveill Summ 2017;66:1–16. [DOI] [PMC free article] [PubMed] [Google Scholar]
- 3.Marion CM, Radomski KL, Cramer NP, Galdzicki Z, Armstrong RC. Experimental traumatic brain injury identifies distinct early and late phase axonal conduction deficits of white matter pathophysiology, and reveals intervening recovery. J Neurosci 2018;38:8723–8736. [DOI] [PMC free article] [PubMed] [Google Scholar]
- 4.Hulkower MB, Poliak DB, Rosenbaum SB, Zimmerman ME, Lipton ML. A decade of DTI in traumatic brain injury: 10 years and 100 articles later. AJNR Am J Neuroradiol 2013;34:2064–2074. [DOI] [PMC free article] [PubMed] [Google Scholar]
- 5.Tosetti P, Hicks RR, Theriault E, et al. Toward an international initiative for traumatic brain injury research. J Neurotrauma 2013;30:1211–1222. [DOI] [PMC free article] [PubMed] [Google Scholar]
- 6.Khalil M, Teunissen CE, Otto M, et al. Neurofilaments as biomarkers in neurological disorders. Nat Rev Neurol 2018;14:577–589. [DOI] [PubMed] [Google Scholar]
- 7.Disanto G, Barro C, Benkert P, et al. Serum neurofilament light: a biomarker of neuronal damage in multiple sclerosis. Ann Neurol 2017;81:857–870. [DOI] [PMC free article] [PubMed] [Google Scholar]
- 8.Novakova L, Zetterberg H, Sundstrom P, et al. Monitoring disease activity in multiple sclerosis using serum neurofilament light protein. Neurology 2017;89:2230–2237. [DOI] [PMC free article] [PubMed] [Google Scholar]
- 9.Mattsson N, Andreasson U, Zetterberg H, Blennow K; Alzheimer's Disease Neuroimaging Initiative. Association of plasma neurofilament light with neurodegeneration in patients with Alzheimer disease. JAMA Neurol 2017;74:557–566. [DOI] [PMC free article] [PubMed] [Google Scholar]
- 10.Wilke C, Preische O, Deuschle C, et al. Neurofilament light chain in FTD is elevated not only in cerebrospinal fluid, but also in serum. J Neurol Neurosurg Psychiatry 2016;87:1270–1272. [DOI] [PubMed] [Google Scholar]
- 11.Preische O, Schultz SA, Apel A, et al. Serum neurofilament dynamics predicts neurodegeneration and clinical progression in presymptomatic Alzheimer's disease. Nat Med 2019;25:277–283. [DOI] [PMC free article] [PubMed] [Google Scholar]
- 12.Gisslen M, Price RW, Andreasson U, et al. Corrigendum to: “Plasma concentration of the neurofilament light protein (NFL) is a biomarker of CNS injury in HIV infection: a cross-sectional study” [EBioMedicine 3 (216) 135-140]. EBioMedicine 2016;7:287–288. [DOI] [PMC free article] [PubMed] [Google Scholar]
- 13.Gaiottino J, Norgren N, Dobson R, et al. Increased neurofilament light chain blood levels in neurodegenerative neurological diseases. PLoS One 2013;8:e75091. [DOI] [PMC free article] [PubMed] [Google Scholar]
- 14.Shahim P, Gren M, Liman V, et al. Serum neurofilament light protein predicts clinical outcome in traumatic brain injury. Sci Rep 2016;6:36791. [DOI] [PMC free article] [PubMed] [Google Scholar]
- 15.Gill J, Latour L, Diaz-Arrastia R, et al. Glial fibrillary acidic protein elevations relate to neuroimaging abnormalities after mild TBI. Neurology 2018;91:e1385–e1389. [DOI] [PMC free article] [PubMed] [Google Scholar]
- 16.Iverson GL, Reddi PJ, Posti JP, et al. Serum neurofilament light is elevated differentially in older adults with uncomplicated mild traumatic brain injuries. J Neurotrauma 2019;36:2400–2406. [DOI] [PubMed] [Google Scholar]
- 17.Hossain I, Mohammadian M, Takala RSK, et al. Early levels of glial fibrillary acidic protein and neurofilament light protein in predicting the outcome of mild traumatic brain injury. J Neurotrauma 2019:36:1551–1560. [DOI] [PubMed] [Google Scholar]
- 18.Skillback T, Delsing L, Synnergren J, et al. CSF/serum albumin ratio in dementias: a cross-sectional study on 1861 patients. Neurobiol Aging 2017;59:1–9. [DOI] [PubMed] [Google Scholar]
- 19.Shahim P, Tegner Y, Gustafsson B, et al. Neurochemical aftermath of repetitive mild traumatic brain injury. JAMA Neurol 2016;73:1308–1315. [DOI] [PubMed] [Google Scholar]
- 20.Tustison NJ, Avants BB, Cook PA, et al. N4ITK: improved N3 bias correction. IEEE Trans Med Imaging 2010;29:1310–1320. [DOI] [PMC free article] [PubMed] [Google Scholar]
- 21.Roy S, Butman JA, Pham DL; Alzheimer’s Disease Neuroimaging Initiative. Robust skull stripping using multiple MR image contrasts insensitive to pathology. Neuroimage 2017;146:132–147. [DOI] [PMC free article] [PubMed] [Google Scholar]
- 22.Pierpaoli C, Walker L, Irfanoglu MO, et al. TORTOISE: An Integrated Software Package for Processing of Diffusion MRI Data. Presented at the ISMRM 18th Annual Meeting; May 1–7, 2010; Stockholm, Sweden.
- 23.Avants BB, Tustison NJ, Song G, Cook PA, Klein A, Gee JC. A reproducible evaluation of ANTs similarity metric performance in brain image registration. Neuroimage 2011;54:2033–2044. [DOI] [PMC free article] [PubMed] [Google Scholar]
- 24.Bazin PL, Ye C, Bogovic JA, et al. Direct segmentation of the major white matter tracts in diffusion tensor images. Neuroimage 2011;58:458–468. [DOI] [PMC free article] [PubMed] [Google Scholar]
- 25.McCrory P, Meeuwisse WH, Aubry M, et al. Consensus statement on concussion in sport: the 4th International Conference on Concussion in Sport held in Zurich, November 2012. Br J Sports Med 2013;47:250–258. [DOI] [PubMed] [Google Scholar]
- 26.Cifu DX, Walker WC, West SL, et al. Hyperbaric oxygen for blast-related post-concussion syndrome: 3-month outcomes. Ann Neurol 2014;75:277–286. [DOI] [PubMed] [Google Scholar]
- 27.VA/DoD Clinical Practice Guideline For The Management Of Concussion-Mild Traumatic Brain Injury. 2009. Available at: https://www.rehab.research.va.gov/jour/09/46/6/pdf/cpg.pdf. [Google Scholar]
- 28.Wilson JT, Pettigrew LE, Teasdale GM. Structured interviews for the Glasgow Outcome Scale and the extended Glasgow Outcome Scale: guidelines for their use. J Neurotrauma 1998;15:573–585. [DOI] [PubMed] [Google Scholar]
- 29.Yuan A, Rao MV, Veeranna, Nixon RA. Neurofilaments and neurofilament proteins in health and disease. Cold Spring Harb Perspect Biol 2017;9:a018309. [DOI] [PMC free article] [PubMed] [Google Scholar]
- 30.Hunter LE, Lubin N, Glassman NR, Xue X, Spira M, Lipton ML. Comparing region of interest versus voxel-wise diffusion tensor imaging analytic methods in mild and moderate traumatic brain injury: a systematic review and meta-analysis. J Neurotrauma 2019;36:1222–1230. [DOI] [PMC free article] [PubMed] [Google Scholar]
- 31.Shahim P, Zetterberg H, Tegner Y, Blennow K. Serum neurofilament light as a biomarker for mild traumatic brain injury in contact sports. Neurology 2017;88:1788–1794. [DOI] [PMC free article] [PubMed] [Google Scholar]
- 32.Kalm M, Bostrom M, Sandelius A, et al. Serum concentrations of the axonal injury marker neurofilament light protein are not influenced by blood-brain barrier permeability. Brain Res 2017;1668:12–19. [DOI] [PubMed] [Google Scholar]
- 33.Corsellis JA, Bruton CJ, Freeman-Browne D. The aftermath of boxing. Psychol Med 1973;3:270–303. [DOI] [PubMed] [Google Scholar]
- 34.McKee AC, Cantu RC, Nowinski CJ, et al. Chronic traumatic encephalopathy in athletes: progressive tauopathy after repetitive head injury. J Neuropathol Exp Neurol 2009;68:709–735. [DOI] [PMC free article] [PubMed] [Google Scholar]
- 35.Ljungqvist J, Zetterberg H, Mitsis M, Blennow K, Skoglund T. Serum neurofilament light protein as a marker for diffuse axonal injury: results from a case series study. J Neurotrauma 2017;34:1124–1127. [DOI] [PubMed] [Google Scholar]
- 36.Burman E, Lysholm J, Shahim P, Malm C, Tegner Y. Concussed athletes are more prone to injury both before and after their index concussion: a data base analysis of 699 concussed contact sports athletes. BMJ Open Sport Exerc Med 2016;2:e000092. [DOI] [PMC free article] [PubMed] [Google Scholar]
- 37.Bazarian JJ, Biberthaler P, Welch RD, et al. Serum GFAP and UCH-L1 for prediction of absence of intracranial injuries on head CT (ALERT-TBI): a multicentre observational study. Lancet Neurol 2018;17:782–789. [DOI] [PubMed] [Google Scholar]
- 38.Posti JP, Takala RSK, Lagerstedt L, et al. Correlation of blood biomarkers and biomarker panels with traumatic findings on computed tomography after traumatic brain injury. J Neurotrauma 2019;36:2178–2189. [DOI] [PMC free article] [PubMed] [Google Scholar]
- 39.Shahim P, Politis A, van der Merwe A, et al. Time course and diagnostic utility of NfL, tau, GFAP, and UCH-L1 in subacute and chronic TBI. Neurology 2020; In press. [DOI] [PMC free article] [PubMed] [Google Scholar]
Associated Data
This section collects any data citations, data availability statements, or supplementary materials included in this article.
Data Availability Statement
The data supporting the findings are available on request to the corresponding author.


