Abstract
Acidosis is a key driver for many diseases, including cancer, sepsis, and stroke. The spatiotemporal dynamics of dysregulated pH across disease remain elusive, and current diagnostic strategies do not provide localization of pH alterations. We sought to explore if PET imaging using hydrophobic cyclic peptides that partition into the cellular membrane at low extracellular pH (denoted as pH [low] insertion cycles, or pHLIC) can permit accurate in vivo visualization of acidosis. Methods: Acid-sensitive cyclic peptide c[E4W5C] pHLIC was conjugated to bifunctional maleimide-NO2A and radiolabeled with 64Cu (half-life, 12.7 h). C57BL/6J mice were administered lipopolysaccharide (15 mg/kg) or saline (vehicle) and serially imaged with [64Cu]Cu-c[E4W5C] over 24 h. Ex vivo autoradiography was performed on resected brain slices and subsequently stained with cresyl violet to enable high-resolution spatial analysis of tracer accumulation. A non–pH-sensitive cell-penetrating control peptide (c[R4W5C]) was used to confirm specificity of [64Cu]Cu-c[E4W5C]. CD11b (macrophage/microglia) and TMEM119 (microglia) immunostaining was performed to correlate extent of neuroinflammation with [64Cu]Cu-c[E4W5C] PET signal. Results: [64Cu]Cu-c[E4W5C] radiochemical yield and purity were more than 95% and more than 99%, respectively, with molar activity of more than 0.925 MBq/nmol. Significantly increased [64Cu]Cu-c[E4W5C] uptake was observed in lipopolysaccharide-treated mice (vs. vehicle) within peripheral tissues, including blood, lungs, liver, and small intestines (P < 0.001–0.05). Additionally, there was significantly increased [64Cu]Cu-c[E4W5C] uptake in the brains of lipopolysaccharide-treated animals. Autoradiography confirmed increased uptake in the cerebellum, cortex, hippocampus, striatum, and hypothalamus of lipopolysaccharide-treated mice (vs. vehicle). Immunohistochemical analysis revealed microglial or macrophage infiltration, suggesting activation in brain regions containing increased tracer uptake. [64Cu]Cu-c[R4W5C] demonstrated significantly reduced uptake in the brain and periphery of lipopolysaccharide mice compared with the acid-mediated [64Cu]Cu-c[E4W5C] tracer. Conclusion: Here, we demonstrate that a pH-sensitive PET tracer specifically detects acidosis in regions associated with sepsis-driven proinflammatory responses. This study suggests that [64Cu]Cu-pHLIC is a valuable tool to noninvasively assess acidosis associated with both central and peripheral innate immune activation.
Keywords: acidosis, neuroinflammation, sepsis, pHLIC, 64Cu
Maintenance of physiologic pH is crucial for cellular homeostasis and is closely linked to innate immunologic function (1,2). When an acid–base imbalance occurs and blood or tissue pH becomes acidic—a condition known as acidosis—cellular and immune dysfunction can occur, resulting in a potentially life-threatening pathogenic state (3,4). Acidosis is one of the most common diagnoses seen in patients with critical illness, including cardiovascular disease, stroke, and sepsis, ultimately resulting in an overabundance of protons in the extracellular medium (5,6). These protons can interact with receptors on innate immune cells (e.g., monocytes, macrophages, and natural killer cells) to drive inflammatory responses (5,6). Both immune activation and suppression have been reported as a result of acidosis, with low pH differentially affecting immune responses depending on cell type and pathways being investigated (1,2,6). Pathologic acidosis and inflammation in peripheral tissues can trigger microglial activation in the central nervous system (CNS), implicating an important role for the crosstalk between acid-sensing ion channels and the immune system in neuroinflammatory diseases (1,7).
Efficient localization of acidosis has potential to greatly impact disease management and patient outcomes (3,8). Currently, acidosis is identified via urine sampling (ketoacidosis) or arterial blood collection (4,9). Although these techniques provide confirmation on physiologic state, neither affords region-specific information regarding the pathologically affected tissues; hence, accurate diagnosis and localization can be challenging (4,10). Metabolic acidosis is a common clinical pathology that manifests in different ways, affecting a breadth of tissues (11,12), and can acutely affect the CNS (13). Since CNS biopsies are extremely invasive, there is an unmet need to noninvasively quantify acidosis in the brain and whole body. Therefore, we sought to develop a probe to specifically detect acidosis with high sensitivity and identify whole-body or brain acid–base alterations, allowing for more informed clinical decisions and disease management.
Previously, we developed a novel class of molecules known as pH (low) insertion peptides (pHLIPs; pHLIP, Inc.) that target acidity and use a mechanism that does not rely on the selective efficacy of other biomarker technologies (e.g., the need for receptor upregulation at a specific site of disease to delineate from nontarget tissues) (14). The pHLIP family of peptides has thus far shown utility in tumor imaging and delivery of therapeutic agents (15–17). The mechanism of pHLIP entails protonation of negatively charged residues on a disordered linear peptide sequence in the acidic extracellular microenvironment, resulting in enhancement of peptide hydrophobicity and insertion into the phospholipid bilayer of the cell membrane, forming a stable transmembrane α-helix (14). This pH-sensitive concept was leveraged to develop a novel class of cyclic peptides (pH [low] insertion cycles, or pHLIC) for enhanced enzymatic stability versus linear peptides (18). These cyclic versions consist of negatively charged glutamate residues located at one side of the cycle and hydrophobic tryptophan residues on the other (19). The glutamate residues are protonated at low extracellular pH to allow for better diffusion of pHLIC into the membrane. When equilibrium is established, glutamate residues are deprotonated in cytoplasm, preventing pHLIC from exiting the membrane and anchoring cycles into the lipid bilayer.
Since pHLICs possess promising characteristics for blood–brain barrier (BBB) penetration (i.e., inherently hydrophobic and relatively small size), we chose to explore a PET-labeled version of a novel pHLIC peptide. We selected the lipopolysaccharide-induced mouse model of sepsis, as it is known to exhibit alterations in pH, extensive systemic inflammation, and brain microglial activation (5,6,20,21).
The aims of this study were to investigate the utility of our novel pH-sensitive probe, [64Cu]Cu-c[E4W5C] pHLIC, for tracking acidosis in lipopolysaccharide- versus saline-treated mice over the course of 24 h. The central hypothesis was that the pH-targeted cyclic peptide probe ([64Cu]Cu-c[E4W5C]) will successfully demarcate acidosis through PET and correspond with ex vivo brain uptake and macrophage or microglial activation. To confirm our probe’s specificity for the acidic microenvironment, we included a [64Cu]Cu-c[R4W5C] probe as a negative control. Arginine residues (instead of glutamate in the pH-sensitive peptide) will facilitate cell penetration (22) but not via a pH-sensitive mechanism of insertion.
We emphasize that it is not a facile process to take a biopsy of brain tissue. The innovation of this work lies in the ability to noninvasively collect a breadth of information regarding sepsis-induced acidosis in the whole-body and brain longitudinally using our newly developed PET radiotracer to shed light on the complexities of acidosis.
MATERIALS AND METHODS
Materials
All materials were purchased from Sigma-Aldrich, unless otherwise described.
Synthesis of pHLIC-NO2A Construct
Peptides were designed and synthesized in the Andreev, Reshetnyak, and Parang labs using solid-phase peptide synthesis techniques (Supplemental Figs. 1–4; supplemental materials are available at http://jnm.snmjournals.org). Cyclic peptides were conjugated to NO2A-maleimide using previously reported methods, which are further detailed in the supporting materials (16). Both pHLIC constructs were chosen for in vivo studies because of their favorable logP value (Supplemental Table 1) for BBB penetration (23). Cyclic peptide c[E4W5C] proceeded further because of pilot experiments showing more favorable BBB penetration, CNS biodistribution, and peripheral detection of acidosis in mice. Doses for animal experiments were diluted in phosphate-buffered saline to a maximum concentration of 5% ethanol.
Radiolabeling of pHLIC-NO2A
[64Cu]CuCl2 was obtained from University of Wisconsin–Madison (for Stanford University) and the University of Washington–St. Louis (for Memorial Sloan Kettering Cancer Center [MSK]). Each experiment included [64Cu]CuCl2 controls to ensure reproducibility between experiments and institutions. pHLIC-NO2A (20 μL, 16 nmol) was diluted in 0.1 M NH4Ac (pH 5.5) and incubated with [64Cu]CuCl2 (14–15 MBq) at 80°C for 15 min. [64Cu]Cu-c[E4W5C] was purified using a C18 Sep-Pak (Waters) with 100% ethanol elution. Radiochemical purity was assessed using instant thin-layer chromatography with a 50 mM ethylenediaminetetraacetic acid (pH 5) eluent. Partition coefficient experiments proceeded in a phosphate-buffered saline-to-octanol mixture using previously reported techniques (24). Cold labeling of pHLIC-NO2A along with a description of the biophysical measurements of natCu-c[E4W5C] and natCu-c[R4W5C] can be found in the supplemental materials.
Animal Models
All animal experiments were performed in accordance with the Stanford Administrative Panel on Laboratory Animal Care, which is accredited by the Association for the Assessment and Accreditation of Laboratory Animal Care or the Institutional Animal Care and Use Committee at MSK. Lipopolysaccharide (Escherichia coli) at a concentration of 3 mg/kg in sterile saline was injected intraperitoneally into female C57BL/6J mice (6–8 wk old; Jackson Laboratories) 3 h before [64Cu]Cu-c[E4W5C] administration (15 mg/kg). Saline was used as a vehicle control.
PET/CT Imaging
Radiotracer (16–20 nmol, 14–15 MBq in sterile phosphate-buffered saline, 130–150 μL) was injected intravenously, and 10-min static PET/CT images were acquired at 1, 5, 9, and 20 h (4, 8, 12, and 24 h after lipopolysaccharide inoculation) using a dual small-animal PET/CT scanner (Inveon; Siemens). PET time points with [64Cu]Cu-pHLIC were adapted from a time course previously established by Demoin et al. (16). Brain PET quantitation was completed using VivoQuant software (version 3.0; InviCRO) as described previously (25). Rodent anesthesia for both institutions was isoflurane, supplemented with either pure oxygen (at Stanford) or medical air (at MSK). The scan time at MSK was varied to achieve the same number of coincidence events to acquire high-resolution PET images at every time point. A disclaimer of variability between institutions is provided in the supplemental materials to help the reader understand how this variability may affect baseline radiotracer uptake.
Biodistribution Studies
Blood was collected via cardiac puncture before phosphate-buffered saline perfusion. Brain and other tissues were harvested and weighed wet. Radioactivity within each organ was counted using a Hidex automatic γ-counter. Tracer uptake expressed as percentage injected dose per gram was calculated as the radioactivity in each tissue divided by the organ mass and the decay-corrected injected dose at the time of counting, as determined by a calibration curve established via serial dilutions of the 64Cu-labeled peptide.
Autoradiography
Ex vivo autoradiography was performed as described previously (26) using 40-μm-thick left-hemisphere coronal brain sections collected at 12 and 24 h after injection of lipopolysaccharide. Anatomy was confirmed by Nissl staining (cresyl violet acetate), using standard techniques. After tissues were exposed to digital autoradiography films for 10 half-lives, each film was scanned using a Typhoon phosphor imager (Amersham). ImageJ software, version 2.0.0, was used to visualize images.
Immunohistochemistry
For semiquantitative evaluation of activated microglia and inflammation, staining of CD11b and TMEM119, respectively, was performed on 5-μm coronal brain sections using previously described methods (26,27).
Statistical Considerations
Prism (version 7; GraphPad Software) was used for statistical analyses of the data. Biodistribution data were analyzed by unpaired, 2-tailed Student t tests at the 95% confidence level. All other data were analyzed via 1-way or 2-way ANOVA with multiple comparisons. P values of 0.05 or less were considered significant.
RESULTS
Synthesis, Radiolabeling, and Biophysics of pHLIC
Peptide-chelator conjugates c[E4W5C]-NO2A and c[R4W5C]-NO2A were produced in 55%–60% yield with more than 99% purity. Mass spectrometry analyzed appropriate peaks before each subsequent step. The matrix-assisted laser desorption/ionization time-of-flight mass-spectrometry results were as follows: c[E4W5C]-NO2A [M+H]+ = m/z: 1,977.21 m/z; c[R4W5C]-NO2A [M+H]+ = m/z: 2,085.11 m/z. The liquid-chromatography mass-spectrometry results were as follows: [natCu]Cu-c[E4W5C] [M+5H]+ = m/z: 428.2 m/z; [natCu]Cu-c[R4W5C] [M+5H]+ = m/z: 446.7 m/z. Radiochemical yield and molar activity for all pHLIC conjugates were more than 95% and more than 0.925 MBq/nmol, respectively. Radiochemical purity was more than 99% for all peptide conjugates (Supplemental Fig. 4), and [64Cu]Cu-c[E4W5C] was more than 90% stable in serum out to 48 h (Supplemental Fig. 5). Measured logP values of [64Cu]Cu-c[E4W5C] were found to be 2.5 ± 0.6 at pH 6 and 2.0 ± 0.2 at pH 7.4 (n = 5 replicates per run; 3 independent measurements) (Supplemental Table 1). Biophysical measurements showed that natCu-c[E4W5C] was pH-dependent but that natCu-c[R4W5C] was not, indicating our pHLIC radiotracer to have pH sensitivity (Supplemental Fig. 6).
In Vivo Study Design
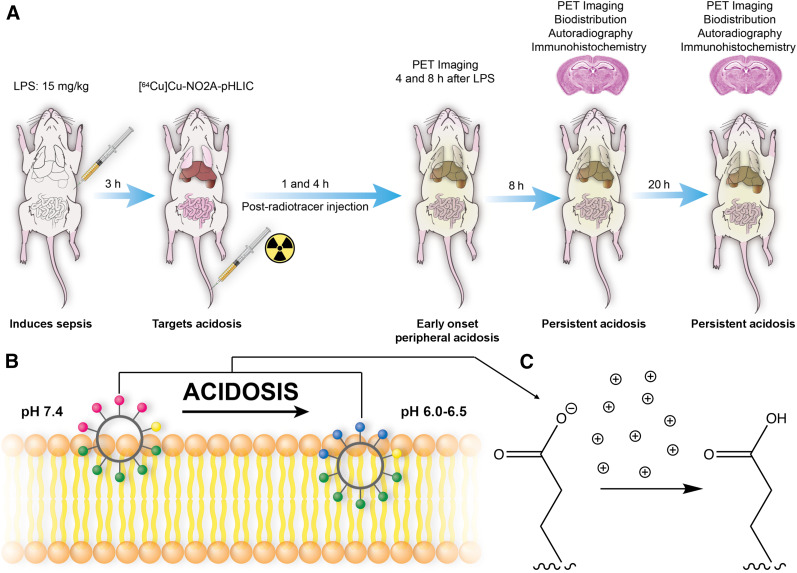
The onset of acidosis has been reported to manifest peripherally as early as 4 h after lipopolysaccharide injection; hence, we chose this as our first time point to study the pharmacokinetics of our radiotracer (21). Microglial activation occurs within 24 h after lipopolysaccharide administration in mice (7,28). To study alterations in acidosis-induced inflammation over time, [64Cu]Cu-c[E4W5C] was injected 3 h after lipopolysaccharide induction and static PET images were acquired at 1, 5, 9, and 21 h after radiotracer injection (corresponding to 4, 8, 12, and 24 h after lipopolysaccharide induction). Figure 1 illustrates this workflow along with the mechanism of pHLIC peptides’ interaction with membrane during acidotic conditions.
FIGURE 1.
Study workflow and mechanism of pHLIC membrane insertion. (A) Lipopolysaccharide was injected intraperitoneally into C57BL/6J mice, and 64Cu-labeled pHLIC radiotracer was administered intravenously 3 h later. Mice underwent PET imaging at 4, 8, 12, and 24 h after lipopolysaccharide treatment. Autoradiography and immunohistochemistry were performed 12 and 24 h after lipopolysaccharide treatment. (B) pHLICs consist of negatively charged glutamate residues located at one side of cycle and hydrophobic tryptophan residues on other. Pink circles represent glutamate residues, which become blue on protonation as they insert into membrane. Green circles represent tryptophan residues, and yellow circle is cysteine residue (point of conjugation for NO2A chelator to enable 64Cu-labeling). (C) Example protonation of glutamate residues in acidic microenvironment. LPS = lipopolysaccharide.
PET and Ex Vivo Biodistribution
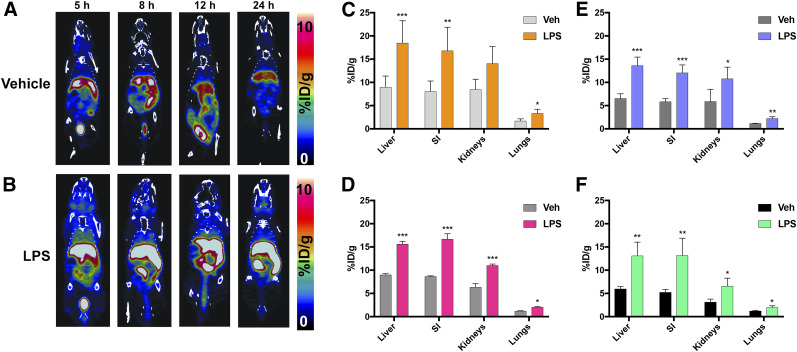
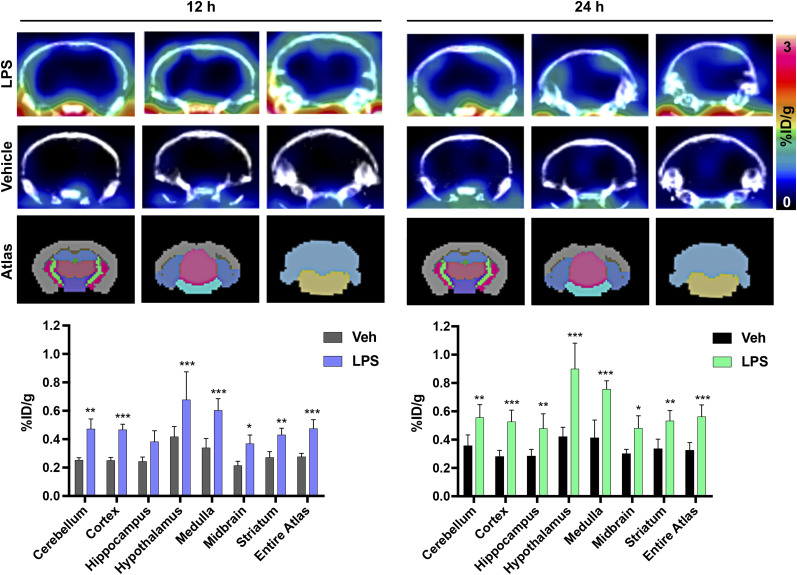
Serial PET images acquired over 24 h show a clear difference in peripheral [64Cu]Cu-c[E4W5C] uptake in vehicle- versus lipopolysaccharide-treated mice (Fig. 2) in tissues affected by acidosis. Less uptake and brain specificity were observed with [64Cu]Cu-[E5K]W5C than with [64Cu]Cu-c[E4W5C] PET (Supplemental Figs. 7 and 8; Supplemental Tables 2 and 3)—hence the rationale for moving forward with [64Cu]Cu-c[E4W5C] for all subsequent studies. CT-guided PET quantitation demonstrated significant increases in [64Cu]Cu-c[E4W5C] uptake in the kidneys, liver, lungs, and small intestine of lipopolysaccharide mice over 24 h (Fig. 2). Each of these tissues demonstrated significantly higher uptake of radiotracer in lipopolysaccharide mice at all time points except in kidneys at 4 h after lipopolysaccharide injection. Ex vivo biodistribution (for 12 and 24 h, Supplemental Table 3) supports the in vivo findings (n = 4/group). PET quantitation of selected regions is represented in Supplemental Table 4 (n = 4/group). Zoomed rescaled images showing uptake of [64Cu]Cu-c[E4W5C] in the brain are represented in Figure 3 for the 12- and 24-h time points and show significant uptake in lipopolysaccharide- versus vehicle-treated animals. Full PET quantification, additional time points, and coronal brain views can be found in Supplemental Figures 9–12. Supplemental Figure 13 represents the brain atlas legend for the inviCRO PET quantification.
FIGURE 2.
[64Cu]Cu-c[E4W5C] pHLIC detects presence of acidosis via serial PET imaging. PET images of vehicle-treated (A) vs. lipopolysaccharide-treated (B) mice and quantitation at 4 h (C), 8 h (D), 12 h (E), and 24 h (F) after lipopolysaccharide treatment. Data are average percentage injected dose per gram ± SD (n = 4 animals per group). %ID/g = percentage injected dose per gram; LPS = lipopolysaccharide; SI = small intestine; Veh = vehicle. *P < 0.05. **P < 0.01. ***P < 0.001. (Figure was prepared at Stanford.)
FIGURE 3.
Representative coronal brain PET/CT images of [64Cu]Cu-c[E4W5C] uptake and brain atlas–guided PET quantitation of vehicle vs. lipopolysaccharide-treated mice 12 and 24 h after tracer injection. Data are average percentage injected dose per gram ± SD (n = 4 animals per group). %ID/g = percentage injected dose per gram; LPS = lipopolysaccharide; Veh = vehicle. *P < 0.05. **P < 0.01. ***P < 0.001. (Figure was prepared at Stanford.)
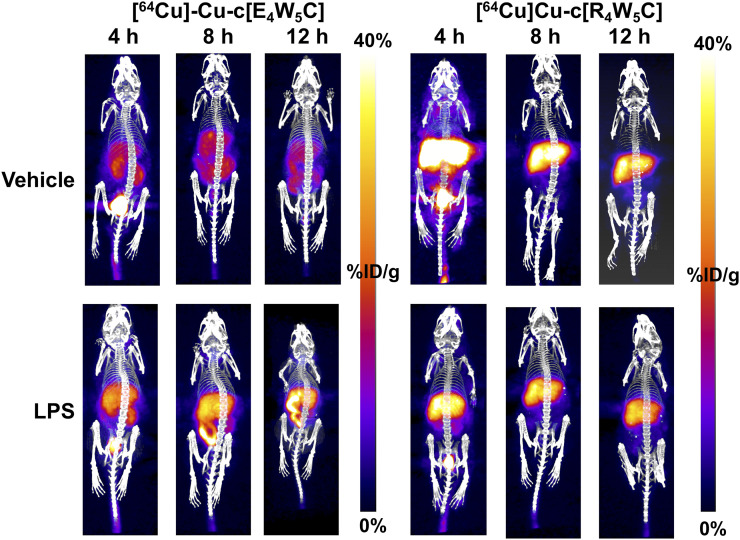
A statistically significant (P < 0.001–0.05) increase in [64Cu]Cu-c[E4W5C] uptake was observed in the brain of lipopolysaccharide-treated mice (vs. vehicle) in several regions, many of which have been reported to exhibit inflammation (cerebellum, cortex, hippocampus, hypothalamus, striatum, and midbrain) in this model (Fig. 3) (7,29–32). Full PET quantitation (of all brain regions) can be found in Supplemental Table 5 for all time points. A repeat cohort of [64Cu]Cu-c[E4W5C] was done in tandem with a negative control tracer [64Cu]Cu-c[R4W5C] to highlight the specificity of our pHLIC radiotracer for acidosis (Fig. 4). Full ex vivo quantification for these studies (brain and periphery) can be found in Supplemental Figures 14–18 and Supplemental Tables 6–8.
FIGURE 4.
Serial [64Cu]Cu-c[E4W5C] and [64Cu]Cu-c[R4W5C] (control) PET highlights specificity of pHLIC for acidosis in lipopolysaccharide-induced mice over 12 h. Data are average percentage injected dose per gram ± SD (n = 4 animals per group). LPS = lipopolysaccharide. (Figure was prepared at MSK.)
Autoradiography
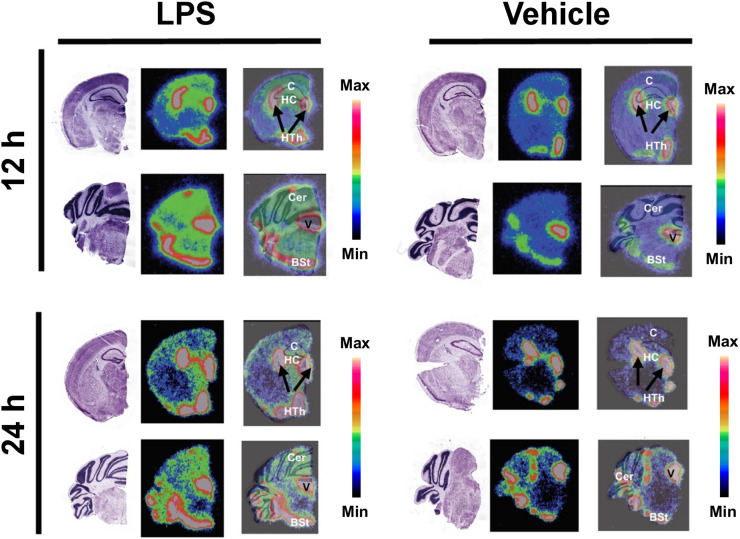
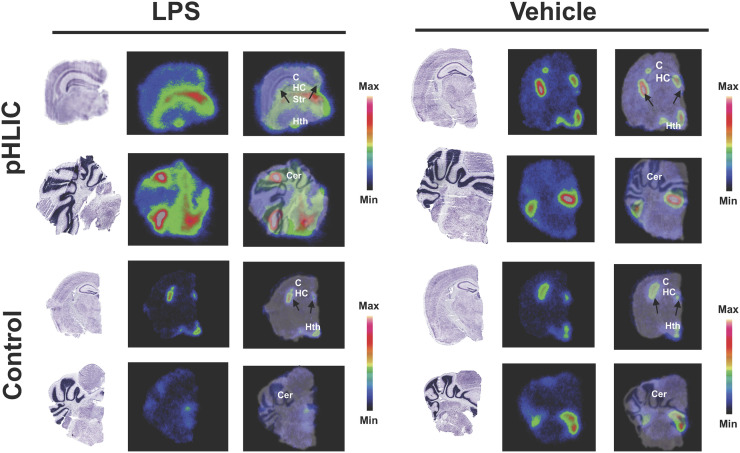
Qualitative autoradiography of brain slices confirmed increased uptake of the radiotracer in the cerebellum, cortex, hippocampus, and hypothalamus of lipopolysaccharide-treated mice (vs. vehicle) (Fig. 5). Many of these regions have been shown to be affected by neuroinflammation in this model (7,29). Marked signal was also observed in the choroid plexus and ventricles of both vehicle- and lipopolysaccharide-treated mice. In an additional cohort, we demonstrated significant uptake of [64Cu]Cu-c[E4W5C] versus negative control peptide [64Cu]Cu-c[R4W5C] in several of these same regions (Fig. 6).
FIGURE 5.
Autoradiography and Nissl staining enables high-resolution detection of [64Cu]Cu-c[E4W5C] uptake in brain slices. Data are for 3 animals per group. BSt = brain stem; C = cortex; Cer = cerebellum; HC = hippocampus; Hth = hypothalamus; LPS = lipopolysaccharide; V = ventricle. (Figure was prepared at Stanford.)
FIGURE 6.
Autoradiography verifies specificity of [64Cu]Cu-c[E4W5C] uptake (top) vs. [64Cu]Cu-c[R4W5C] control (bottom) in brain slices 24 h after lipopolysaccharide administration. Data are for 3 animals per group for vehicle and 2 per group for lipopolysaccharide. BSt = brain stem; C = cortex; Cer = cerebellum; HC = hippocampus; Hth = hypothalamus; LPS = lipopolysaccharide; Str = striatum. (Figure was prepared at MSK.)
Immunohistochemistry
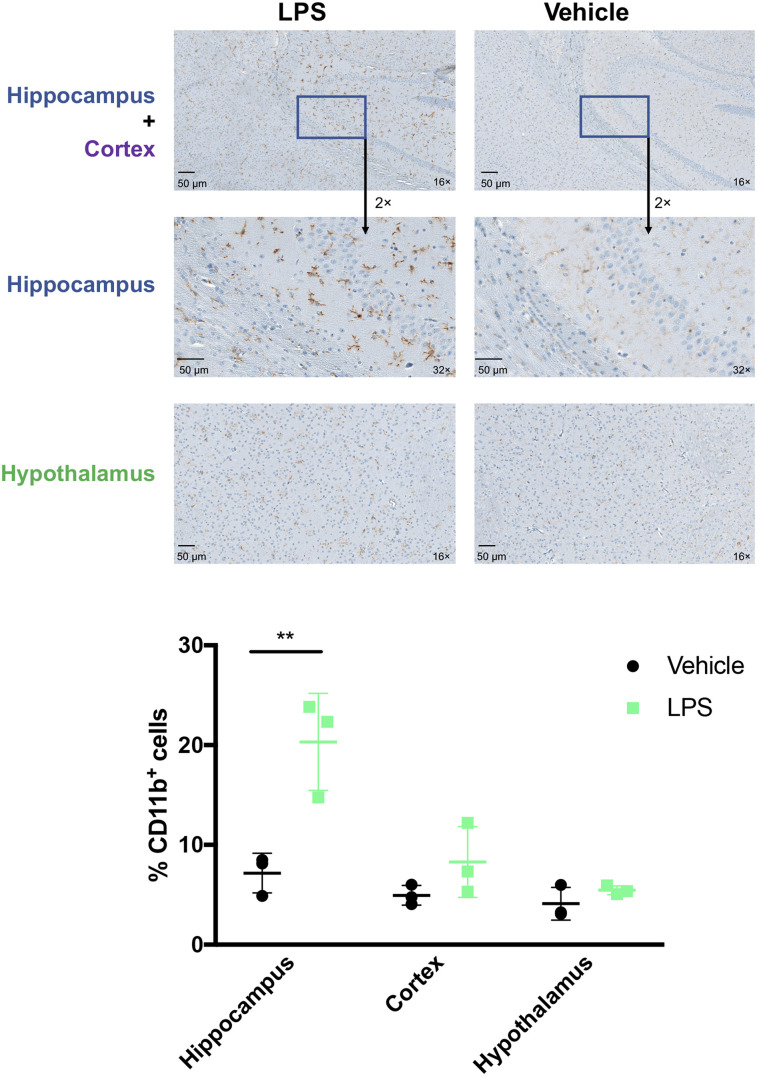
Brains immunostained for CD11b and TMEM119 24 h after lipopolysaccharide treatment showed increased macrophages or microglia. Significantly increased CD11b-positive cell numbers (coupled with a more ameboidlike morphology) in the hippocampus were observed in lipopolysaccharide-treated mice (vs. vehicle) (Fig. 7). A qualitative increase in macrophages or microglia was also observed in the hypothalamus and cortex. A subtle increase in TMEM119 represents increased innate immune infiltration that is specific to microglia (33) in the cortex and striatum (Supplemental Fig. 19). These data align with previous reports demonstrating increased neuroinflammation in the lipopolysaccharide model correlating to innate immune activation (5,34,35) and mirrors the increased uptake of [64Cu]Cu-c[E4W5C] observed via PET and autoradiography in lipopolysaccharide-treated mice.
FIGURE 7.
Immunohistochemical staining of CD11b identifies increased microglia or macrophages in select brain regions of lipopolysaccharide-treated compared with vehicle-treated mice. Data are %CD11b-positive cells ± SD (n = 3 animals per group). LPS = lipopolysaccharide. (Figure was prepared at MSK.)
DISCUSSION
We report the first investigation of a pH-sensitive PET tracer for tracking acidosis in a murine model of sepsis. We have shown the potential of this tool to shed light on the connection between acidosis and innate immune activation over the course of 24 h during the onset of sepsis. Such a radiotracer could enable disease tracking not only in sepsis but in other disorders that exhibit acidosis, including diabetes and stroke. Our study identified acid–base imbalances in the periphery and the brain by targeting the acidic microenvironment, a specific danger signal in sepsis, and explored the connection between acidosis and neuroinflammation.
Acidosis is currently poorly understood with regard to whole-body progression, specific regional involvement, and interventions (4,12). One approach being explored to assess the spatiotemporal dynamics of acidosis—chemical exchange saturation transfer MRI—is well described by Chen et al. (36). Chemical exchange saturation transfer MRI exploits a specific MR frequency to generate an image while combining the specificity of MR spectroscopy with the spatial resolution of MRI (37). Recently, chemical exchange saturation transfer MRI was combined with [18F]FDG PET to explore the relationship between acidosis and hyperglycolysis within the tumor microenvironment (38), and a correlation between low extracellular pH and glucose uptake was identified. We have observed a similar correlation with various pHLIP variants (unpublished data, August 2018). Additionally, several groups have paved the way for hyperpolarized MRI of metabolic acidosis, including for neuroinflammatory disorders (39,40). However, hyperpolarized MRI presents technical challenges for clinical translation due to its rapid signal decay. Our pH-sensitive PET agent uses a single dose to assess acidosis and obtain dynamic information on a system in constant flux with ultra-high sensitivity.
The most attractive application of the pHLIP and pHLIC imaging platforms is the ability to target highly dynamic changes in the acidic microenvironment without needing to wait for slower changes in expression of a specific receptor. The design of our radiotracer includes a single point of conjugation, which does not affect the properties of its pH-targeting capabilities (19) or ability to cross the BBB, the former further evidenced by our biophysical measurements (Supplemental Fig. 6). Once acidosis has gone beyond peripheral damage to affect the CNS, it poses a much more critical clinical situation (13); hence, early and spatiotemporal detection is crucial. Among the tested pHLIPs and pHLICs, c[E4W5C] showed the best BBB penetration and highest sensitivity for detecting disease-associated pH alterations and was therefore selected for detailed investigation. In this study, we exploited the sensitive, quantitative, and longitudinal characteristics of PET imaging to understand both spatial and temporal dynamics of acidosis.
The molecular mechanisms of how pH imbalance leads to cell damage are both diverse and complicated. Adversarial pH changes outside the physiologic norm can affect several biochemical systems, including cell development and degradation, energy metabolism, and neuronal function (e.g., metabolism of transmitter constituents) (12). Studies have reported the consequences of metabolic acidosis and how it affects tissues such as the liver, kidneys, and intestines (12,41). Acid-sensing ion channels are activated in the presence of inflammation, further perpetuating adverse immune responses, which can lead to significant neuroinflammation over the course of 24 h (7, 35). Peripheral uptake of pHLIC in regions associated with acidosis in the lipopolysaccharide mouse (e.g., lung, liver, kidneys, and small intestine) could be predictive of neuroinflammation, which we observed as early as 12 h. The utility of our pHLIC probe to detect not only systemic but also CNS inflammation makes this approach attractive for investigating pH alterations in a vast number of applications, including stroke. Importantly, multiple novel therapeutics in development aim to treat metabolic acidosis by targeting acid-sensing ion channels (42–45). We posit that our radiotracer might monitor response to such therapies to improve clinical outcomes for those with acidosis.
CONCLUSION
[64Cu]Cu-c[E4W5C] pHLIC is a valuable tool to noninvasively and longitudinally demarcate the spatiotemporal evolution of acidosis in lipopolysaccharide-induced sepsis. Moreover, [64Cu]Cu-c[E4W5C] has potential for broad application in other neuroinflammatory diseases. We expect that our pHLIC radiotracer will serve to increase understanding of the complex relationship between acidosis, immune function, and inflammation.
DISCLOSURE
Jason Lewis, Oleg Andreev, and Yana K. Reshetnyak are founders of pHLIP, Inc. They have shares in the company, but the company did not fund any part of the work reported here, which was done in their academic laboratories. Financial support was received from the Radiochemistry and Molecular Imaging Probe core (NIH grant P30 CA08748), the Center for Molecular Imaging and Nanotechnology (CMINT) the Tow Fellowship through MSK (Kelly Henry), NIH R35 CA232130-01A1 (Jason Lewis), NIH R01 GM073857-09A1 (Yana K. Reshetnyak and Oleg A. Andreev) for pHLIP technologies, the Chapman University School of Pharmacy for their core facility, and Saghar Mozaffari’s PhD fellowship. No other potential conflict of interest relevant to this article was reported.
KEY POINTS
QUESTION: The central hypothesis of this study is that our pHLIC peptide probe ([64Cu]Cu-c[E4W5C]) will successfully demarcate acidosis in a mouse model of sepsis in a manner that correlates with ex vivo brain uptake and microglial or macrophage activation.
PERTINENT FINDINGS: We demonstrate that a pH-sensitive PET tracer detects acidosis in regions associated with sepsis-driven proinflammatory responses. We observed significantly increased (P < 0.05) uptake of [64Cu]Cu-c[E4W5C] in the periphery and brain, which is mirrored by an increase in macrophage or microglial activation in these regions.
IMPLICATIONS FOR PATIENT CARE: [64Cu]Cu-pHLIC is a valuable tool to noninvasively assess acidosis associated with both central and peripheral innate immune activation and has potential to increase understanding of the dynamic relationship between acidosis and inflammation.
Supplementary Material
Acknowledgments
We gratefully acknowledge the Small Animal Imaging Core at MSK and Stanford University.
REFERENCES
- 1.Riemann A, Wußling H, Loppnow H, Fu H, Reime S, Thews O. Acidosis differently modulates the inflammatory program in monocytes and macrophages. Biochim Biophys Acta. 2016;1862:72–81. [DOI] [PubMed] [Google Scholar]
- 2.Erra Díaz F, Dantas E, Geffner J. Unravelling the interplay between extracellular acidosis and immune cells. Mediators Inflamm. 2018;2018:1218297. [DOI] [PMC free article] [PubMed] [Google Scholar]
- 3.Casimir GJ, Lefèvre N, Corazza F, Duchateau J, Chamekh M. The acid-base balance and gender in inflammation: a mini-review. Front Immunol. 2018;9:475. [DOI] [PMC free article] [PubMed] [Google Scholar]
- 4.Wiederseiner J-M, Muser J, Lutz T, Hulter HN, Krapf R. Acute metabolic acidosis: characterization and diagnosis of the disorder and the plasma potassium response. J Am Soc Nephrol. 2004;15:1589–1596. [DOI] [PubMed] [Google Scholar]
- 5.Tyrtyshnaia AA, Lysenko LV, Madamba F, Manzhulo IV, Khotimchenko MY, Kleschevnikov AM. Acute neuroinflammation provokes intracellular acidification in mouse hippocampus. J Neuroinflammation. 2016;13:283. [DOI] [PMC free article] [PubMed] [Google Scholar]
- 6.Rajamäki K, Nordström T, Nurmi K, et al. Extracellular acidosis is a novel danger signal alerting innate immunity via the NLRP3 inflammasome. J Biol Chem. 2013;288:13410–13419. [DOI] [PMC free article] [PubMed] [Google Scholar]
- 7.Hoogland ICM, Houbolt C, van Westerloo DJ, van Gool WA, van de Beek D. Systemic inflammation and microglial activation: systematic review of animal experiments. J Neuroinflammation. 2015;12:114. [DOI] [PMC free article] [PubMed] [Google Scholar]
- 8.Wiederseiner J-M, Muser J, Lutz T, Hulter HN, Krapf R. Acute metabolic acidosis: characterization and diagnosis of the disorder and the plasma potassium response. J Am Soc Nephrol. 2004;15:1589–1596. [DOI] [PubMed] [Google Scholar]
- 9.Singh V, Khatana S, Gupta P. Blood gas analysis for bedside diagnosis. Natl J Maxillofac Surg. 2013;4:136–141. [DOI] [PMC free article] [PubMed] [Google Scholar]
- 10.Sood P, Paul G, Puri S. Interpretation of arterial blood gas. Indian J Crit Care Med. 2010;14:57–64. [DOI] [PMC free article] [PubMed] [Google Scholar]
- 11.de Nadai TR, de Nadai MN, Albuquerque AAS, de Carvalho MTM, Celotto AC, Evora PRB. Metabolic acidosis treatment as part of a strategy to curb inflammation. Int J Inflam. 2013;2013:601424. [DOI] [PMC free article] [PubMed] [Google Scholar]
- 12.Kraut JA, Madias NE. Metabolic acidosis: pathophysiology, diagnosis and management. Nat Rev Nephrol. 2010;6:274–285. [DOI] [PubMed] [Google Scholar]
- 13.Rehncrona S. Brain acidosis. Ann Emerg Med. 1985;14:770–776. [DOI] [PubMed] [Google Scholar]
- 14.Wyatt LC, Lewis JS, Andreev OA, Reshetnyak YK, Engelman DM. Applications of pHLIP technology for cancer imaging and therapy. Trends Biotechnol. 2017;35:653–664. [DOI] [PMC free article] [PubMed] [Google Scholar]
- 15.Wyatt LC, Moshnikova A, Crawford T, Engelman DM, Andreev OA, Reshetnyak YK. Peptides of pHLIP family for targeted intracellular and extracellular delivery of cargo molecules to tumors. Proc Natl Acad Sci USA. 2018;115:E2811–E2818. [DOI] [PMC free article] [PubMed] [Google Scholar]
- 16.Demoin DW, Wyatt LC, Edwards KJ, et al. PET imaging of extracellular pH in tumors with 64Cu- and 18F-labeled pHLIP peptides: a structure–activity optimization study. Bioconjug Chem. 2016;27:2014–2023. [DOI] [PMC free article] [PubMed] [Google Scholar]
- 17.Roberts S, Strome A, Choi C, et al. Acid specific dark quencher QC1 pHLIP for multi-spectral optoacoustic diagnoses of breast cancer. Sci Rep. 2019;9:8550. [DOI] [PMC free article] [PubMed] [Google Scholar]
- 18.Katsara M, Tselios T, Deraos S, et al. Round and round we go: cyclic peptides in disease. Curr Med Chem. 2006;13:2221–2232. [DOI] [PubMed] [Google Scholar]
- 19.Weerakkody D, Moshnikova A, El-Sayed NS, et al. Novel pH-sensitive cyclic peptides. Sci Rep. 2016;6:31322. [DOI] [PMC free article] [PubMed] [Google Scholar]
- 20.Varatharaj A, Galea I. The blood-brain barrier in systemic inflammation. Brain Behav Immun. 2017;60:1–12. [DOI] [PubMed] [Google Scholar]
- 21.Gibot S, Buonsanti C, Massin F, et al. Modulation of the triggering receptor expressed on the myeloid cell type 1 pathway in murine septic shock. Infect Immun. 2006;74:2823–2830. [DOI] [PMC free article] [PubMed] [Google Scholar]
- 22.Allolio C, Magarkar A, Jurkiewicz P, et al. Arginine-rich cell-penetrating peptides induce membrane multilamellarity and subsequently enter via formation of a fusion pore. Proc Natl Acad Sci USA. 2018;115:11923–11928. [DOI] [PMC free article] [PubMed] [Google Scholar]
- 23.Waterhouse RN. Determination of lipophilicity and its use as a predictor of blood–brain barrier penetration of molecular imaging agents. Mol Imaging Biol. 2003;5:376–389. [DOI] [PubMed] [Google Scholar]
- 24.Wei L, Easmon J, Nagi RK, Muegge BD, Meyer LA, Lewis JS. 64Cu-azabicyclo[3.2.2]nonane thiosemicarbazone complexes: radiopharmaceuticals for PET of topoisomerase II expression in tumors. J Nucl Med. 2006;47:2034–2041. [PubMed] [Google Scholar]
- 25.Chaney AM, Johnson EM, Cropper HC, James ML. PET imaging of neuroinflammation using [11C]DPA-713 in a mouse model of ischemic stroke. JoVE. 2018(136):57243. [DOI] [PMC free article] [PubMed] [Google Scholar]
- 26.James ML, Shen B, Zavaleta CL, et al. New positron emission tomography (PET) radioligand for imaging σ-1 receptors in living subjects. J Med Chem. 2012;55:8272–8282. [DOI] [PMC free article] [PubMed] [Google Scholar]
- 27.James ML, Belichenko NP, Shuhendler AJ, et al. [18F]GE-180 PET detects reduced microglia activation after LM11A-31 therapy in a mouse model of Alzheimer’s disease. Theranostics. 2017;7:1422–1436. [DOI] [PMC free article] [PubMed] [Google Scholar]
- 28.Lively S, Schlichter LC. Microglia responses to pro-inflammatory stimuli (LPS, IFNγ+TNFα) and reprogramming by resolving cytokines (IL-4, IL-10). Front Cell Neurosci. 2018;12:215. [DOI] [PMC free article] [PubMed] [Google Scholar]
- 29.Furube E, Kawai S, Inagaki H, Takagi S, Miyata S. Brain region-dependent heterogeneity and dose-dependent difference in transient microglia population increase during lipopolysaccharide-induced inflammation. Sci Rep. 2018;8:2203. [DOI] [PMC free article] [PubMed] [Google Scholar]
- 30.Semmler A, Okulla T, Sastre M, Dumitrescu-Ozimek L, Heneka MT. Systemic inflammation induces apoptosis with variable vulnerability of different brain regions. J Chem Neuroanat. 2005;30:144–157. [DOI] [PubMed] [Google Scholar]
- 31.Okuyama S, Makihata N, Yoshimura M, et al. Oenothein B suppresses lipopolysaccharide (LPS)-induced inflammation in the mouse brain. Int J Mol Sci. 2013;14:9767–9778. [DOI] [PMC free article] [PubMed] [Google Scholar]
- 32.Skelly DT, Hennessy E, Dansereau MA, Cunningham C. A systematic analysis of the peripheral and CNS effects of systemic LPS, IL-1beta, TNF-alpha and IL-6 challenges in C57BL/6 mice. PLoS One. 2013;8:e69123–e69143. [DOI] [PMC free article] [PubMed] [Google Scholar]
- 33.Bennett ML, Bennett FC, Liddelow SA, et al. New tools for studying microglia in the mouse and human CNS. Proc Natl Acad Sci USA. 2016;113:E1738–E1746. [DOI] [PMC free article] [PubMed] [Google Scholar]
- 34.Zhang X, Dong H, Zhang S, Lu S, Sun J, Qian Y. Enhancement of LPS-induced microglial inflammation response via TLR4 under high glucose conditions. Cell Physiol Biochem. 2015;35:1571–1581. [DOI] [PubMed] [Google Scholar]
- 35.Catorce MN, Gevorkian G. LPS-induced murine neuroinflammation model: main features and suitability for pre-clinical assessment of nutraceuticals. Curr Neuropharmacol. 2016;14:155–164. [DOI] [PMC free article] [PubMed] [Google Scholar]
- 36.Chen LQ, Randtke EA, Jones KM, Moon BF, Howison CM, Pagel MD. Evaluations of tumor acidosis within in vivo tumor models using parametric maps generated with acido CEST MRI. Mol Imaging Biol. 2015;17:488–496. [DOI] [PMC free article] [PubMed] [Google Scholar]
- 37.Jones KM, Pollard AC, Pagel MD. Clinical applications of chemical exchange saturation transfer (CEST) MRI. J Magn Reson Imaging. 2018;47:11–27. [DOI] [PMC free article] [PubMed] [Google Scholar]
- 38.Longo DL, Bartoli A, Consolino L, et al. In vivo imaging of tumor metabolism and acidosis by combining PET and MRI-CEST pH imaging. Cancer Res. 2016;76:6463–6470. [DOI] [PubMed] [Google Scholar]
- 39.Gallagher FA, Kettunen MI, Brindle KM. Imaging pH with hyperpolarized 13C. NMR Biomed. 2011;24:1006–1015. [DOI] [PubMed] [Google Scholar]
- 40.Guglielmetti C, Najac C, Didonna A, Van der Linden A, Ronen SM, Chaumeil MM. Hyperpolarized 13C MR metabolic imaging can detect neuroinflammation in vivo in a multiple sclerosis murine model. Proc Natl Acad Sci USA. 2017;114:E6982–E6991. [DOI] [PMC free article] [PubMed] [Google Scholar]
- 41.Scheiner B, Lindner G, Reiberger T, et al. Acid-base disorders in liver disease. J Hepatol. 2017;67:1062–1073. [DOI] [PubMed] [Google Scholar]
- 42.Ortega-Ramírez A, Vega R, Soto E. Acid-sensing ion channels as potential therapeutic targets in neurodegeneration and neuroinflammation. Mediators Inflamm. 2017;2017:3728096. [DOI] [PMC free article] [PubMed] [Google Scholar]
- 43.Brown D, Melamed ML. New frontiers in treating uremic metabolic acidosis. Clin J Am Soc Nephrol. 2018;13:4–5. [DOI] [PMC free article] [PubMed] [Google Scholar]
- 44.Kraut JA, Raphael KL. Drug removal of gastric acid: a novel treatment of metabolic acidosis. Lancet. 2019;394:363–364. [DOI] [PubMed] [Google Scholar]
- 45.Zhou R-P, Wu X-S, Wang Z-S, Xie Y-Y, Ge J-F, Chen F-H. Novel insights into acid-sensing ion channels: implications for degenerative diseases. Aging Dis. 2015;7:491–501. [DOI] [PMC free article] [PubMed] [Google Scholar]
Associated Data
This section collects any data citations, data availability statements, or supplementary materials included in this article.


