

Abstract
Breast cancer stem cells (BCSCs) play a critical role in cancer recurrence and metastasis. Chemotherapy induces BCSC specification through increased expression of pluripotency factors, but how their expression is regulated is not fully understood. Here, we delineate a pathway controlled by hypoxia-inducible factor 1 (HIF-1) that epigenetically activates pluripotency factor gene transcription in response to chemotherapy. Paclitaxel induces HIF-1–dependent expression of S100A10, which forms a complex with ANXA2 that interacts with histone chaperone SPT6 and histone demethylase KDM6A. S100A10, ANXA2, SPT6, and KDM6A are recruited to OCT4 binding sites and KDM6A erases H3K27me3 chromatin marks, facilitating transcription of genes encoding the pluripotency factors NANOG, SOX2, and KLF4, which along with OCT4 are responsible for BCSC specification. Silencing of S100A10, ANXA2, SPT6, or KDM6A expression blocks chemotherapy-induced enrichment of BCSCs, impairs tumor initiation, and increases time to tumor recurrence after chemotherapy is discontinued. Pharmacological inhibition of KDM6A also impairs chemotherapy-induced BCSC enrichment. These results suggest that targeting HIF-1/S100A10–dependent and KDM6A-mediated epigenetic activation of pluripotency factor gene expression in combination with chemotherapy may block BCSC enrichment and improve clinical outcome.
Keywords: Oncology
Keywords: Breast cancer, Transcription, hypoxia

Introduction
Breast cancer is the most common cancer in women and a major public health problem, with an estimated 42,000 cancer-related deaths in the United States in 2020 (1). Cytotoxic chemotherapy, such as paclitaxel or carboplatin, is used in the treatment of selected early-stage and many advanced breast cancers, especially for patients with triple-negative breast cancer (TNBC), which lacks expression of the estrogen receptor (ER), progesterone receptor (PR), and human epidermal growth factor receptor 2 (HER2) (2). Although chemotherapy may reduce tumor burden initially, many TNBC patients have residual cancer cells that are subsequently responsible for recurrent and metastatic disease (3). Breast cancer stem cells (BCSCs), a subpopulation of cancer cells that have infinite proliferative potential and tumor-initiating properties, play a critical role in tumor recurrence and metastasis (4, 5). A growing body of literature indicates that BCSCs are enriched among cancer cells that survive chemotherapy, which may potentiate the risk of tumor recurrence and metastasis (6–9).
BCSCs share with embryonic stem cells (ESCs) the capacity for self-renewal (10, 11) and gene expression signatures first identified in ESCs have been found in BCSCs (12, 13). In ESCs, the transcription factors OCT4, NANOG, SOX2, and KLF4 are considered master regulators of self-renewal and pluripotency (14). These 4 factors activate the expression of other pluripotency-associated factors, repress lineage-specific genes, and activate their own gene expression and that of each other (14–16). Expression of these same pluripotency factors is also required for the specification and maintenance of BCSCs (17–19). Unlike ESCs, in which the regulation of pluripotency factor expression has been extensively investigated, the molecular mechanisms underlying regulation of pluripotency factors in BCSCs are still poorly understood.
The expression of pluripotency factors is regulated at the transcriptional level, and epigenetic regulation of chromatin structure is fundamental to the activation or repression of transcription (20, 21). Dynamic modification of chromatin architecture, termed chromatin remodeling, is required for the transcriptional machinery to access genomic DNA, and thereby controls gene expression (22). Chromatin remodeling is carried out by enzymes that covalently modify histone tails and by ATP-dependent chromatin remodeling complexes (23, 24). Histone modifications, such as acetylation and methylation, affect the binding affinity between histones and DNA, thereby loosening or tightening the wrapping of DNA around histones (25). Chromatin-remodeling complexes reposition nucleosomes along DNA and evict histones from DNA, thereby creating nucleosome-free regions of DNA for gene activation (26). How chromatin remodeling contributes to the expression of pluripotency factors and the BCSC phenotype, especially in the context of chemotherapy exposure, has not been studied.
We recently reported that hypoxia-inducible factor-1 (HIF-1), which plays a critical role in hypoxia- and chemotherapy-induced BCSC enrichment (9, 27, 28), regulates expression of the pluripotency factors NANOG and KLF4 at both the transcriptional and posttranscriptional levels through ERK inactivation and p38 MAPK activation, respectively (29, 30). HIF-1 also interacts with histone-modifying enzymes and chromatin-remodeling complexes (31–36). In the present study, we discovered that S100A10 expression is induced by chemotherapy in a HIF-1–dependent manner and triggers BCSC specification through epigenetic activation of pluripotency factor gene transcription. S100A10 forms a complex with annexin A2 and interacts with the histone chaperone SPT6, leading to recruitment of the histone demethylase KDM6A to OCT4 binding sites of genes encoding the pluripotency factors NANOG, SOX2, and KLF4. KDM6A erases inhibitory H3K27me3 chromatin marks, leading to transcriptional activation of pluripotency factor gene expression.
Results
Chemotherapy induces HIF-1–mediated S100A10 expression.
Several members of the S100 family have been reported to be associated with breast cancer progression and metastasis (37, 38). To investigate the response of S100 family members to chemotherapy, we first analyzed Gene Expression Omnibus (GEO) data set GSE50811, which contains transcriptome profiles of 27 breast cancer cell lines treated with vehicle or the chemotherapy drug paclitaxel (39), and found that S100A10 mRNA expression was significantly induced by paclitaxel in 24 out of 27 lines (Supplemental Figure 1; supplemental material available online with this article; https://doi.org/10.1172/JCI138577DS1). To confirm these results, we treated breast cancer cell lines MCF7 (ER+PR+), MDA-MB-231 (TNBC), SUM159 (TNBC), and HCC1954 (HER2+) with paclitaxel or carboplatin for 72 hours at the concentration that inhibited growth by 50% (IC50). Each of the drugs induced S100A10 expression at both the mRNA (Figure 1A) and protein (Figure 1B) levels in all 4 cell lines. We implanted MDA-MB-231 cells into the mammary fat pad (MFP) of female severe combined immunodeficiency (SCID) mice and when tumors grew to a volume of 200 mm3, commenced treatment with vehicle or 10 mg/kg paclitaxel every 5 days. Reverse transcription quantitative real-time PCR (RT-qPCR) and immunoblot assays revealed that both mRNA (Figure 1C) and protein (Figure 1, D and E) expression of S100A10 was significantly induced by paclitaxel treatment in vivo. In a genetically engineered, autochthonous breast cancer model, treatment of MMTV-PyMT–transgenic mice (which express polyoma virus middle T antigen from a mouse mammary tumor virus promoter) with 5 mg/kg paclitaxel also induced S100A10 mRNA expression in their breast tumors (Figure 1F).
Figure 1. Chemotherapy induces S100A10 expression in vitro and in vivo.

(A and B) Breast cancer cell lines were treated with vehicle (V), paclitaxel (P), or carboplatin (C) for 72 hours at IC50. RT-qPCR (A) and immunoblot (B) assays were performed to analyze S100A10 mRNA and protein expression. mRNA levels were normalized to vehicle-treated MCF7 cells (mean ± SEM; n = 3). *P < 0.05, ***P < 0.001 vs. vehicle in each cell line (1-way ANOVA with Bonferroni’s post hoc test). (C–E) MDA-MB-231 cells were implanted into the mammary fat pad (MFP) of female SCID mice. When tumor volume reached 200 mm3 (day 0), mice were randomly assigned to treatment with vehicle or paclitaxel (10 mg/kg on days 0, 5, and 10). Tumors were harvested on day 13 for RT-qPCR (C; mean ± SEM; n = 3) and immunoblot (D and E) assays. Densitometric analysis of immunoblots (D) was performed and results (E) are presented as mean ± SEM (n = 3). *P < 0.05 vs. vehicle (Student’s t test). (F) MMTV-PyMT–transgenic mice were treated with vehicle or paclitaxel (5 mg/kg on days 0, 5, and 10) when tumors reached a cumulative volume of 150 mm3. Tumors were harvested on day 13 for reverse transcription (RT) and qPCR assay (mean ± SEM; n = 4). *P < 0.05 vs. vehicle (Student’s t test).
Analysis of 1,247 human breast cancer specimens in The Cancer Genome Atlas (TCGA) database by Pearson’s test revealed a significant correlation (r = 0.54, P < 0.0001) of S100A10 mRNA levels with a HIF metagene signature consisting of 10 HIF-regulated mRNAs (ANGPTL4, LDHA, PGK1, CA9, CXCR3, L1CAM, BNIP3, PLOD1, P4HA1, and P4HA2) (Supplemental Figure 2A), suggesting that S100A10 expression is regulated by HIFs in human breast cancers. To examine whether chemotherapy induces S100A10 expression in a HIF-dependent manner, we used MDA-MB-231 and MCF7 cells that were stably transduced with an expression vector encoding a nontargeting control (NTC) short hairpin RNA (shRNA), or a vector encoding shRNA targeting HIF-1α, HIF-2α, or both HIF-1α and HIF-2α (double knockdown, DKD). HIF-1α knockdown or DKD, but not knockdown of HIF-2α alone, abrogated S100A10 induction mediated by paclitaxel or carboplatin at the mRNA (Figure 2A) and protein (Figure 2B and Supplemental Figure 2B) levels in both cell lines, indicating that S100A10 is induced in response to chemotherapy in a HIF-1α–dependent and HIF-2α–independent manner in breast cancer cell lines. Pharmacological inhibition of HIF-1α by digoxin (40) also blocked S100A10 mRNA induction in MDA-MB-231 and MCF7 cells exposed to paclitaxel or carboplatin (Figure 2C and Supplemental Figure 2C). Coadministration of digoxin also blocked paclitaxel- or carboplatin-induced S100A10 expression in tumors when SCID mice implanted with MDA-MB-231 cells were treated (Figure 2, D and E), providing evidence that chemotherapy induces S100A10 expression in a HIF-dependent manner in vivo.
Figure 2. Chemotherapy-induced S100A10 expression is HIF-1 dependent.

(A and B) MDA-MB-231 subclones were treated with vehicle (V), 10 nM paclitaxel (P), or 100 μM carboplatin (C) for 72 hours. RT-qPCR (A; mean ± SEM; n = 3; ***P < 0.001 vs. NTC-V; ###P < 0.001 vs. NTC-P or NTC-C; 2-way ANOVA with Bonferroni’s post hoc test) and immunoblot (B) assays were performed. (C) MDA-MB-231 cells were treated with V, P, or C, either alone or in combination with 100 nM digoxin (D) for 72 hours and RT-qPCR was performed (mean ± SEM; n = 3). **P < 0.01, ***P < 0.001 vs. V; ###P < 0.001 vs. P or C by 1-way ANOVA with Bonferroni’s post hoc test. (D) MDA-MB-231 cells were implanted into the MFP of SCID mice. When tumor volume reached 200 mm3 (day 0), mice were randomly assigned to treatment with V, P (10 mg/kg on days 0, 5, and 10), D (2 mg/kg on days 1–13), or P/D. Tumors were harvested on day 13 for RT-qPCR assay (mean ± SEM; n = 3); **P < 0.01 vs. V; #P < 0.05 vs. P (1-way ANOVA with Bonferroni’s post hoc test). (E) Tumor-bearing mice were randomly assigned to treatment with V, C (20 mg/kg on days 0, 5, 10), D (2 mg/kg on days 1–13), or C/D. Tumors were harvested on day 13 for RT-qPCR assay (mean ± SEM; n = 4); ***P < 0.001 vs. V; ###P < 0.001 vs. C (1-way ANOVA with Bonferroni’s post hoc test). (F–H) MDA-MB-231 cells were treated with V or 10 nM P for 72 hours (G), or exposed to 20% or 1% O2 for 16 hours (H), and chromatin immunoprecipitation (ChIP) was performed with the indicated antibody (Ab). Primers flanking the HIF binding site in the S100A10 gene (F) were used for qPCR (mean ± SEM; n = 3); ***P < 0.001 vs. corresponding V or 20% O2 (2-way ANOVA with Bonferroni’s post hoc test).
To investigate whether HIF-1 directly binds to the S100A10 gene and activates its transcription, we searched the S100A10 human genome sequence for matches to the consensus HIF-binding site sequence 5′-(A/G)CGTG-3′, and evaluated HIF binding by chromatin immunoprecipitation (ChIP) followed by qPCR using primers flanking candidate binding sites in MDA-MB-231 and MCF7 cells. A DNA sequence located in exon 1 of S100A10, 103 bp 3′ to the transcription start site (Figure 2F), was enriched by ChIP with antibodies against HIF-1α or HIF-1β (but not HIF-2α), when cells were exposed to paclitaxel (Figure 2G and Supplemental Figure 2D) or hypoxia (Figure 2H and Supplemental Figure 2E). Taken together, these data demonstrate that chemotherapy drugs induce HIF-1–dependent transactivation of S100A10.
S100A10 is required for chemotherapy-induced BCSC enrichment in vitro and in vivo.
Chemotherapy induces BCSC enrichment and HIF-1 plays a critical role in this process (9, 41). To examine whether S100A10, a downstream target of HIF-1, is involved in BCSC specification, we cultured MDA-MB-231 and MCF7 cells as mammospheres to enrich for BCSCs, and found that S100A10 mRNA (Figure 3A and Supplemental Figure 3A) and protein (Figure 3B and Supplemental Figure 3B) levels were significantly increased in nonadherent mammosphere cultures compared with monolayer cultures in both cell lines, suggesting a correlation between S100A10 expression and the BCSC phenotype.
Figure 3. S100A10 knockdown blocks chemotherapy-induced BCSC enrichment in vitro.

(A and B) MDA-MB-231 cells were cultured on standard polystyrene tissue culture plates (adherent) or ultra-low-adherence plates (sphere) for 7 days and harvested for analysis of S100A10 mRNA (A) and protein (B) expression. RNA results were normalized to adherent (mean ± SEM; n = 3); ***P < 0.001 (Student’s t test). (C and D) MDA-MB-231 subclones stably transfected with vector encoding nontargeting control shRNA (NTC) or either of 2 different shRNAs targeting S100A10 (#1 and #2) were treated with vehicle (V) or 10 nM paclitaxel (P) for 72 hours. The percentage of ALDH+ cells (C; mean ± SEM; n = 3) and the number of mammospheres formed per 1,000 cells seeded (D; mean ± SEM; n = 4) were determined; *P < 0.05, **P < 0.01, ***P < 0.001 vs. NTC-V; ###P < 0.001 vs. NTC-P (2-way ANOVA with Bonferroni’s post hoc test). (E and F) MDA-MB-231 subclones were treated with V or P for 72 hours. RT-qPCR (E; mean ± SEM; n = 3; *P < 0.05, **P < 0.01, ***P < 0.001 vs. NTC-V; ###P < 0.001 vs. NTC-P; 2-way ANOVA with Bonferroni’s post hoc test) and immunoblot (F) assays were performed.
To investigate the role of S100A10 in chemotherapy-induced BCSC enrichment, we generated shRNA-mediated S100A10-knockdown subclones of MDA-MB-231 and MCF7 cells, and treated NTC or knockdown subclones with paclitaxel for 72 hours. In NTC subclones, paclitaxel treatment markedly increased the percentage of cells with aldehyde dehydrogenase activity (ALDH+) (Figure 3C and Supplemental Figure 3C), and increased the number of cells with mammosphere-forming capacity (Figure 3D and Supplemental Figure 3, D–F), both of which are well-established measures of BCSCs (42, 43). S100A10 knockdown significantly inhibited paclitaxel-induced enrichment of ALDH+ cells (Figure 3C and Supplemental Figure 3C) and mammosphere-forming cells (Figure 3D and Supplemental Figure 3, D–F) in both cell lines, indicating that S100A10 expression is required for chemotherapy-induced BCSC enrichment.
The expression of pluripotency factors plays a critical role in the specification and maintenance of BCSCs (17–19, 29). We therefore examined the expression of pluripotency factors NANOG, SOX2, OCT4, and KLF4 in response to paclitaxel treatment in NTC and S100A10-knockdown subclones of MDA-MB-231 and MCF7 cells. Paclitaxel treatment induced the expression of NANOG, SOX2, and KLF4, which was blocked by S100A10 knockdown; in contrast, OCT4 expression was not affected by either paclitaxel treatment or S100A10 knockdown (Figure 3, E and F, and Supplemental Figure 3G).
To determine the role of S100A10 in the regulation of chemotherapy-induced BCSC enrichment in vivo, we injected 2 × 10⁶ MDA-MB-231 NTC or S100A10-knockdown subclone cells into the MFP of SCID mice and when tumor volume reached 200 mm3, the mice were treated with vehicle or 10 mg/kg paclitaxel every 5 days for 3 doses. Tumor volume was measured every 2 to 3 days and, 3 days after the last dose, tumors were harvested for ALDH, mammosphere, and immunoblot assays. S100A10 knockdown did not affect tumor growth rate (Figure 4A, gray vs. blue), but made tumors more sensitive to paclitaxel treatment (Figure 4A, yellow vs. orange), which was consistent with in vitro exposure (Supplemental Figure 4A). Paclitaxel increased the percentage of ALDH+ cells (Figure 4B), the number of mammosphere-forming cells (Figure 4C and Supplemental Figure 4B), and NANOG, SOX2, and KLF4 protein levels (Figure 4D and Supplemental Figure 4C), and all of these effects were attenuated by S100A10 knockdown (Figure 4, B–D, and Supplemental Figure 4, B and C).
Figure 4. S100A10 knockdown blocks paclitaxel-induced BCSC enrichment in vivo.

(A–D) Two million MDA-MB-231 NTC or S100A10-knockdown subclone cells were implanted into the MFP of SCID mice. When tumor volume reached 200 mm3 (day 0), mice were grouped randomly and treated with vehicle (V) or paclitaxel (P; 10 mg/kg, days 0, 5, and 10), and tumor volumes were measured every 2–3 days (A; **P < 0.01 vs. NTC-P, Student’s t test). Tumors were harvested on day 13 for ALDH (B), mammosphere (C), and immunoblot (D) assays. Data are shown as the mean ± SEM (n = 3); *P < 0.05, **P < 0.01 vs. NTC-V; #P < 0.05, ##P < 0.01 vs. NTC-P (2-way ANOVA with Bonferroni’s post hoc test). (E) MDA-MB-231 NTC or S100A10-knockdown cells were implanted into SCID mice. When tumors became palpable, mice were treated with paclitaxel every 5 days until tumors were no longer palpable. Kaplan-Meier survival curves of tumor-free (left), tumor-bearing (center), and recurrence-free (right) were plotted and P values of log-rank tests are shown. n = 6 for tumor formation and tumor eradication; n = 5 for tumor recurrence (1 mouse in each group did not achieve tumor eradication).
To determine the importance of S100A10 in the response of breast cancer cells to chemotherapy in vivo, we injected 2 × 10⁶ MDA-MB-231 NTC or S100A10-knockdown subclone cells into the MFP of SCID mice and, when tumors became palpable, treated the mice with 10 mg/kg paclitaxel every 5 days. Treatment was terminated when tumors were no longer palpable and the mice were then monitored for tumor recurrence. Knockdown of S100A10 did not alter the time to initial tumor formation, but significantly decreased the time to tumor eradication (Figure 4E), which is consistent with the observation that S100A10 knockdown did not affect cell proliferation (Supplemental Figure 4A) but increased sensitivity to paclitaxel treatment (Figure 4A). Most importantly, S100A10 knockdown markedly increased time to tumor recurrence (Figure 4E). Taken together, these data demonstrate that S100A10 expression is required for paclitaxel-induced expression of pluripotency factors, BCSC enrichment, and response to chemotherapy in vivo.
S100A10 interaction with ANXA2 is required for BCSC enrichment.
It has been reported that the majority of S100A10 within cells forms a heterotetrametric complex with annexin A2 (encoded by the ANXA2 gene) (44). We thus examined whether complex formation is required for chemotherapy-induced pluripotency factor expression and BCSC enrichment. We first confirmed the interaction of S100A10 with ANXA2 in MDA-MB-231 cells through reciprocal coimmunoprecipitation (co-IP) assays using whole cell lysates. Paclitaxel treatment, which increased S100A10 protein expression but did not affect ANXA2 protein expression, further increased this physical interaction (Figure 5A). We next generated 2 independent shRNA-mediated ANXA2-knockdown subclones of MDA-MB-231 (Figure 5B) and MCF7 (Supplemental Figure 5, A and B) cells. Similar to S100A10 knockdown, ANXA2 knockdown did not affect the proliferation rate of MDA-MB-231 cells, but made the cells more sensitive to paclitaxel treatment (Figure 5C). ANXA2 knockdown also phenocopied S100A10 knockdown in abrogating the paclitaxel-mediated increase in ALDH+ cells (Figure 5D and Supplemental Figure 5C), and in blocking the induction of pluripotency factors NANOG, SOX2, and KLF4, without affecting the constitutive expression of OCT4 (Figure 5E and Supplemental Figure 5D). A specific S100A10-ANXA2–complex inhibitor (45), 2-[4-(2-ethylphenyl)-5-o-tolyloxymethyl-4H-[1,2,4]triazol-3-ylsulfanyl]acetamide (Figure 5F), successfully blocked the paclitaxel-induced interaction between S100A10 and ANXA2 in MDA-MB-231 cells, without changing the expression of either protein (Figure 5G). Coadministration of S100A10-ANXA2 inhibitor significantly impaired paclitaxel-induced enrichment of ALDH+ cells (Figure 5H), confirming that S100A10-ANXA2 complex formation is required for induction of BCSC specification in response to chemotherapy.
Figure 5. Interaction with ANXA2 is required for S100A10-mediated BCSC enrichment.

(A) MDA-MB-231 cells were treated with vehicle (V) or paclitaxel (P) for 72 hours. Immunoprecipitation (IP) was performed using anti-ANXA2 (left panel) or anti-S100A10 (right panel) antibody followed by immunoblot assays. WCL, whole cell lysate. (B) MDA-MB-231 cells were transfected with vector encoding NTC or either of 2 shRNAs targeting ANXA2 (#1 and #2) and immunoblot assays were performed. (C–E) MDA-MB-231 subclones were treated with V or P for 72 hours, numbers of live cells were counted (C) (mean ± SEM; n = 6), and ALDH (D) and RT-qPCR (E) assays were performed (mean ± SEM; n = 3); *P < 0.05, **P < 0.01, ***P < 0.001 vs. NTC-V; #P < 0.05, ##P < 0.01, ###P < 0.001 vs. NTC-P (2-way ANOVA with Bonferroni’s post hoc test). (F) Chemical structure of S100A10-ANXA2 complex (SAC) inhibitor. (G and H) MDA-MB-231 cells were treated with 10 nM paclitaxel, 25 μM SAC inhibitor, or both for 72 hours. IP was performed using anti-S100A10 Ab followed by immunoblot assays (G), and the percentage of ALDH+ cells was determined (H) (mean ± SEM; n = 3); ***P < 0.001 vs. vehicle-treated; ###P < 0.001 vs. paclitaxel-treated (2-way ANOVA with Bonferroni’s post hoc test).
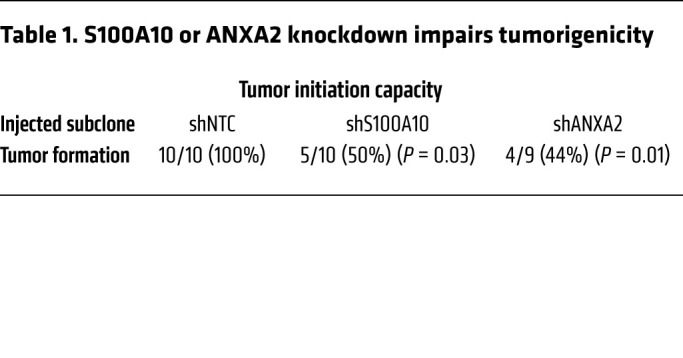
To investigate the role of S100A10 and ANXA2 in regulating the tumorigenic capacity of breast cancer cells in vivo, we injected only 1000 MDA-MB-231 NTC, S100A10-, or ANXA2-knockdown cells into the MFP of SCID mice, such that BCSCs would be limiting for tumor initiation. NTC subclone cells formed tumors in 10 out of 10 mice by 55 days after injection, whereas S100A10- and ANXA2-knockdown subclones showed significantly decreased tumor-initiating capacity, with tumors forming in only 5 out of 10 and 4 out of 9 mice, respectively (Table 1). Taken together, these data demonstrate that S100A10 regulates the BCSC phenotype through interaction with ANXA2 in vitro and in vivo.
Table 1. S100A10 or ANXA2 knockdown impairs tumorigenicity.
The S100A10-ANXA2 complex recruits SPT6 to pluripotency factor genes.
S100A10 was previously reported to localize primarily in the cytosol, where it was reported to function as a scaffold protein (46). We prepared cytosolic and nuclear fractions from MDA-MB-231 and MCF7 cells, and confirmed their purity using α-tubulin and histone H3 as controls, respectively, but we were surprised to find that S100A10 protein was only detected in the nuclear lysates (Figure 6A and Supplemental Figure 6A). Thus, we undertook a search for nuclear binding partners for the S100A10-ANXA2 complex. The histone chaperone protein SPT6 was previously identified as an interacting protein in S100A10-overexpressing HEK293 cells (47). We performed a co-IP assay with an antibody against S100A10, using MDA-MB-231 nuclear lysates, and demonstrated that SPT6 interacted with S100A10 (Figure 6B). Paclitaxel treatment further increased this physical interaction, without altering total SPT6 protein levels (Figure 6B). The interaction of S100A10 with SPT6 in the nucleus was further confirmed by the inverse co-IP using an antibody against SPT6 (Figure 6B). We then generated 2 independent shRNA-mediated SPT6-knockdown subclones of MDA-MB-231 and MCF7 cells (Figure 6, C and D, and Supplemental Figure 6, B and C). SPT6 knockdown did not affect proliferation of these cells (Figure 6E and Supplemental Figure 6D), but abrogated paclitaxel-induced enrichment of ALDH+ cells (Figure 6F) and NANOG, SOX2, and KLF4, but not OCT4, expression (Figure 6G and Supplemental Figure 6E), which phenocopied knockdown of S100A10 or ANXA2.
Figure 6. SPT6 interacts with the S100A10-ANXA2 complex.

(A) MDA-MB-231 cells were treated with vehicle (V) or paclitaxel (P). Cytosolic and nuclear lysates were prepared, and immunoblot assays were performed. (B) MDA-MB-231 cells were treated with V or P. IP was performed using anti-S100A10 (left) or anti-SPT6 (right) Ab followed by immunoblot assays. NL, nuclear protein lysate. (C–E) MDA-MB-231 cells were transfected with vector encoding NTC or either of 2 shRNAs targeting SPT6 (#1 and #2), and RT-qPCR (C; mean ± SEM, n = 3; ***P < 0.001 vs. NTC; 1-way ANOVA with Bonferroni’s post hoc test), immunoblot (D), and cell proliferation (E; mean ± SEM, n = 6; 1-way ANOVA) assays were performed. (F and G) MDA-MB-231 subclones were treated with V or P. ALDH+ cells (F) and mRNA expression (G) were quantified (mean ± SEM; n = 3); *P < 0.05, **P < 0.01, ***P < 0.001 vs. NTC-V; ##P < 0.01, ###P < 0.001 vs. NTC-P (2-way ANOVA with Bonferroni’s post hoc test).
Because pluripotency factors are the major transcriptional regulators of themselves as well as other pluripotency factors, we hypothesized that in response to chemotherapy, S100A10-ANXA2 and SPT6 promote binding of one or multiple pluripotency factors to the regulatory regions of the NANOG, SOX2, and KLF4 genes, leading to their increased transcription. To test this hypothesis, we performed co-IP using an antibody against SPT6 and found that SPT6 interacted strongly with OCT4, but not with NANOG (Figure 6B).
Next, we performed ChIP assays in MDA-MB-231 cells and demonstrated OCT4 binding to the NANOG, SOX2, KLF4, and POU5F1 (encoding OCT4) genes (Figure 7A). Paclitaxel treatment increased OCT4 binding to the NANOG, SOX2, and KLF4 genes, which was blocked by knockdown of S100A10, ANXA2, or SPT6 (Figure 7B). OCT4 binding to the POU5F1 gene was not affected by paclitaxel treatment or by S100A10, ANXA2, or SPT6 knockdown (Figure 7B). HIF-1α knockdown, which blocked paclitaxel-induced S100A10 expression (Figure 2B and Figure 8A), phenocopied S100A10 knockdown in blocking paclitaxel-induced OCT4 binding to the NANOG, SOX2, and KLF4 genes (Figure 8B) without affecting OCT4 binding to the POU5F1 gene (Figure 8B). HIF-1α knockdown blocked paclitaxel-induced NANOG, SOX2, and KLF4 protein expression, but did not affect OCT4 expression, in MDA-MB-231 cells (Figure 8A).
Figure 7. S100A10-ANXA2-SPT6 complex promotes OCT4 binding.

(A) MDA-MB-231 cells were treated with vehicle (V) or paclitaxel (P) and ChIP-qPCR assays were performed using control IgG or OCT4 Ab and primers flanking OCT4 binding sites in the NANOG, SOX2, KLF4, and POU5F1 genes (mean ± SEM; n = 3); ***P < 0.001 vs. V-OCT4 (2-way ANOVA with Bonferroni’s post hoc test). Nucleotide sequences encompassing the OCT4 binding site (red) of each gene are shown. (B) MDA-MB-231 subclones were treated with V or P, and ChIP-qPCR assays were performed using OCT4 Ab and primers flanking OCT4 binding sites in the indicated genes (mean ± SEM; n = 3); *P < 0.05, **P < 0.01, ***P < 0.001 vs. NTC-V; #P < 0.05, ##P < 0.01 vs. NTC-P (2-way ANOVA with Bonferroni’s post hoc test).
Figure 8. HIF-1α knockdown blocks OCT4 binding to pluripotency factor genes.

(A) MDA-MB-231 subclones transfected with NTC or HIF-1α shRNA vector were treated with vehicle (V) or paclitaxel (P) and immunoblot assays were performed. (B) MDA-MB-231 subclones were treated with V or P, and ChIP-qPCR assays were performed using OCT4 Ab and primers flanking OCT4 binding sites in the indicated genes (mean ± SEM; n = 3); ***P < 0.001 vs. NTC-V; ###P < 0.001 vs. NTC-P (2-way ANOVA with Bonferroni’s post hoc test).
To further confirm that S100A10-ANXA2 and SPT6 interact with OCT4 at its binding sites on the NANOG, SOX2, and KLF4 genes, we performed ChIP assays in MDA-MB-231 cells using antibodies against S100A10 and SPT6 followed by qPCR with primers flanking the OCT4 binding sites of the pluripotency factor genes. Paclitaxel treatment induced binding of both S100A10 and SPT6 to OCT4 binding sites of the NANOG, SOX2, and KLF4 genes, which was blocked by knockdown of S100A10, ANXA2, or SPT6 (Figure 9, A and B). Interestingly, knockdown of SPT6 completely abrogated S100A10 occupancy of the OCT4 binding site of the NANOG, SOX2, and KLF4 genes (Figure 9A), whereas knockdown of S100A10 or ANXA2 only partially blocked SPT6 binding to these sites (Figure 9B), suggesting a more direct interaction of SPT6 with OCT4. Taken together, these data demonstrate that the S100A10-ANXA2 complex interacts with SPT6, and S100A10-ANXA2 and SPT6 promote OCT4 binding to the NANOG, SOX2, and KLF4 genes, leading to their transcriptional activation.
Figure 9. S100A10 and SPT6 occupy OCT4 binding sites of pluripotency factor genes.

(A and B) MDA-MB-231 subclones transfected with NTC, or shRNA vector targeting S100A10, ANXA2, or SPT6, were treated with vehicle (V) or paclitaxel (P), and ChIP-qPCR assays were performed using S100A10 (A) or SPT6 (B) Ab and primers flanking OCT4 binding sites in the indicated genes (mean ± SEM; n = 3); *P < 0.05, **P < 0.01, ***P < 0.001 vs. NTC-V; #P < 0.05, ##P < 0.01, ###P < 0.001 vs. NTC-P (2-way ANOVA with Bonferroni’s post hoc test).
S100A10-ANXA2 and SPT6 recruit KDM6A to pluripotency factor genes.
We next investigated the mechanism through which S100A10-ANXA2 and SPT6 regulate OCT4 binding to the NANOG, SOX2, and KLF4 genes. SPT6 has been reported to negatively regulate trimethylation of histone H3 at Lys-27 (H3K27me3) (48), a marker of epigenetically repressed genes (49). We hypothesized that chemotherapy-induced S100A10-ANXA2-SPT6 interaction promotes NANOG, SOX2, and KLF4 gene transcription by decreasing H3K27me3 chromatin marks. To test this hypothesis, we first examined global H3K27me3 levels in MDA-MB-231 cells and found that paclitaxel treatment or knockdown of S100A10, ANXA2, or SPT6 failed to alter global H3K27me3 or total histone H3 levels (Figure 10A). In contrast, paclitaxel treatment significantly decreased H3K27me3 marks at the OCT4 binding sites of the NANOG, SOX2, and KLF4 genes, without affecting total histone H3 occupancy at these sites (Figure 10B). Conversely, knockdown of S100A10, ANXA2, or SPT6 increased H3K27me3 levels at OCT4 binding sites on these genes, without or with paclitaxel treatment, but did not affect total histone H3 occupancy at these sites (Figure 10B). H3K27me3 levels at the OCT4 binding site of the POU5F1 gene were not altered by paclitaxel treatment or knockdown of S100A10, ANXA2, or SPT6 (Figure 10B). HIF-1α knockdown also increased H3K27me3 marks at the OCT4 binding sites of the NANOG, SOX2, and KLF4, but not POU5F1, genes, without affecting total histone H3 occupancy at these sites (Figure 10C). These data indicate that HIF-1–regulated S100A10-ANXA2-SPT6 interaction contributes to decreased H3K27me3 modification at specific OCT4 binding sites of pluripotency factor genes in response to chemotherapy.
Figure 10. S100A10-ANXA2-SPT6 decreases H3K27me3 chromatin marks.

(A) MDA-MB-231 subclones were treated with vehicle (V) or paclitaxel (P), and immunoblot assays were performed. (B and C) MDA-MB-231 subclones were treated with V or P, and ChIP assays were performed using H3K27me3 or H3 Ab and primers flanking OCT4 binding sites in the indicated genes (mean ± SEM; n = 3); *P < 0.05, **P < 0.01 vs. NTC-V; #P < 0.05, ##P < 0.01, ###P < 0.001 vs. NTC-P (2-way ANOVA with Bonferroni’s post hoc test).
To delineate the mechanism by which SPT6 regulates H3K27me3 modification at OCT4 binding sites on the NANOG, SOX2, and KLF4 genes, we searched for an H3K27me3 histone demethylase that interacts with SPT6. We performed a co-IP assay using nuclear protein lysates from MDA-MB-231 cells with an antibody against SPT6 and found that KDM6A (also known as UTX), but not KDM6B (also known as JMJD3), interacted with SPT6 (Figure 11A). The interaction of SPT6 with KDM6A was confirmed by inverse co-IP with an antibody against KDM6A (Figure 11A). Although the interaction of endogenous SPT6 and KDM6A detected by co-IP was weak, ChIP-qPCR assays showed that KDM6A protein occupied OCT4 binding sites on the NANOG, SOX2, and KLF4 genes, and that the binding was induced by paclitaxel treatment in an S100A10-, ANXA2-, and SPT6-dependent manner (Figure 11B), which support the same conclusion that the histone demethylase KDM6A interacts with S100A10-ANXA2-SPT6 at OCT4 binding sites of the NANOG, SOX2, and KLF4 genes in paclitaxel-treated breast cancer cells.
Figure 11. KDM6A interacts with SPT6 and occupies OCT4 binding sites of pluripotency factor genes.

(A) MDA-MB-231 cells were treated with vehicle (V) or paclitaxel (P). Nuclear lysates (NL) were prepared and IP assays were performed followed by immunoblot assays. (B) MDA-MB-231 subclones were treated with V or P and ChIP-qPCR assays were performed using KDM6A Ab and primers flanking OCT4 binding sites in the indicated genes (mean ± SEM; n = 3); *P < 0.05, **P < 0.01, ***P < 0.001 vs. NTC-V; #P < 0.05, ##P < 0.01, ###P < 0.001 vs. NTC-P (2-way ANOVA with Bonferroni’s post hoc test).
To determine whether KDM6A recruitment to OCT4 binding sites on the NANOG, SOX2, and KLF4 genes erases H3K27me3 marks at these sites and promotes transcription, we generated 2 independent KDM6A-knockdown subclones in MDA-MB-231 cells (Figure 12A). KDM6A knockdown dramatically increased basal H3K27me3 marks at OCT4 binding sites of all 4 pluripotency factor genes, and abrogated the paclitaxel-induced decrease in H3K27me3 at OCT4 binding sites of the NANOG, SOX2, and KLF4 genes (Figure 12D), but did not change global H3K27me3 modification (Figure 12C). KDM6A knockdown in MDA-MB-231 (Figure 12A) and MCF7 (Supplemental Figure 7, A and B) cells also blocked paclitaxel-induced enrichment of ALDH+ (Figure 12E and Supplemental Figure 7D) and mammosphere-forming (Figure 12F) cells, and abrogated paclitaxel-induced NANOG, SOX2, and KLF4 mRNA expression (Figure 12G and Supplemental Figure 7E), without affecting proliferation of these cells (Figure 12B and Supplemental Figure 7C).
Figure 12. KDM6A erases H3K27me3 chromatin marks at OCT4 binding sites of pluripotency factor genes.

(A and B) MDA-MB-231 cells were transfected with vector encoding NTC or KDM6A shRNA (#1 and #2), and immunoblot (A) and cell proliferation (B; mean ± SEM; n = 6; 1-way ANOVA) assays were performed. (C) MDA-MB-231 subclones were treated with vehicle (V) or paclitaxel (P) and immunoblot assays were performed. (D) MDA-MB-231 subclones were treated with V or P, and ChIP-qPCR assays were performed using H3K27me3 or H3 Ab and primers flanking OCT4 binding sites in the indicated genes (mean ± SEM; n = 3); *P < 0.05, **P < 0.01, ***P < 0.001 vs. NTC-V; ##P < 0.01, ###P < 0.001 vs. NTC-P (2-way ANOVA with Bonferroni’s post hoc test). (E–G) MDA-MB-231 subclones were treated with V or P. ALDH+ cells (E), mammospheres (F), and mRNA expression (G) were quantified (mean ± SEM; n = 3); *P < 0.05, **P < 0.01, ***P < 0.001 vs. NTC-V; #P < 0.05, ##P < 0.01, ###P < 0.001 vs. NTC-P (2-way ANOVA with Bonferroni’s post hoc test).
To confirm the role of KDM6A in the regulation of BCSCs in vivo, we performed a tumorigenicity assay by injecting 1000 MDA-MB-231 NTC or KDM6A-knockdown cells into the MFP of SCID mice, and found significantly decreased tumor-initiating capacity in KDM6A-knockdown subclones, with tumors forming in only 3 out of 10 mice (Table 2). KDM6A knockdown also markedly inhibited tumor relapse, as measured by the increased time to tumor recurrence compared with the NTC group, without affecting the time to initial tumor formation or time to tumor eradication (Figure 13). Thus, both S100A10-ANXA2-SPT6 and KDM6A are required for tumor initiation and time to tumor recurrence, which are 2 features that are closely associated with BCSCs.
Table 2. KDM6A knockdown impairs tumorigenicity.
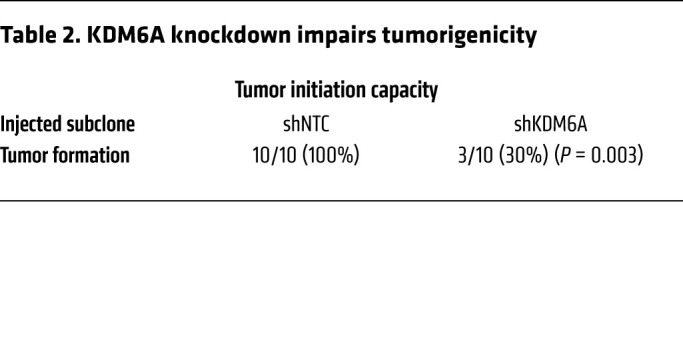
Figure 13. KDM6A knockdown delays tumor recurrence.

Two million MDA-MB-231 NTC or KDM6A-knockdown subclone cells were implanted into SCID mice. When tumors were palpable, mice were treated with paclitaxel every 5 days until tumors were no longer palpable. Kaplan-Meier survival curves of tumor-free (left), tumor-bearing (center), and recurrence-free (right) were plotted and P values of log-rank tests are shown (n = 6).
KDM6A inhibitor blocks pluripotency factor expression and BCSC enrichment.
Pharmacological inhibition of KDM6A demethylase activity by GSK-J4 [(ethyl 3-((6-(4,5-dihydro-1H-benzo[d]azepin- 3(2H)-yl)-2-(pyridin-2-yl)pyrimidin-4-yl)amino)propanoate] (50) in MDA-MB-231 cells increased global H3K27me3 modification at 5 μM (Figure 14A) and blocked paclitaxel-induced enrichment of ALDH+ cells (Figure 14B) and expression of pluripotency factors (Figure 14C). Treatment with GSK-J4 also increased H3K27me3 chromatin marks at OCT4 binding sites, without affecting total histone H3 binding at these sites (Figure 14D), which was consistent with the observed effects of KDM6A knockdown (Figure 12). In contrast, pharmacological inhibition of histone methyltransferase EZH2 (an H3K27me3 writer) by its specific inhibitor EPZ-6438 decreased global H3K27me3 marks (Supplemental Figure 8A), but had no effect on H3K27me3 modification specifically at OCT4 binding sites of pluripotency factor genes (Supplemental Figure 8B) and did not affect paclitaxel-induced enrichment of ALDH+ cells (Supplemental Figure 8C) or expression of pluripotency factors (Supplemental Figure 8D).
Figure 14. Pharmacological inhibition of KDM6A blocks paclitaxel-induced pluripotency factor expression and BCSC enrichment.

(A–C) MDA-MB-231 cells were treated with vehicle (V) or paclitaxel (P), in combination with 0, 1, or 5 μM GSK-J4 for 72 hours. Immunoblot (A) and RT-qPCR (C) assays were performed, and ALDH+ cells were determined (B) (mean ± SEM; n = 3); *P < 0.05, **P < 0.01, ***P < 0.001 vs. V and GSK-J4 0 μM; #P < 0.05, ##P < 0.01, ###P < 0.001 vs. P and GSK-J4 0 μM (2-way ANOVA with Bonferroni’s post hoc test). (D) MDA-MB-231 cells were treated with V or P, in combination with 0 or 5 μM GSK-J4, and ChIP-qPCR assays were performed using H3K27me3 or H3 Ab and primers flanking OCT4 binding sites in the indicated genes (mean ± SEM; n = 3); **P < 0.01, ***P < 0.001 vs. V and GSK-J4 0 μM; #P < 0.05, ##P < 0.01, ###P < 0.001 vs. P and GSK-J4 0 μM (2-way ANOVA with Bonferroni’s post hoc test).
To investigate the effect of KDM6A inhibitor in combination with chemotherapy in vivo, we injected 2 × 10⁶ MDA-MB-231 cells into the MFP of SCID mice and treated the mice with vehicle, paclitaxel (10 mg/kg on days 0, 5, and 10), GSK-J4 (10 mg/kg on days 0–13), or the combination of paclitaxel and GSK-J4, starting when the tumor volume reached 200 mm3. GSK-J4 treatment did not affect primary tumor growth (Figure 15A), but significantly blocked induction of ALDH+ cells (Figure 15B) and pluripotency factor expression (Figure 15C). Treatment with GSK-J4 also increased global as well as local H3K27me3 chromatin marks at the OCT4 binding sites of pluripotency factor genes (Figure 15D and Supplemental Figure 9, A and B) and blocked paclitaxel-induced OCT4 binding to these genes (Figure 15E). Taken together, these data demonstrate that pharmacological inhibition of KDM6A by GSK-J4 blocks paclitaxel-induced pluripotency factor expression and BCSC enrichment in vitro and in vivo.
Figure 15. GSK-J4 blocks paclitaxel-induced BCSC enrichment in vivo.

(A–E) MDA-MB-231 cells were implanted into SCID mice. When tumor volume reached 200 mm3 (day 0), mice were treated with vehicle (V), paclitaxel (P; 10 mg/kg, days 0, 5, and 10), GSK-J4 (10 mg/kg, days 0–13), or P + GSK-J4. Tumor volumes were measured every 2 to 3 days (A). Tumors were harvested on day 13 for ALDH (B), RT-qPCR (C), and ChIP (D and E) assays. Data are shown as the mean ± SEM (n = 4); *P < 0.05, **P < 0.01, ***P < 0.001 vs. V; #P < 0.05, ##P < 0.01, ###P < 0.001 vs. P (1-way ANOVA with Bonferroni’s post hoc test).
S100A10 expression is associated with adverse outcome in breast cancer patients.
To determine the clinical relevance of S100A10 expression with regard to treatment outcomes in breast cancer, we analyzed TCGA breast invasive carcinoma data set and found that S100A10 mRNA expression was significantly increased in invasive ductal breast carcinoma and invasive lobular breast carcinoma, the 2 major forms of breast cancer, compared with adjacent normal breast tissues (Figure 16A). We also interrogated microarray data from 3,951 breast cancer specimens for the expression of S100A10 mRNA. Survival data were analyzed by stratifying patients according to S100A10 expression and Kaplan-Meier plots revealed that S100A10 mRNA levels greater than the median were associated with decreased relapse-free survival in the cohort of all breast cancer patients and in the cohort of breast cancer patients that received chemotherapy (Figure 16B). To investigate the involvement of S100A10 in the specification of BCSCs in primary breast cancer, we analyzed the correlation of S100A10 mRNA levels with a 20-gene BCSC signature (51) from 1,247 human breast cancers in TCGA database, and found that S100A10 mRNA levels were strongly correlated with the BCSC signature (Figure 16C). Analyses of GEO data sets also revealed that breast cancer patients that had cancer recurrence within 1, 3, or 5 years, or patients that developed metastasis within 3 or 5 years, had higher S100A10 expression in their primary tumor compared with those who did not have recurrence or metastasis at the same time point (Figure 16, D and E). Taken together, these data indicate that S100A10 expression is associated with the BCSC phenotype, tumor recurrence, metastasis, chemoresistance, and adverse clinical outcome in breast cancer patients.
Figure 16. S100A10 is associated with poor clinical outcome in breast cancer patients.

(A) S100A10 mRNA levels in normal breast tissue (n = 111), invasive ductal breast carcinoma (BC) (n = 641), and invasive lobular BC (n = 71) were accessed from TCGA database and compared; ***P < 0.001 vs. normal (1-way ANOVA with Bonferroni’s post hoc test). (B) Kaplan-Meier analyses of relapse-free survival were performed based on clinical and molecular data from 3,951 breast cancer patients (cohort: All, left) or from a subgroup of 798 breast cancer patients who received chemotherapy (right). The patients were stratified by S100A10 mRNA levels in the primary tumor, which were greater (red) or less (black) than the median level. The hazard ratio (HR) and P value (log-rank test) are shown. (C) Levels of S100A10 mRNA and a BCSC signature composed of transcripts of 20 genes in primary breast cancer samples were accessed from TCGA database, and the correlation was analyzed by Pearson’s test. (D and E) Clinical and molecular data from 3 data sets were accessed from GEO. S100A10 mRNA levels in the primary breast cancer from patients who had recurrence (D) or metastasis (E) at year 1, 3, or 5 was compared with patients who had no recurrence or metastasis at the same time point; *P < 0.05, **P < 0.01 (Student’s t test).
Discussion
Chemotherapy-induced BCSC enrichment plays a critical role in breast cancer recurrence and metastasis. Although BCSCs have increased resistance to chemotherapy compared with bulk cancer cells, differential survival alone cannot account for chemotherapy-induced BCSC enrichment, since we demonstrated on average a 4-fold increase in BCSCs after treatment with paclitaxel at the dose that killed half of the cancer cells. Previous studies have delineated mechanisms that result in active induction of the BCSC phenotype through increased transcription of genes encoding the pluripotency factors NANOG, SOX2, and KLF4 (29, 30, 41), which together with OCT4 are required for the maintenance and specification of BCSCs (17–19). In the present study, we have demonstrated that chemotherapy induces pluripotency factor expression and BCSC enrichment through HIF-1–mediated S100A10 expression. The S100A10-ANXA2 complex interacts with histone chaperone SPT6 and histone demethylase KDM6A. Recruitment of S100A10-ANXA2-SPT6-KDM6A to the OCT4 binding sites of pluripotency factor genes decreases H3K27me3 chromatin marks and increases pluripotency factor transcription, which leads to BCSC enrichment (Figure 17).
Figure 17. HIF-1–mediated S100A10 expression triggers chemotherapy-induced BCSC enrichment.

Cytotoxic chemotherapy induces HIF-1–dependent S100A10 expression, leading to formation of S100A10-ANXA2 nuclear complexes, which interact with SPT6 and KDM6A, and the complex is recruited to OCT4 binding sites of the NANOG, SOX2, and KLF4 genes, leading to erasure of H3K27me3 chromatin marks, transcriptional activation, and BCSC specification.
S100A10 belongs to a family of small, dimeric EF-hand Ca2+-binding proteins. Different from all of the 20 other known S100 proteins, S100A10 is in a permanently active state and is insensitive to intracellular Ca2+ signaling, due to amino acid replacements in its Ca2+-binding loops (52, 53). It is well established that annexin A2 interacts with S100A10 and forms a heterotetramer, in which a central S100A10 dimer interacts with 2 annexin A2 chains (44). Based on the crystal structure from cryo-electron microscopy, optimal binding requires conformational changes associated with target binding, making the S100A10-ANXA2 complex a module for the recruitment of interacting proteins (54). In the cytosol, the S100A10-ANXA2 complex promotes trafficking of proteins, such as ion channels, to the plasma membrane (55–57). However, we found that most of the S100A10 is located in the nucleus, rather than the cytosol, in breast cancer cell lines (Figure 6A and Supplemental Figure 6A) and interacts with ANXA2 (Figure 6B), establishing what we believe is a novel coactivator function for S100A10-ANXA2.
The histone chaperone SPT6 was identified as an S100A10 interacting protein (47), but the functional consequence of this interaction had not been studied. SPT6 participates in chromatin remodeling by acting as a transcription machinery–anchored platform for the recruitment of histone modifiers to target genes (58, 59). SPT6 has been reported to positively regulate H3K4me3 and H3K36me3 through recruitment of the histone methyltransferase SETD2 (60, 61), and to negatively regulate H3K27me3 through recruitment of the histone demethylase KDM6B (62). In the present study, we have demonstrated that in breast cancer cells, SPT6 decreased H3K27me3 modification through interaction with KDM6A, but not KDM6B (Figure 11A), at OCT4 binding sites of pluripotency factor genes. This finding is consistent with the reported genome-wide overlap of SPT6 and KDM6A binding in transcribed regions as determined by ChIP-seq in skeletal myoblasts (48). Although we do not have formal evidence that S100A10, ANXA2, SPT6, and KDM6A form a discrete complex, the multiple interactions among these proteins and their interdependent co-recruitment to OCT4 binding sites provides a molecular mechanism for the increased transcriptional activation of pluripotency factor genes in response to chemotherapy. It should also be noted that paclitaxel treatment decreased H3K27me3 modification at the OCT4 binding site of the NANOG gene, even in the subclones with knockdown of S100A10, ANXA2, or SPT6 (Figure 10B), suggesting that KDM6A or another histone demethylase might be recruited to the NANOG gene by other cofactors or directly by OCT4.
The presence of H3K27me3 marks at transcriptional regulatory regions is associated with gene silencing and must be tightly regulated in order to rapidly switch expression states of genes in response to environmental changes (49). The histone demethylases KDM6A and KDM6B are erasers, responsible for the removal of methyl groups from H3K27, whereas the histone methyltransferase EZH2, an enzymatic subunit of the Polycomb PRC2 complex, is a writer that methylates H3K27 to mediate gene silencing (63). The role of H3K27me3 modification in the regulation of cancer stem cells has been controversial. H3K27me3 was reported to be a negative regulator of cancer stem cells, supported by the evidence that pharmacological inhibition of KDM6A/B, which increased H3K27me3 levels, suppressed BCSCs (64) as well as other types of cancer stem cells (65, 66). On the other hand, EZH2 was reported to be required for BCSC maintenance and expansion (67, 68). To investigate this contradiction, we analyzed H3K27me3 marks both globally and specifically at key regulatory regions of pluripotency factor genes. Inhibition of KDM6A by GSK-J4, which increased both global and locus-specific H3K27me3 modification (Figure 14, A and D, Figure 15D, and Supplemental Figure 9A), blocked paclitaxel-induced BCSC enrichment in vitro and in vivo (Figures 14B and Figure 15B). In contrast, inhibition of EZH2 by EPZ-6438, which decreased global H3K27me3 but did not decrease H3K27me3 modification at regulatory regions of pluripotency factor genes (Supplemental Figure 8, A and D), failed to affect paclitaxel-induced BCSC enrichment (Supplemental Figure 8B). Our study provides evidence that the BCSC phenotype is negatively correlated with H3K27me3 marks specifically at OCT4 binding sites of pluripotency factor genes, but not with global H3K27me3 levels. All of our genetic and pharmacological manipulations of KDM6A and EZH2 expression and activity, both in vitro and in vivo, in both ER+ and TNBC cells, gave results that are consistent with this conclusion.
In ESCs, SPT6 plays an important role in the maintenance of pluripotency by controlling super-enhancers (69). Super-enhancers are defined as clusters of regulatory regions occupied by Mediator complex, RNA polymerase II, and other transcriptional coactivators that control expression of key genes involved in cell identity (70). In ESCs, super-enhancers have been found near genes encoding pluripotency factors (71). Super-enhancers are hyperactivated in breast cancer (72), but their role in the regulation of pluripotency factor gene transcription in BCSCs is still unknown. A caveat of the present study is that we have focused on the recruitment of S100A10-ANXA2-SPT6-KDM6A to proximal OCT4 binding sites in the pluripotency factor genes, and have not investigated super-enhancers where these proteins may also be recruited. ChIP-seq analysis using antibodies against S100A10, ANXA2, SPT6, or KDM6A might provide a broader view of transcriptional regulation of pluripotency factors in response to chemotherapy, although we found ChIP-PCR to be technically demanding under conditions where half of the cells are being killed by exposure to chemotherapy.
Chemotherapy treatment, despite decreasing bulk tumor size, increases the risk of metastasis (73). Only BCSCs are capable of forming clinically relevant metastases at a secondary site (5), making them a good target to inhibit chemotherapy-induced metastasis. Our study suggests several potential therapeutic strategies to target BCSCs. We have demonstrated that genetic or pharmacological inhibition of KDM6A blocks paclitaxel-induced BCSC enrichment in vitro and in vivo. In addition, we have demonstrated that formation of the S100A10-ANXA2 complex is required for S100A10 to promote chemotherapy-induced BCSC enrichment, making this complex another potential target. A series of chemicals were synthesized based on a 1,2,4-triazole scaffold and evaluated for inhibition of S100A10-ANXA2 protein interaction (74). We have shown that one of the analogues, 2-[4-(2-ethylphenyl)-5-o-tolyloxymethyl-4H-[1,2,4]triazol-3-ylsulfanyl]acetamide, inhibits S100A10-ANXA2 protein interaction and abrogates paclitaxel-induced BCSC enrichment in vitro. Further in vivo studies are warranted to evaluate the efficacy of S100A10-ANXA2 inhibitors in the eradication of BCSCs in combination with chemotherapy.
Our current and previous studies have identified multiple signaling pathways that determine the specification of BCSCs in response to chemotherapy. Chemotherapy increases glutathione-dependent copper chelation and DUSP9 phosphatase expression, both of which lead to ERK inactivation, FoxO3 activation, and increased NANOG gene transcription (29, 30). Chemotherapy also decreases DUSP16 expression, leading to p38 activation and stabilization of NANOG and KLF4 mRNA (30). In addition, chemotherapy increases GSTO1 expression, which leads to STAT3 activation and increased KLF4 gene transcription (41). All of these pathways are controlled by HIFs. Thus, pharmacological inhibition of HIF activity may serve as an effective therapeutic strategy to target BCSCs, especially in combination with chemotherapy. We have shown that coadministration of the HIF inhibitor digoxin to tumor-bearing mice can overcome the effect of chemotherapy on BCSC enrichment (9), but digoxin has dose-limiting toxicity in humans that precludes its use as an anticancer drug. We are currently characterizing novel HIF inhibitors with safety profiles that may make them better suited for clinical use. Taken together, our studies provide compelling evidence that targeting HIF-1, S100A10-ANXA2, or KDM6A in combination with chemotherapy is an effective strategy to inhibit BCSC enrichment and may therefore improve clinical outcome for breast cancer patients.
Methods
Cell culture and reagents.
Breast cancer cell lines MDA-MB-231, MCF7, SUM159, and HCC1954 were obtained from Sara Sukumar (Johns Hopkins University). MDA-MB-231 and MCF7 cells were maintained in Dulbecco’s modified Eagle medium (DMEM). HCC1954 cells were maintained in RPMI-1640 medium. SUM159 cells were maintained in DMEM/F12 (50:50) medium. All culture media were supplemented with 10% (vol/vol) fetal bovine serum (FBS) and 1% (vol/vol) penicillin-streptomycin. Cells were maintained at 37°C in a 5% CO2, 95% air incubator. All inhibitors were dissolved in DMSO at 1,000× final concentration, such that inhibitor- or vehicle-treated cells were exposed to 0.1% (vol/vol) DMSO. Paclitaxel, carboplatin, and digoxin were purchased from MilliporeSigma, GSK-J4 was purchased from MedKoo, EPZ-6438 was purchased from Thermo Fisher Scientific, and the S100A10-ANXA2 inhibitor 2-[4-(2-ethylphenyl)-5-o-tolyloxymethyl-4H-[1,2,4]triazol-3-ylsulfanyl]acetamide was a gift from W. Martin Kast at the University of Southern California (Los Angeles, California, USA).
Reverse transcription and qPCR.
Total RNA was extracted with TRIzol (Invitrogen), precipitated with isopropanol, and treated with DNase I (Ambion). cDNA synthesis was performed using the High-Capacity RNA-to-cDNA Kit (Applied Biosystems). qPCR analysis was performed using SYBR Green and the CFX96 Real-Time PCR detection system (Bio-Rad). The expression (E) of each target mRNA relative to 18S rRNA was calculated based on the cycle threshold (Ct) as E = 2–Δ(ΔCt), in which ΔCt = Ct (target) – Ct (18S), and Δ(ΔCt) = ΔCt (test sample) – ΔCt (control sample). PCR primer sequences are shown in Supplemental Table 1.
Immunoblot assay.
Cultured cells were lysed in RIPA buffer, whereas tumor tissues were homogenized with an electric homogenizer and lysed in RIPA buffer. Proteins were separated by SDS-PAGE, blotted onto nitrocellulose membranes, and probed with primary antibodies (Supplemental Table 2). The membranes were then probed with horseradish peroxidase–conjugated secondary antibodies (GE Healthcare) and the chemiluminescent signal was detected using ECL plus (GE Healthcare).
Co-IP.
Five hundred micrograms of whole cell lysates or nuclear protein lysates were incubated with IgG or antibodies against S100A10, ANXA2, SPT6, or KDM6A (Supplemental Table 3) in the presence of protein G–Sepharose beads (Amersham Biosciences) at 4°C overnight, and the resulting immunoprecipitates were then subjected to immunoblot assays. Fifty micrograms of protein was used as input.
Lentiviral transduction.
Lentiviral vectors encoding shRNA targeting HIF-1α and HIF-2α were described previously (75). pLKO.1-puro lentiviral vectors encoding shRNA targeting S100A10, ANXA2, SPT6, and KDM6A were purchased from MilliporeSigma, and shRNA sequences are shown in Supplemental Table 4. Lentiviruses were packaged in 293T cells. MDA-MB-231 and MCF7 cells were transduced with viral supernatant supplemented with 8 μg/mL Polybrene (MilliporeSigma). After 24 hours, cells were replenished with fresh medium containing 0.5 μg/mL puromycin (MilliporeSigma) and maintained in puromycin-containing medium for selection of stably transfected clones.
ChIP-qPCR assay.
MDA-MB-231 and MCF7 cells were cross-linked in 3.7% formaldehyde for 15 minutes, quenched in 0.125 M glycine for 5 minutes, and lysed with SDS lysis buffer. Chromatin was sheared by sonication and lysates were precleared with salmon sperm DNA/protein A–agarose slurry (MilliporeSigma) for 1 hour and incubated with IgG or antibodies against HIF-1α, HIF-2α, HIF-1β, OCT4, S100A10, SPT6, H3K27me3, histone H3, or KDM6A (Supplemental Table 5) in the presence of agarose beads overnight. After sequential washes of the agarose beads with low-salt, high-salt, LiCl, and Tris-EDTA buffer, DNA was eluted in 1% SDS with 0.1 M NaHCO3, and cross-links were reversed by addition of 0.2 M NaCl. DNA was purified by phenol-chloroform extraction and ethanol precipitation, and candidate binding sites were analyzed by qPCR. Primer sequences are shown in Supplemental Table 6.
ALDH assay.
The ALDEFLUOR assay was performed according to the manufacturer’s instructions (Stem Cell Technologies) (42). Cultured cells were trypsinized, whereas tumor tissues were minced, digested with 1 mg/mL type 1 collagenase (MilliporeSigma) at 37°C for 30 minutes, and filtered through a 70-μm cell strainer. Cells were counted and 1 × 10⁶ live cells were suspended in assay buffer containing 1 μM BODIPY-animoacetaldehyde and incubated at 37°C for 45 minutes. An aliquot of cells from each sample was treated with 50 mM diethylaminobenzaldehyde, an ALDH inhibitor, as a negative control for gating. Samples were analyzed by flow cytometry using a FACSCalibur (BD Biosciences).
Mammosphere assay.
Cultured cells were trypsinized, whereas tumor tissues were minced, digested with 1 mg/mL of type 1 collagenase (MilliporeSigma) at 37°C for 30 minutes, and filtered through a 70-μm cell strainer. The number of live cells was determined using trypan blue staining and single-cell suspensions were seeded in 6-well ultra-low-attachment plates (Corning) at a density of 5,000 cells/mL in complete MammoCult Medium (Stem Cell Technologies) (43). Mammosphere cultures were photographed 7 days later using a phase contrast microscope (Olympus) and mammospheres 50 μm or greater in diameter were counted using ImageJ software (NIH).
Animal studies.
For tumorigenicity assays, 1,000 MDA-MB-231 subclone cells were injected into the MFP of 5- to 7-week-old female SCID mice (Charles River, strain 561) in a 1:1 (vol/vol) suspension of Matrigel (BD Biosciences) in PBS. Fifty-five days after injection, the number of mice that developed palpable tumors was recorded. For all other assays with SCID mice, 2 × 10⁶ MDA-MB-231 subclone cells were injected into the MFP. Mice were treated with drugs as indicated. Female MMTV-PyMT–transgenic mice (The Jackson Laboratory, strain 002374) were treated when the total volume of mammary tumors in each mouse reached 150 mm3. Primary tumors were measured for length (L) and width (W), and tumor volume (V) was calculated as V = L × W2 × 0.524. Mice were treated with carboplatin or paclitaxel by intraperitoneal injection.
Statistics.
All data are expressed as mean ± SEM. Kaplan-Meier curves were generated from a data set containing gene expression and survival data from 3,951 breast cancer patients (76), and the log-rank test was performed. Pearson’s correlation test was used to compare S100A10 expression with the HIF signature or the BCSC signature, based on mRNA levels from TCGA Breast Invasive Carcinoma data set of 1,247 patients (77). For the tumorigenicity assay, Fisher’s exact test was performed. For all other assays, differences between 2 groups were analyzed by 2-tailed Student’s t test, whereas differences between multiple groups were analyzed by ANOVA with post hoc test. For all tests, P values less than 0.05 were considered significant.
Study approval.
Mouse protocols were approved by the Animal Care and Use Committee at Johns Hopkins University (Baltimore, Maryland, USA), and were in accordance with the NIH Guide for the Care and Use of Laboratory Animals (National Academies Press, 2011).
Author contributions
HL and GLS designed the research study. HL and YX performed most of the experiments and acquired data. LT, NLM, RW, and YJW performed some RNA and protein analyses with samples from cultured cells and animal tissues. HL, YX, and JL performed database analyses. HL, YX, and NLM performed statistical analysis. YY helped to develop methods and performed some ChIP experiments. HL and GLS analyzed the data and wrote the manuscript. GLS supervised the study. All authors reviewed and commented on the manuscript.
Supplementary Material
Acknowledgments
We thank Karen Padgett and Rachel Geisler of Novus Biologicals for providing antibodies listed in Supplemental Tables 2 and 3. We are grateful to W. Martin Kast (University of Southern California) for providing the S100A10-ANXA2 inhibitor. GLS is an American Cancer Society Research Professor and the C. Michael Armstrong Professor at the Johns Hopkins University School of Medicine. This work was supported by grants from the American Cancer Society (Research Professor Award RP-16-239-06-COUN), Armstrong Family Foundation, and the Cindy Rosencrans Foundation.
Version 1. 05/19/2020
In-Press Preview
Version 2. 07/27/2020
Electronic publication
Version 3. 09/01/2020
Print issue publication
Footnotes
Conflict of interest: The authors have declared that no conflict of interest exists.
Copyright: © 2020, American Society for Clinical Investigation.
Reference information: J Clin Invest. 2020;130(9):4607–4623.https://doi.org/10.1172/JCI138577.
Contributor Information
Haiquan Lu, Email: hlu21@jhmi.edu.
Yangyiran Xie, Email: yxie28@jhu.edu.
Linh Tran, Email: ltran18@jhu.edu.
Jie Lan, Email: lanjielanjie@foxmail.com.
Yongkang Yang, Email: yyang83@jhmi.edu.
Naveena L. Murugan, Email: nmuruga1@jhu.edu.
Ru Wang, Email: rwang81@jhmi.edu.
Yueyang J. Wang, Email: wangyy.jack@outlook.com.
Gregg L. Semenza, Email: gsemenza@jhmi.edu.
References
- 1.Siegel RL, Miller KD, Jemal A. Cancer statistics, 2020. CA Cancer J Clin. 2020;70(1):7–30. doi: 10.3322/caac.21590. [DOI] [PubMed] [Google Scholar]
- 2.Waks AG, Winer EP. Breast cancer treatment: A review. JAMA. 2019;321(3):288–300. doi: 10.1001/jama.2018.19323. [DOI] [PubMed] [Google Scholar]
- 3.Moiseenko F, Volkov N, Bogdanov A, Dubina M, Moiseyenko V. Resistance mechanisms to drug therapy in breast cancer and other solid tumors: An opinion. F1000Res. 2017;6:288. doi: 10.12688/f1000research.10992.1. [DOI] [PMC free article] [PubMed] [Google Scholar]
- 4.Pece S, et al. Biological and molecular heterogeneity of breast cancers correlates with their cancer stem cell content. Cell. 2010;140(1):62–73. doi: 10.1016/j.cell.2009.12.007. [DOI] [PubMed] [Google Scholar]
- 5.Oskarsson T, Batlle E, Massagué J. Metastatic stem cells: sources, niches, and vital pathways. Cell Stem Cell. 2014;14(3):306–321. doi: 10.1016/j.stem.2014.02.002. [DOI] [PMC free article] [PubMed] [Google Scholar]
- 6.Li X, et al. Intrinsic resistance of tumorigenic breast cancer cells to chemotherapy. J Natl Cancer Inst. 2008;100(9):672–679. doi: 10.1093/jnci/djn123. [DOI] [PubMed] [Google Scholar]
- 7.Creighton CJ, et al. Residual breast cancers after conventional therapy display mesenchymal as well as tumor-initiating features. Proc Natl Acad Sci U S A. 2009;106(33):13820–13825. doi: 10.1073/pnas.0905718106. [DOI] [PMC free article] [PubMed] [Google Scholar]
- 8.Bhola NE, et al. TGF-β inhibition enhances chemotherapy action against triple-negative breast cancer. J Clin Invest. 2013;123(3):1348–1358. doi: 10.1172/JCI65416. [DOI] [PMC free article] [PubMed] [Google Scholar]
- 9.Samanta D, Gilkes DM, Chaturvedi P, Xiang L, Semenza GL. Hypoxia-inducible factors are required for chemotherapy resistance of breast cancer stem cells. Proc Natl Acad Sci U S A. 2014;111(50):E5429–E5438. doi: 10.1073/pnas.1421438111. [DOI] [PMC free article] [PubMed] [Google Scholar] [Retracted]
- 10.Iliopoulos D, Hirsch HA, Wang G, Struhl K. Inducible formation of breast cancer stem cells and their dynamic equilibrium with non-stem cancer cells via IL6 secretion. Proc Natl Acad Sci U S A. 2011;108(4):1397–1402. doi: 10.1073/pnas.1018898108. [DOI] [PMC free article] [PubMed] [Google Scholar]
- 11.Manzo G. Similarities between embryo development and cancer process suggest new strategies for research and therapy of tumors: a new point of view. Front Cell Dev Biol. 2019;7:20. doi: 10.3389/fcell.2019.00020. [DOI] [PMC free article] [PubMed] [Google Scholar]
- 12.Ben-Porath I, et al. An embryonic stem cell-like gene expression signature in poorly differentiated aggressive human tumors. Nat Genet. 2008;40(5):499–507. doi: 10.1038/ng.127. [DOI] [PMC free article] [PubMed] [Google Scholar]
- 13.Kim J, Orkin SH. Embryonic stem cell-specific signatures in cancer: insights into genomic regulatory networks and implications for medicine. Genome Med. 2011;3(11):75. doi: 10.1186/gm291. [DOI] [PMC free article] [PubMed] [Google Scholar]
- 14.Boyer LA, et al. Core transcriptional regulatory circuitry in human embryonic stem cells. Cell. 2005;122(6):947–956. doi: 10.1016/j.cell.2005.08.020. [DOI] [PMC free article] [PubMed] [Google Scholar]
- 15.Thomson M, Liu SJ, Zou LN, Smith Z, Meissner A, Ramanathan S. Pluripotency factors in embryonic stem cells regulate differentiation into germ layers. Cell. 2011;145(6):875–889. doi: 10.1016/j.cell.2011.05.017. [DOI] [PMC free article] [PubMed] [Google Scholar]
- 16.Yeo JC, Ng HH. The transcriptional regulation of pluripotency. Cell Res. 2013;23(1):20–32. doi: 10.1038/cr.2012.172. [DOI] [PMC free article] [PubMed] [Google Scholar]
- 17.Lu X, Mazur SJ, Lin T, Appella E, Xu Y. The pluripotency factor nanog promotes breast cancer tumorigenesis and metastasis. Oncogene. 2014;33(20):2655–2664. doi: 10.1038/onc.2013.209. [DOI] [PMC free article] [PubMed] [Google Scholar]
- 18.Yu F, et al. Kruppel-like factor 4 (KLF4) is required for maintenance of breast cancer stem cells and for cell migration and invasion. Oncogene. 2011;30(18):2161–2172. doi: 10.1038/onc.2010.591. [DOI] [PMC free article] [PubMed] [Google Scholar]
- 19.Kim RJ, Nam JS. OCT4 expression enhances features of cancer stem cells in a mouse model of breast cancer. Lab Anim Res. 2011;27(2):147–152. doi: 10.5625/lar.2011.27.2.147. [DOI] [PMC free article] [PubMed] [Google Scholar]
- 20.Boland MJ, Nazor KL, Loring JF. Epigenetic regulation of pluripotency and differentiation. Circ Res. 2014;115(2):311–324. doi: 10.1161/CIRCRESAHA.115.301517. [DOI] [PMC free article] [PubMed] [Google Scholar]
- 21.Tee WW, Reinberg D. Chromatin features and the epigenetic regulation of pluripotency states in ESCs. Development. 2014;141(12):2376–2390. doi: 10.1242/dev.096982. [DOI] [PMC free article] [PubMed] [Google Scholar]
- 22.Nair SS, Kumar R. Chromatin remodeling in cancer: a gateway to regulate gene transcription. Mol Oncol. 2012;6(6):611–619. doi: 10.1016/j.molonc.2012.09.005. [DOI] [PMC free article] [PubMed] [Google Scholar]
- 23.Swygert SG, Peterson CL. Chromatin dynamics: interplay between remodeling enzymes and histone modifications. Biochim Biophys Acta. 2014;1839(8):728–736. doi: 10.1016/j.bbagrm.2014.02.013. [DOI] [PMC free article] [PubMed] [Google Scholar]
- 24.Roeder RG. 50+ years of eukaryotic transcription: an expanding universe of factors and mechanisms. Nat Struct Mol Biol. 2019;26(9):783–791. doi: 10.1038/s41594-019-0287-x. [DOI] [PMC free article] [PubMed] [Google Scholar]
- 25.Bannister AJ, Kouzarides T. Regulation of chromatin by histone modifications. Cell Res. 2011;21(3):381–395. doi: 10.1038/cr.2011.22. [DOI] [PMC free article] [PubMed] [Google Scholar]
- 26.Jiang C, Pugh BF. Nucleosome positioning and gene regulation: advances through genomics. Nat Rev Genet. 2009;10(3):161–172. doi: 10.1038/nrg2522. [DOI] [PMC free article] [PubMed] [Google Scholar]
- 27.Zhang C, et al. Hypoxia induces the breast cancer stem cell phenotype by HIF-dependent and ALKBH5-mediated m6A-demethylation of NANOG mRNA. Proc Natl Acad Sci U S A. 2016;113(14):E2047–E2056. doi: 10.1073/pnas.1602883113. [DOI] [PMC free article] [PubMed] [Google Scholar]
- 28.Lan J, Lu H, Samanta D, Salman S, Lu Y, Semenza GL. Hypoxia-inducible factor 1-dependent expression of adenosine receptor 2B promotes breast cancer stem cell enrichment. Proc Natl Acad Sci U S A. 2018;115(41):E9640–E9648. doi: 10.1073/pnas.1809695115. [DOI] [PMC free article] [PubMed] [Google Scholar]
- 29.Lu H, et al. Chemotherapy triggers HIF-1-dependent glutathione synthesis and copper chelation that induces the breast cancer stem cell phenotype. Proc Natl Acad Sci U S A. 2015;112(33):E4600–E4609. doi: 10.1073/pnas.1513433112. [DOI] [PMC free article] [PubMed] [Google Scholar]
- 30.Lu H, et al. Reciprocal regulation of DUSP9 and DUSP16 expression by HIF1 controls ERK and p38 MAP kinase activity and mediates chemotherapy-induced breast cancer stem cell enrichment. Cancer Res. 2018;78(15):4191–4202. doi: 10.1158/0008-5472.CAN-18-0270. [DOI] [PubMed] [Google Scholar]
- 31.Kenneth NS, Mudie S, van Uden P, Rocha S. SWI/SNF regulates the cellular response to hypoxia. J Biol Chem. 2009;284(7):4123–4131. doi: 10.1074/jbc.M808491200. [DOI] [PubMed] [Google Scholar]
- 32.Lee JS, et al. Negative regulation of hypoxic responses via induced Reptin methylation. Mol Cell. 2010;39(1):71–85. doi: 10.1016/j.molcel.2010.06.008. [DOI] [PMC free article] [PubMed] [Google Scholar]
- 33.Lee JS, et al. Hypoxia-induced methylation of a pontin chromatin remodeling factor. Proc Natl Acad Sci U S A. 2011;108(33):13510–13515. doi: 10.1073/pnas.1106106108. [DOI] [PMC free article] [PubMed] [Google Scholar]
- 34.Tsai YP, Wu KJ. Epigenetic regulation of hypoxia-responsive gene expression: focusing on chromatin and DNA modifications. Int J Cancer. 2014;134(2):249–256. doi: 10.1002/ijc.28190. [DOI] [PubMed] [Google Scholar]
- 35.Kim Y, et al. Methylation-dependent regulation of HIF-1α stability restricts retinal and tumour angiogenesis. Nat Commun. 2016;7:10347. doi: 10.1038/ncomms10347. [DOI] [PMC free article] [PubMed] [Google Scholar]
- 36.Chen R, et al. The acetate/ACSS2 switch regulates HIF-2 stress signaling in the tumor cell microenvironment. PLoS One. 2015;10(2):e0116515. doi: 10.1371/journal.pone.0116515. [DOI] [PMC free article] [PubMed] [Google Scholar]
- 37.McKiernan E, McDermott EW, Evoy D, Crown J, Duffy MJ. The role of S100 genes in breast cancer progression. Tumour Biol. 2011;32(3):441–450. doi: 10.1007/s13277-010-0137-2. [DOI] [PubMed] [Google Scholar]
- 38.Lukanidin E, Sleeman JP. Building the niche: the role of the S100 proteins in metastatic growth. Semin Cancer Biol. 2012;22(3):216–225. doi: 10.1016/j.semcancer.2012.02.006. [DOI] [PubMed] [Google Scholar]
- 39.Dezső Z, et al. Gene expression profiling reveals epithelial mesenchymal transition (EMT) genes can selectively differentiate eribulin sensitive breast cancer cells. PLoS One. 2014;9(8):e106131. doi: 10.1371/journal.pone.0106131. [DOI] [PMC free article] [PubMed] [Google Scholar]
- 40.Zhang H, et al. Digoxin and other cardiac glycosides inhibit HIF-1alpha synthesis and block tumor growth. Proc Natl Acad Sci U S A. 2008;105(50):19579–19586. doi: 10.1073/pnas.0809763105. [DOI] [PMC free article] [PubMed] [Google Scholar]
- 41.Lu H, et al. Chemotherapy-induced Ca2+ release stimulates breast cancer stem cell enrichment. Cell Rep. 2017;18(8):1946–1957. doi: 10.1016/j.celrep.2017.02.001. [DOI] [PubMed] [Google Scholar]
- 42.Ginestier C, et al. ALDH1 is a marker of normal and malignant human mammary stem cells and a predictor of poor clinical outcome. Cell Stem Cell. 2007;1(5):555–567. doi: 10.1016/j.stem.2007.08.014. [DOI] [PMC free article] [PubMed] [Google Scholar]
- 43.Charafe-Jauffret E, et al. Breast cancer cell lines contain functional cancer stem cells with metastatic capacity and a distinct molecular signature. Cancer Res. 2009;69(4):1302–1313. doi: 10.1158/0008-5472.CAN-08-2741. [DOI] [PMC free article] [PubMed] [Google Scholar]
- 44.Liu Y, Myrvang HK, Dekker LV. Annexin A2 complexes with S100 proteins: structure, function and pharmacological manipulation. Br J Pharmacol. 2015;172(7):1664–1676. doi: 10.1111/bph.12978. [DOI] [PMC free article] [PubMed] [Google Scholar]
- 45.Woodham AW, et al. Small molecule inhibitors of the annexin A2 heterotetramer prevent human papillomavirus type 16 infection. J Antimicrob Chemother. 2015;70(6):1686–1690. doi: 10.1093/jac/dkv045. [DOI] [PMC free article] [PubMed] [Google Scholar]
- 46.Thiel C, Osborn M, Gerke V. The tight association of the tyrosine kinase substrate annexin II with the submembranous cytoskeleton depends on intact p11- and Ca(2+)-binding sites. J Cell Sci. 1992;103(pt 3):733–742. doi: 10.1242/jcs.103.3.733. [DOI] [PubMed] [Google Scholar]
- 47.Oh YS, et al. SMARCA3, a chromatin-remodeling factor, is required for p11-dependent antidepressant action. Cell. 2013;152(4):831–843. doi: 10.1016/j.cell.2013.01.014. [DOI] [PMC free article] [PubMed] [Google Scholar]
- 48.Wang AH, et al. The histone chaperone Spt6 coordinates histone H3K27 demethylation and myogenesis. EMBO J. 2013;32(8):1075–1086. doi: 10.1038/emboj.2013.54. [DOI] [PMC free article] [PubMed] [Google Scholar]
- 49.Wiles ET, Selker EU. H3K27 methylation: a promiscuous repressive chromatin mark. Curr Opin Genet Dev. 2017;43:31–37. doi: 10.1016/j.gde.2016.11.001. [DOI] [PMC free article] [PubMed] [Google Scholar]
- 50.Kruidenier L, et al. A selective jumonji H3K27 demethylase inhibitor modulates the proinflammatory macrophage response. Nature. 2012;488(7411):404–408. doi: 10.1038/nature11262. [DOI] [PMC free article] [PubMed] [Google Scholar]
- 51.Pece S, et al. Identification and clinical validation of a multigene assay that interrogates the biology of cancer stem cells and predicts metastasis in breast cancer: A retrospective consecutive study. EBioMedicine. 2019;42:352–362. doi: 10.1016/j.ebiom.2019.02.036. [DOI] [PMC free article] [PubMed] [Google Scholar]
- 52.Donato R, et al. Functions of S100 proteins. Curr Mol Med. 2013;13(1):24–57. doi: 10.2174/156652413804486214. [DOI] [PMC free article] [PubMed] [Google Scholar]
- 53.Madureira PA, O’Connell PA, Surette AP, Miller VA, Waisman DM. The biochemistry and regulation of S100A10: a multifunctional plasminogen receptor involved in oncogenesis. J Biomed Biotechnol. 2012;2012:353687. doi: 10.1155/2012/353687. [DOI] [PMC free article] [PubMed] [Google Scholar]
- 54.Réty S, et al. The crystal structure of a complex of p11 with the annexin II N-terminal peptide. Nat Struct Biol. 1999;6(1):89–95. doi: 10.1038/4965. [DOI] [PubMed] [Google Scholar]
- 55.Girard C, Tinel N, Terrenoire C, Romey G, Lazdunski M, Borsotto M. p11, an annexin II subunit, an auxiliary protein associated with the background K+ channel, TASK-1. EMBO J. 2002;21(17):4439–4448. doi: 10.1093/emboj/cdf469. [DOI] [PMC free article] [PubMed] [Google Scholar]
- 56.van de Graaf SF, et al. Functional expression of the epithelial Ca(2+) channels (TRPV5 and TRPV6) requires association of the S100A10-annexin 2 complex. EMBO J. 2003;22(7):1478–1487. doi: 10.1093/emboj/cdg162. [DOI] [PMC free article] [PubMed] [Google Scholar]
- 57.Poon WY, Malik-Hall M, Wood JN, Okuse K. Identification of binding domains in the sodium channel Na(V)1.8 intracellular N-terminal region and annexin II light chain p11. FEBS Lett. 2004;558(1–3):114–118. doi: 10.1016/S0014-5793(03)01512-6. [DOI] [PubMed] [Google Scholar]
- 58.Bortvin A, Winston F. Evidence that Spt6p controls chromatin structure by a direct interaction with histones. Science. 1996;272(5267):1473–1476. doi: 10.1126/science.272.5267.1473. [DOI] [PubMed] [Google Scholar]
- 59.Kato H, Okazaki K, Urano T. Spt6: two fundamentally distinct functions in the regulation of histone modification. Epigenetics. 2013;8(12):1249–1253. doi: 10.4161/epi.26487. [DOI] [PMC free article] [PubMed] [Google Scholar]
- 60.Yoh SM, Lucas JS, Jones KA. The Iws1:Spt6:CTD complex controls cotranscriptional mRNA biosynthesis and HYPB/Setd2-mediated histone H3K36 methylation. Genes Dev. 2008;22(24):3422–3434. doi: 10.1101/gad.1720008. [DOI] [PMC free article] [PubMed] [Google Scholar]
- 61.Begum NA, Stanlie A, Nakata M, Akiyama H, Honjo T. The histone chaperone Spt6 is required for activation-induced cytidine deaminase target determination through H3K4me3 regulation. J Biol Chem. 2012;287(39):32415–32429. doi: 10.1074/jbc.M112.351569. [DOI] [PMC free article] [PubMed] [Google Scholar]
- 62.Chen S, et al. The histone H3 Lys 27 demethylase JMJD3 regulates gene expression by impacting transcriptional elongation. Genes Dev. 2012;26(12):1364–1375. doi: 10.1101/gad.186056.111. [DOI] [PMC free article] [PubMed] [Google Scholar]
- 63.Schuettengruber B, Chourrout D, Vervoort M, Leblanc B, Cavalli G. Genome regulation by polycomb and trithorax proteins. Cell. 2007;128(4):735–745. doi: 10.1016/j.cell.2007.02.009. [DOI] [PubMed] [Google Scholar]
- 64.Yan N, et al. GSKJ4, an H3K27me3 demethylase inhibitor, effectively suppresses the breast cancer stem cells. Exp Cell Res. 2017;359(2):405–414. doi: 10.1016/j.yexcr.2017.08.024. [DOI] [PubMed] [Google Scholar]
- 65.Sakaki H, et al. GSKJ4, a selective Jumonji H3K27 demethylase inhibitor, effectively targets ovarian cancer stem cells. Anticancer Res. 2015;35(12):6607–6614. [PubMed] [Google Scholar]
- 66.Watarai H, et al. Impact of H3K27 demethylase inhibitor GSKJ4 on NSCLC cells alone and in combination with metformin. Anticancer Res. 2016;36(11):6083–6092. doi: 10.21873/anticanres.11198. [DOI] [PubMed] [Google Scholar]
- 67.Chang CJ, et al. EZH2 promotes expansion of breast tumor initiating cells through activation of RAF1-β-catenin signaling. Cancer Cell. 2011;19(1):86–100. doi: 10.1016/j.ccr.2010.10.035. [DOI] [PMC free article] [PubMed] [Google Scholar]
- 68.van Vlerken LE, et al. EZH2 is required for breast and pancreatic cancer stem cell maintenance and can be used as a functional cancer stem cell reporter. Stem Cells Transl Med. 2013;2(1):43–52. doi: 10.5966/sctm.2012-0036. [DOI] [PMC free article] [PubMed] [Google Scholar]
- 69.Wang AH, et al. The elongation factor Spt6 maintains ESC pluripotency by controlling super-enhancers and counteracting Polycomb proteins. Mol Cell. 2017;68(2):398–413.e6. doi: 10.1016/j.molcel.2017.09.016. [DOI] [PMC free article] [PubMed] [Google Scholar]
- 70.Hnisz D, et al. Super-enhancers in the control of cell identity and disease. Cell. 2013;155(4):934–947. doi: 10.1016/j.cell.2013.09.053. [DOI] [PMC free article] [PubMed] [Google Scholar]
- 71.Whyte WA, et al. Master transcription factors and mediator establish super-enhancers at key cell identity genes. Cell. 2013;153(2):307–319. doi: 10.1016/j.cell.2013.03.035. [DOI] [PMC free article] [PubMed] [Google Scholar]
- 72.Li QL, et al. The hyper-activation of transcriptional enhancers in breast cancer. Clin Epigenetics. 2019;11(1):48. doi: 10.1186/s13148-019-0645-x. [DOI] [PMC free article] [PubMed] [Google Scholar]
- 73.Karagiannis GS, et al. Neoadjuvant chemotherapy induces breast cancer metastasis through a TMEM-mediated mechanism. Sci Transl Med. 2017;9(397):eaan0026. doi: 10.1126/scitranslmed.aan0026. [DOI] [PMC free article] [PubMed] [Google Scholar]
- 74.Reddy TR, Li C, Guo X, Fischer PM, Dekker LV. Design, synthesis and SAR exploration of tri-substituted 1,2,4-triazoles as inhibitors of the annexin A2-S100A10 protein interaction. Bioorg Med Chem. 2014;22(19):5378–5391. doi: 10.1016/j.bmc.2014.07.043. [DOI] [PMC free article] [PubMed] [Google Scholar]
- 75.Zhang H, et al. HIF-1-dependent expression of angiopoietin-like 4 and L1CAM mediates vascular metastasis of hypoxic breast cancer cells to the lungs. Oncogene. 2012;31(14):1757–1770. doi: 10.1038/onc.2011.365. [DOI] [PMC free article] [PubMed] [Google Scholar] [Retracted]
- 76.Györffy B, et al. An online survival analysis tool to rapidly assess the effect of 22,277 genes on breast cancer prognosis using microarray data of 1,809 patients. Breast Cancer Res Treat. 2010;123(3):725–731. doi: 10.1007/s10549-009-0674-9. [DOI] [PubMed] [Google Scholar]
- 77.Cancer Genome Atlas Network Comprehensive molecular portraits of human breast tumours. Nature. 2012;490(7418):61–70. doi: 10.1038/nature11412. [DOI] [PMC free article] [PubMed] [Google Scholar]
Associated Data
This section collects any data citations, data availability statements, or supplementary materials included in this article.