

Abstract
Imaging of cardiac tissue structure plays a critical role in the treatment and understanding of cardiovascular disease. Optical coherence tomography (OCT) offers the potential to provide valuable, high-resolution imaging of cardiac tissue. However, there is a lack of comprehensive OCT imaging data of the human heart, which could improve identification of structural substrates underlying cardiac abnormalities. The objective of this study was to provide qualitative and quantitative analysis of OCT image features throughout the human heart. Fifty human hearts were acquired, and tissues from all chambers were imaged with OCT. Histology was obtained to verify tissue composition. Statistical differences between OCT image features corresponding to different tissue types and chambers were estimated using analysis of variance. OCT imaging provided features that were able to distinguish structures such as thickened collagen, as well as adipose tissue and fibrotic myocardium. Statistically significant differences were found between atria and ventricles in attenuation coefficient, and between adipose and all other tissue types. This study provides an overview of OCT image features throughout the human heart, which can be used for guiding future applications such as OCT-integrated catheter-based treatments or ex vivo investigation of structural substrates.
Keywords: cardiovascular diseases, humans, myocardium, optical coherence, tomography
Graphical Abstract
1 |. INTRODUCTION
Cardiovascular disease is the leading cause of death in the United States [1]. It is projected that by 2035, over 130 million adults in the United States will have some form of cardiovascular disease [2]. Therefore, there is an urgent need to improve the treatment and understanding of the human heart. In particular, it is known that the tissue structure of the heart plays a critical role in the mechanisms of heart disease through alteration of mechanical and electrophysiological properties. Myofiber disarray is associated with hypertrophic cardiomyopathy and infarction [3], and the complex orientation and rearrangement of myofibers may act as a substrate for irregular electrical patterns underlying arrhythmia [4, 5]. Fibrosis is believed to be an important arrhythmia substrate [6], and is also associated with remodeling during cardiomyopathy, increased cardiac stiffness and the development of heart failure [7]. Adipose accumulation in ventricular myocardium is associated with arrhythmogenic right ventricular cardiomyopathy [8] and left ventricular tachycardia after myocardial infarction [9]. Myocardial infarction can also lead to the formation of scar and increased collagen content in the heart wall [10].
Imaging of cardiac tissue structure is typically carried out using magnetic resonance imaging (MRI) or computed tomography (CT). Diffusion-tensor MRI has been demonstrated for imaging of fiber orientation in both the atria and ventricles [11, 12]. Delayed enhancement MRI [13–16] and CT [17, 18] can be used for myocardial infarction and fibrosis imaging, which is useful for making accurate diagnoses, predicting outcomes after therapy and treatment planning. MRI and CT have also been used to image adipose in cardiac tissue [19, 20]. However, limitations still remain, primarily in terms of resolution. Finer details such as the specific organization of fibrotic collagen fibers and presence of smaller infiltrated adipose regions may be missed, especially in thinner regions of the heart wall such as the atria. Real-time imaging guidance of the detailed structural substrate could also be useful for more targeted ablation procedures for arrhythmia treatment or for guiding endomyocardial biopsy.
Optical coherence tomography (OCT) is a high-speed, nondestructive optical imaging modality with micrometer resolution and an imaging depth typically ranging from 2 to 3 mm. [21, 22] Currently, OCT has been clinically adopted for intravascular imaging, where OCT is able to provide high-resolution visualization of atherosclerotic plaques [23–25]. However, the use of OCT for imaging the heart wall has also been gaining interest, where OCT may similarly be able to provide detailed structural information on pathological and remodeled tissues. OCT has been used to characterize myofiber arrangement related to heart damage and remodeling in small animal models [26–28]. Recently, OCT imaging of the human heart has also been explored, identifying features of the cardiac conduction system [29], endocardial scar, fibrosis [30] and adipose tissue [31]. Comprehensive OCT imaging of the human pulmonary veins has visualized collagen fibers in the venous myocardial sleeves, including varying organization among different veins [32]. Finally, OCT-integrated catheters have been developed for the monitoring of lesion formation during ablation procedures for atrial fibrillation, with some demonstrations in vivo [33–38]. Therefore, OCT may be able to offer real-time visualization during catheter-based therapies.
However, OCT image features throughout the human heart have not yet been quantitatively described. A consolidated atlas concerning OCT imaging of the human heart, such as those that exist for intravascular OCT [39] and retinal OCT imaging [40], is also lacking. Such an atlas could guide future applications of cardiac OCT imaging, including those using OCT-integrated catheters. Therefore, the objective of this study was to qualitatively and quantitatively describe tissue features throughout the human heart using OCT.
2 |. METHODS
2.1 |. Specimens
Three-dimensional datasets were acquired from 50 human hearts. The specimens were acquired through an approved protocol from the National Disease Research Interchange (NDRI). NDRI received consent for all donors. All specimens were de-identified and considered not human subjects research, according to the Columbia University Institutional Review Board under 45 CFR 46. The inclusion criteria for the NDRI protocol incorporate both healthy hearts and diagnosis of end-stage heart failure, cardiomyopathy, coronary heart disease, atrial fibrillation and myocardial infarction. The detailed clinical characteristics of the human donor hearts are listed in Table 1. Fresh tissue samples were shipped in an ice-cold phosphate-buffered saline solution to be kept cool but not frozen. The tissues were received within 48 hours of donor death. Fresh tissue sections were dissected from various locations from the right atrium (RA), left atrium (LA), right ventricle (RV), left ventricle (LV), right ventricular septum (RVS) and left ventricular septum (LVS) for imaging.
TABLE 1.
Clinical characteristics of heart donors
| Characteristic | Value |
|---|---|
| N | 50 |
| Demographic profile | |
| Age in years, median (interquartile range) | 62 (56.3–67.0) |
| Female, n (%) | 22 (44.0) |
| BMI, median (interquartile range) | 31.2 (26.7–36.0) |
| Medical history, n (%) | |
| Heart failure | 11 (22.0) |
| Cardiomyopathy | 9 (18.0) |
| Coronary artery disease | 14 (28.0) |
| Myocardial infarction | 14 (28.0) |
| Atrial fibrillation | 4 (8.0) |
| Chronic obstructive pulmonary disease | 17 (34.0) |
| Diabetes | 19 (38.0) |
| Hypertension | 33 (66.0) |
| Cause of death, n (%) | |
| Cardiac arrest | 19 (38.0) |
| Cardiopulmonary arrest | 4 (8.0) |
| Respiratory arrest | 1 (2.0) |
| Respiratory failure | 5 (10.0) |
| Chronic obstructive pulmonary disease | 1 (2.0) |
| Congestive heart failure | 1 (2.0) |
| Others, cardiac related | 13 (26.0) |
| Others, not cardiac related | 6 (12.0) |
Abbreviation: BMI, body mass index.
2.2 |. OCT image acquisition
The spectral domain OCT system, Telesto I (Thorlabs GmbH, Germany), was used for imaging. The system is an InGaAs-based system with its source centered at 1325 nm and a bandwidth of 150 nm. The axial and lateral resolutions are 6.5 and 15 μm in air, respectively. All datasets were acquired at 28 kHz. In our experiments, image volumes were acquired with lateral pixel sizes ranging from 5.0 to 6.3 μm, covering between 3.0 and 5.0 mm in a lateral dimension. The axial dimension of the volumes was 2.51 mm in air corresponding to 512 voxels. For this study, about two to three image volumes were acquired per chamber for each heart. For certain regions, overlapping image volumes were acquired and stitched to display larger areas.
2.3 |. Histopathology
After imaging, samples were sectioned parallel to the direction of the B-scans and sent to histology. In four hearts, en face histology slides were also obtained to compare tissue features in the en face view. Sample pieces were fixed in formalin for at least 24 hours, and then placed in 20% ethanol. After fixation, samples were stained with Masson’s trichrome. Histology levels were obtained with 5 μm thickness and had a maximum of 3 mm between levels to ensure multiple matches between histology and an OCT image volume. Registration of OCT and histology was performed by two investigators, blind to the classification results, under the guidance of a pathologist (C.C.M.). Overall, 573 pairs of OCT-histology matches were made in the atlas.
2.4 |. Image analysis
We extracted quantitative image features from the OCT images and compared features between chambers and between different tissue types. In each OCT image, we calculated key features, including attenuation coefficient, contrast, correlation, energy, homogeneity, SD, skewness and kurtosis. We measured the attenuation coefficients μt based on the model described in a prior study [31]. The attenuation coefficient characterizes how easily a material or medium can be penetrated by a beam of light. To study the heterogeneity of attenuation coefficient, we fit the decay of intensity within a sliding window of size 40 within regions of high SNR. Contrast, correlation, energy and homogeneity are properties we extracted from gray-level co-occurrence matrices. Those features quantify the texture patterns within OCT images, such as local variation, joint pixel distribution and uniformity. In addition, we also included statistics of pixel distribution, such as SD, skewness and kurtosis, to characterize the OCT images.
Feature extraction was performed in selected regions of interest (ROIs) from each B-scan, with each ROI having a size of 320 by 160 μm and spanning a region containing one tissue type. Four ROIs were selected manually from each B-scan, such that each unique tissue type in the B-scan was included in at least one ROI. The tissue types included in this study were collagen, normal myocardium, adipose and fibrotic myocardium. Distinction between normal and fibrotic myocardium was based on trichrome histology. Normal myocardium was defined as myocardium free of collagen content, while fibrotic myocardium was defined as myocardium containing collagen content. For the ventricles, collagen features were only computed within regions of endocardial thickening due to the inability to obtain a ROI spanning only collagen in regions of very thin endocardium. Statistical differences between groups were examined using a one-way analysis of variance (ANOVA) test with Tukey multiple comparison, in Prism 8, GraphPad. The features were input to a classifier that has been previously described [31].
3 |. RESULTS
3.1 |. Features within ventricles
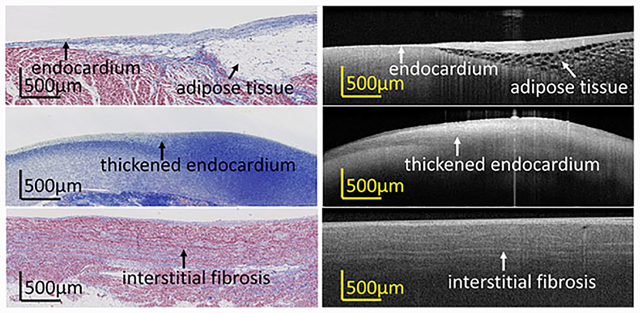
Examination of ventricular OCT images revealed unique features for various tissue types, as shown in Figure 1. Figure 1A–F shows images from ventricular free wall, and Figure 1G–L shows images from the ventricular septum. In normal myocardium as shown in Figure 1A,D,G,J, the endocardium exhibited a narrow and highly backscattering band at the uppermost region of the tissue. The myocardium regions revealed a homogenous pattern in a darker region underneath. Fibrous infiltration was observed in both ventricular free wall and septum, as shown in Figure 1B,E,H,K), with rich collagen content within the myocardium. In diseased hearts with scar, a thickened endocardium as shown in Figure 1C,F was observed. In OCT, the scar region was represented by a highly backscattering region with a heterogeneous distribution of collagen density indicated by slightly varying intensity. In addition, adipose tissue, which is clearly identifiable by a honeycomb texture, occasionally exists in the ventricular septum, as shown in Figure 1I,L. The appearance of adipose tissue in the ventricle can be associated to arrhythmogenic cardiomyopathy.
FIGURE 1.
Optical coherence tomography (OCT) images and corresponding histologic images of multiple substrates within (A-F) ventricular free wall and (G-L) ventricular septum
3.2 |. Features within atria
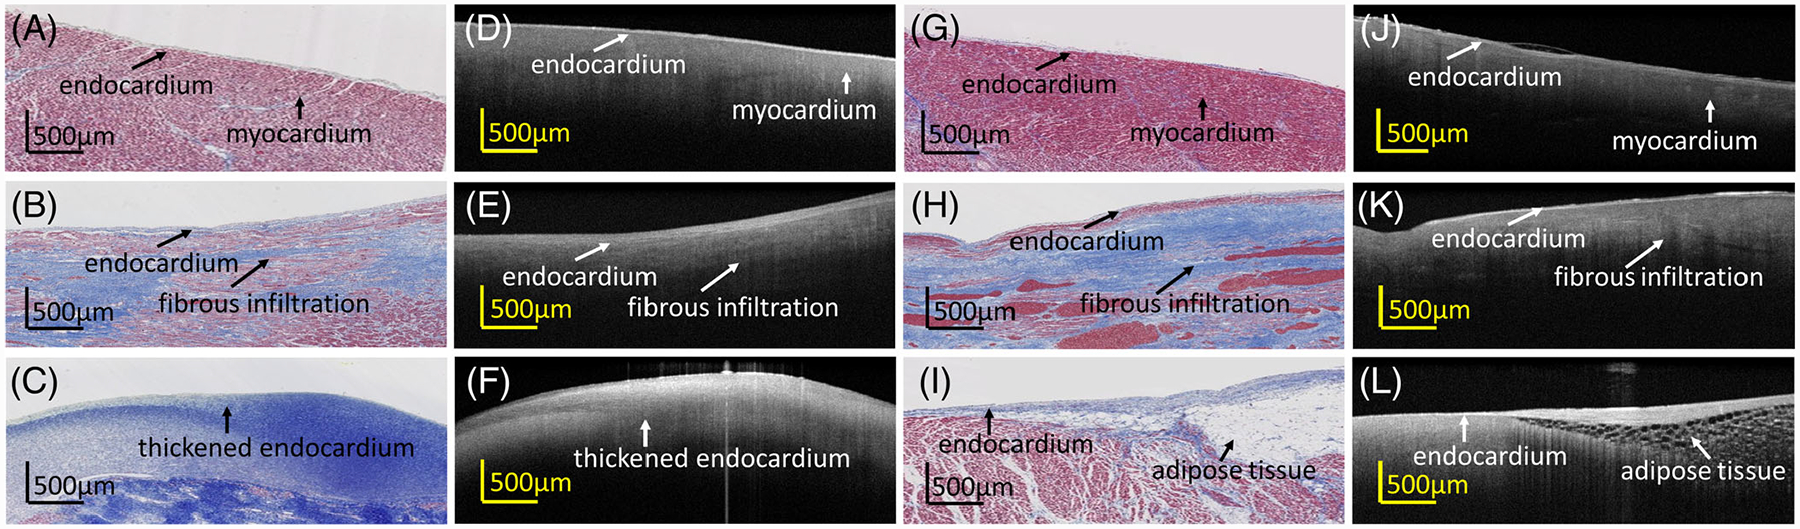
The atria typically have a thicker region of endocardium, which may be composed of varying densities of connective tissue. For example, in Figure 2A,D, the endocardium can be further divided into two categories: dense collagen and loose collagen. The first layer corresponds to a region in which collagen fibers are densely distributed, resulting in a highly backscattering band. The second layer reveals a looser collagen organization. The different densities created a layered pattern within the endocardial region seen in OCT. In the right atria, Figure 2G–L, the endocardial band is typically narrower than those in left atria but thicker than those in ventricle. Owing to the thinner endocardium, which allows photons to penetrate deeper, the myocardium in the right atria often corresponds to a higher intensity in OCT than in the left atria. Adipose tissue, again displaying a honeycomb structure, could also be observed in both the left and right atria.
FIGURE 2.
Optical coherence tomography (OCT) images and corresponding histologic images of multiple substrates within the (A-F) left atrium and (G-L) right atrium
3.3 |. Statistical analysis
We performed a statistical comparison of quantitative features extracted from the OCT images. We first compared the difference in OCT images from different chambers. Three representative features from optical properties (attenuation coefficient), texture (correlation) and pixel distribution (SD) are presented in Figure 3. Results for the other features are provided in the Supplemental Information. In general, we found that similar chambers were similar in attenuation coefficient. For example, in Figure 3A, the pairs that were from the same chamber (LV vs LVS, RV vs RVS) were not significantly different, while pairs that were from similar chambers (LV vs RV, LA vs RA) were still significantly different but with higher P-value than differences between other chambers. Other similarities, such as LVS vs LA and RV vs RVS, were also identified by correlation and SD, with these two chambers showing no significant difference in the multicomparison test after ANOVA for these features. Notice that no single extracted feature could uniquely identify a chamber. There was no significant difference when comparing LVS vs RA in correlation and LA vs RV in SD.
FIGURE 3.
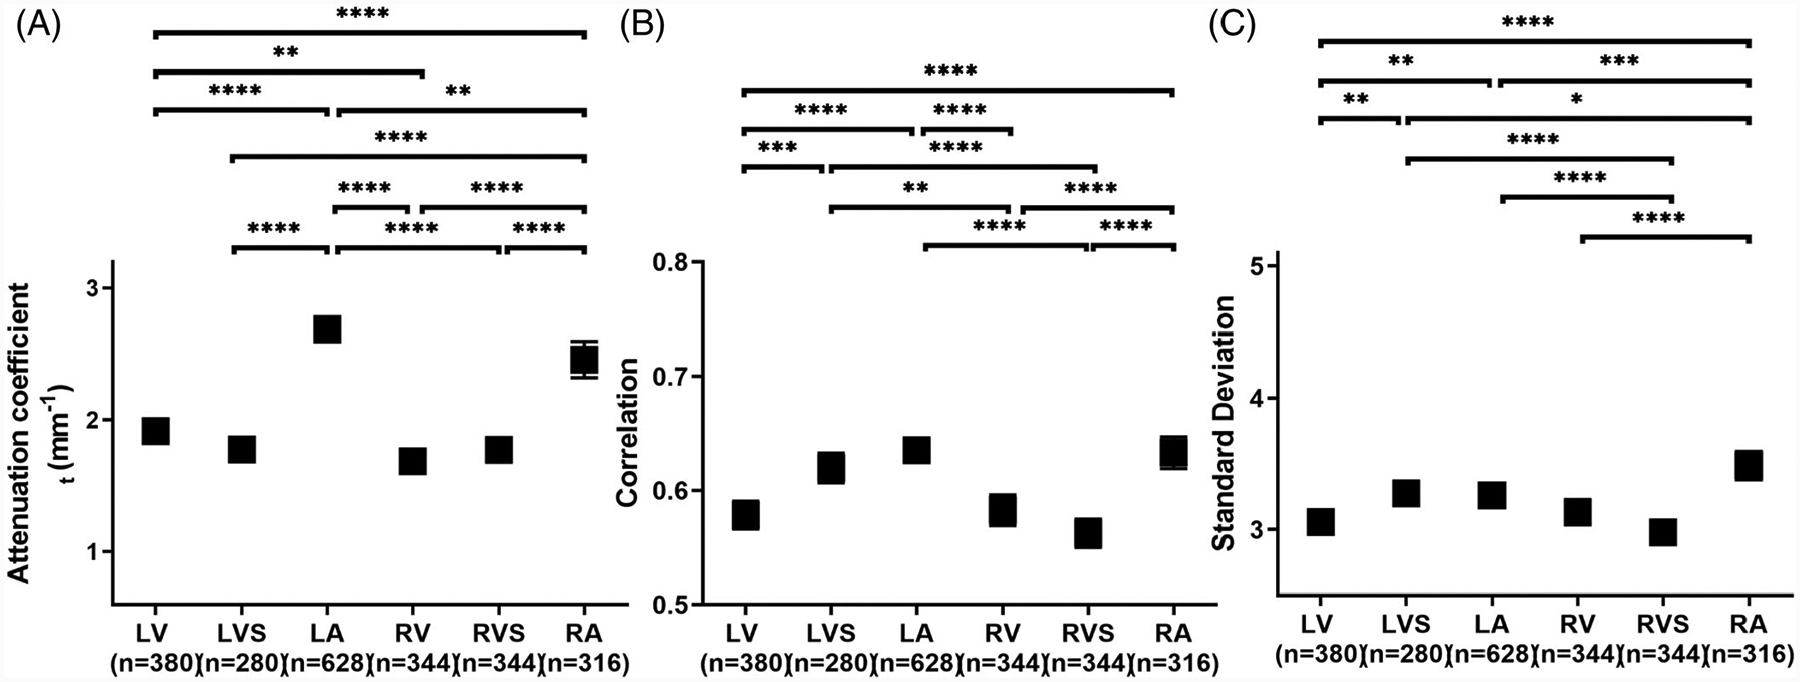
Statistical analysis of three representative features, (A) attenuation coefficient, (B) texture correlation and (C) SD, extracted from human cardiac optical coherence tomography (OCT) images and compared between chambers. Results were averaged over different tissue types. n, the number of regions of interest (ROIs). *P < .5; **P < .01; ***P < .001; ****P < .0001
We also examined the difference in quantitative features among different tissue types. Figure 4 shows representative statistics within atria (A-C) and ventricles (D-F). Results for the other features are provided in the Supplemental Information. We found that adipose tissue was significantly different from all other tissue types for all features in both the atria and ventricles. In ventricle, collagen and fibrotic myocardium were not significantly different in correlation, but were significantly different in attenuation coefficient and SD (both P < .001).
FIGURE 4.
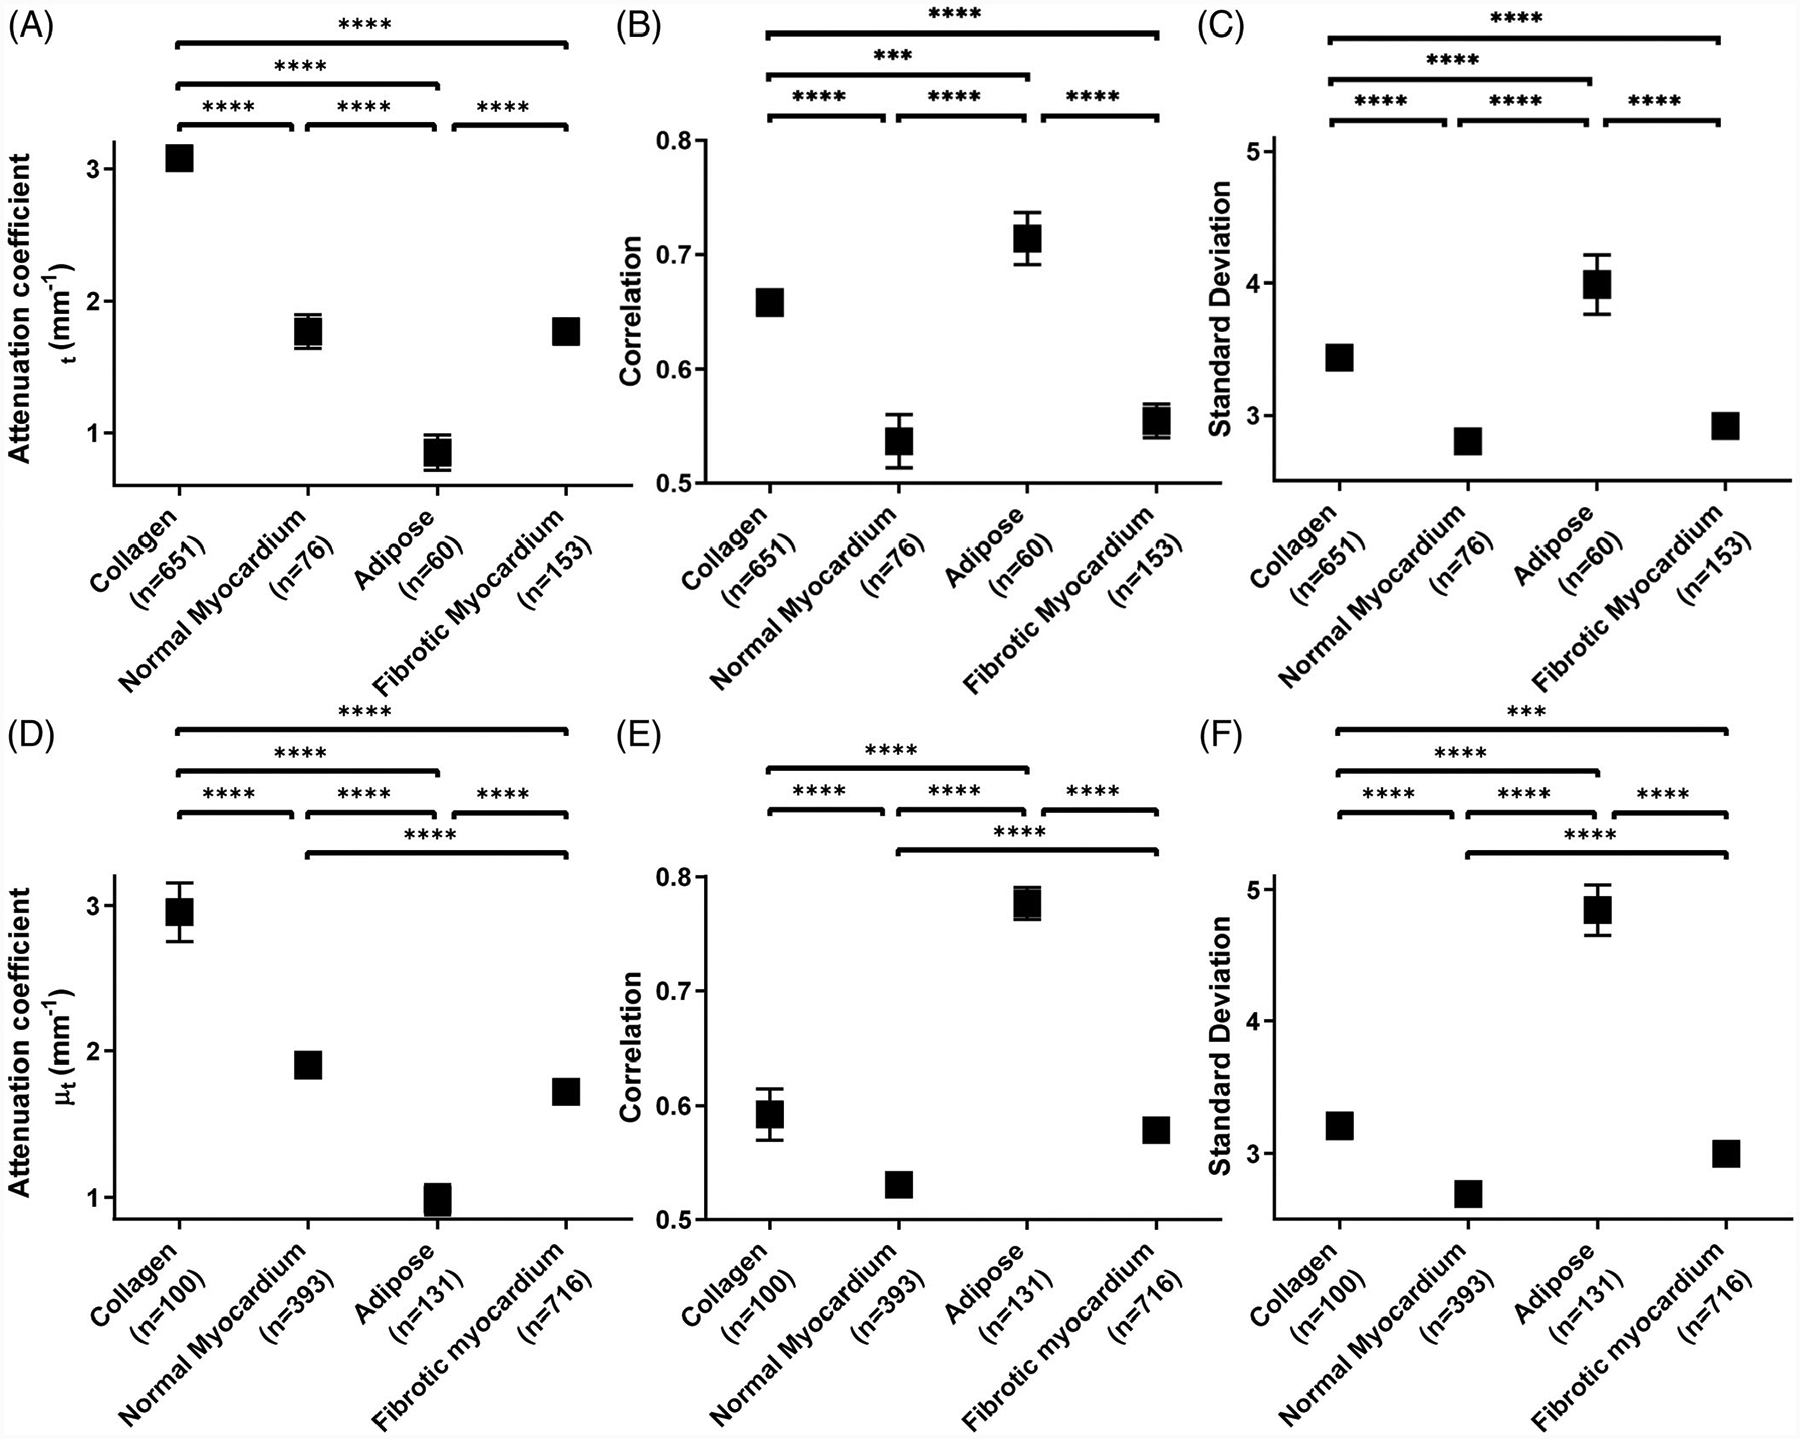
Statistical analysis of three representative features, (A, D) attenuation coefficient, (B, E) texture correlation and (C, F) SD, extracted from human cardiac optical coherence tomography (OCT) images. Comparisons were made between tissue types in (A-C) atria and in (D-F) ventricle. Results were averaged between left and right chambers. n, the number of regions of interest (ROIs). *P < .5; **P < .01; ***P < .001; ****P < .0001
3.4 |. Fibrosis features
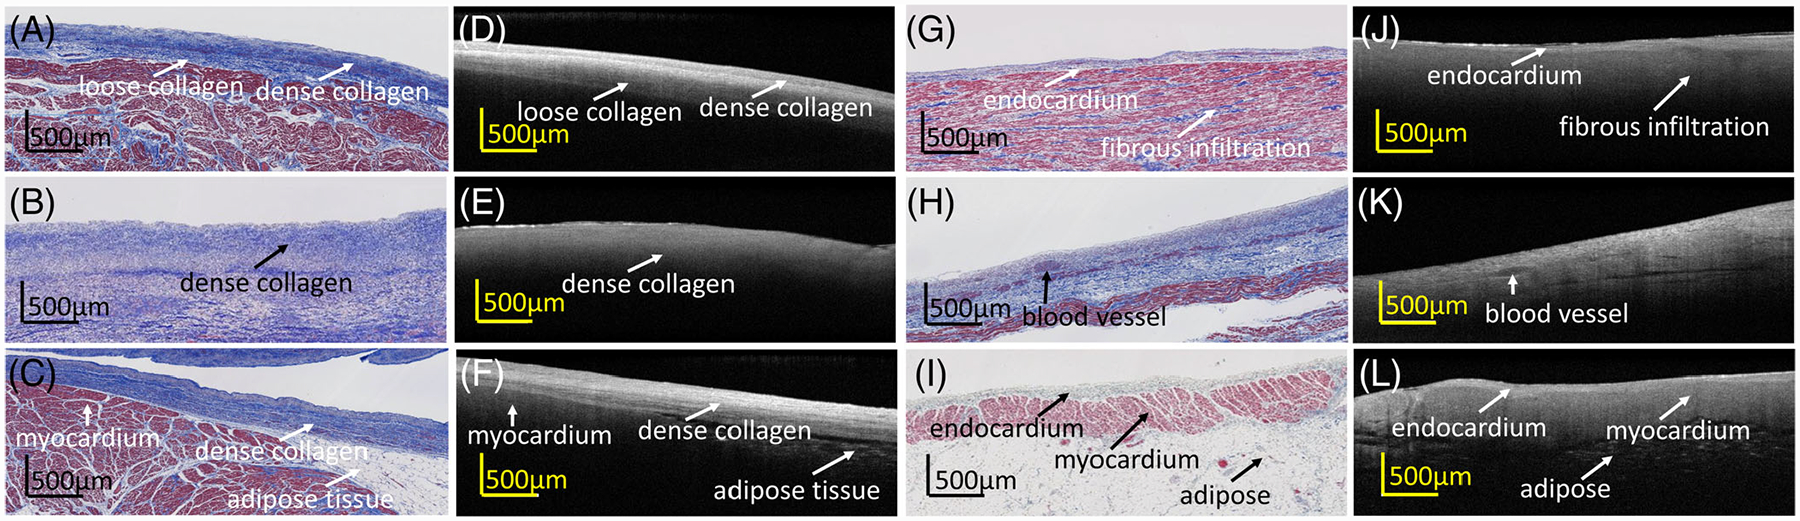
We visually observed different OCT image features when fibrosis was present in myocardial regions. Collagen within the myocardium could sometimes be seen in OCT images as higher intensity regions. For example, as shown in Figure 5A,E, collagen fibers running alongside the myofibers could be seen in OCT as bright, discrete strands. This is also demonstrated within the en face images of Figure 5I,J, with bright striations and patches corresponding to collagen regions. However, in other cases, fibrosis patterns were seen corresponding to decreased penetration depth, as shown in Figures 5B–D,F–H. Fibrotic regions with low backscattering in comparison with the surrounding myocardial region could be seen for both diffuse and compact fibrotic regions, as seen in Figures 5B–D,F–H. In some cases, however, corresponding OCT features to fibrosis as seen from histology were not visually apparent, such as seen in the above Figure 2J.
FIGURE 5.
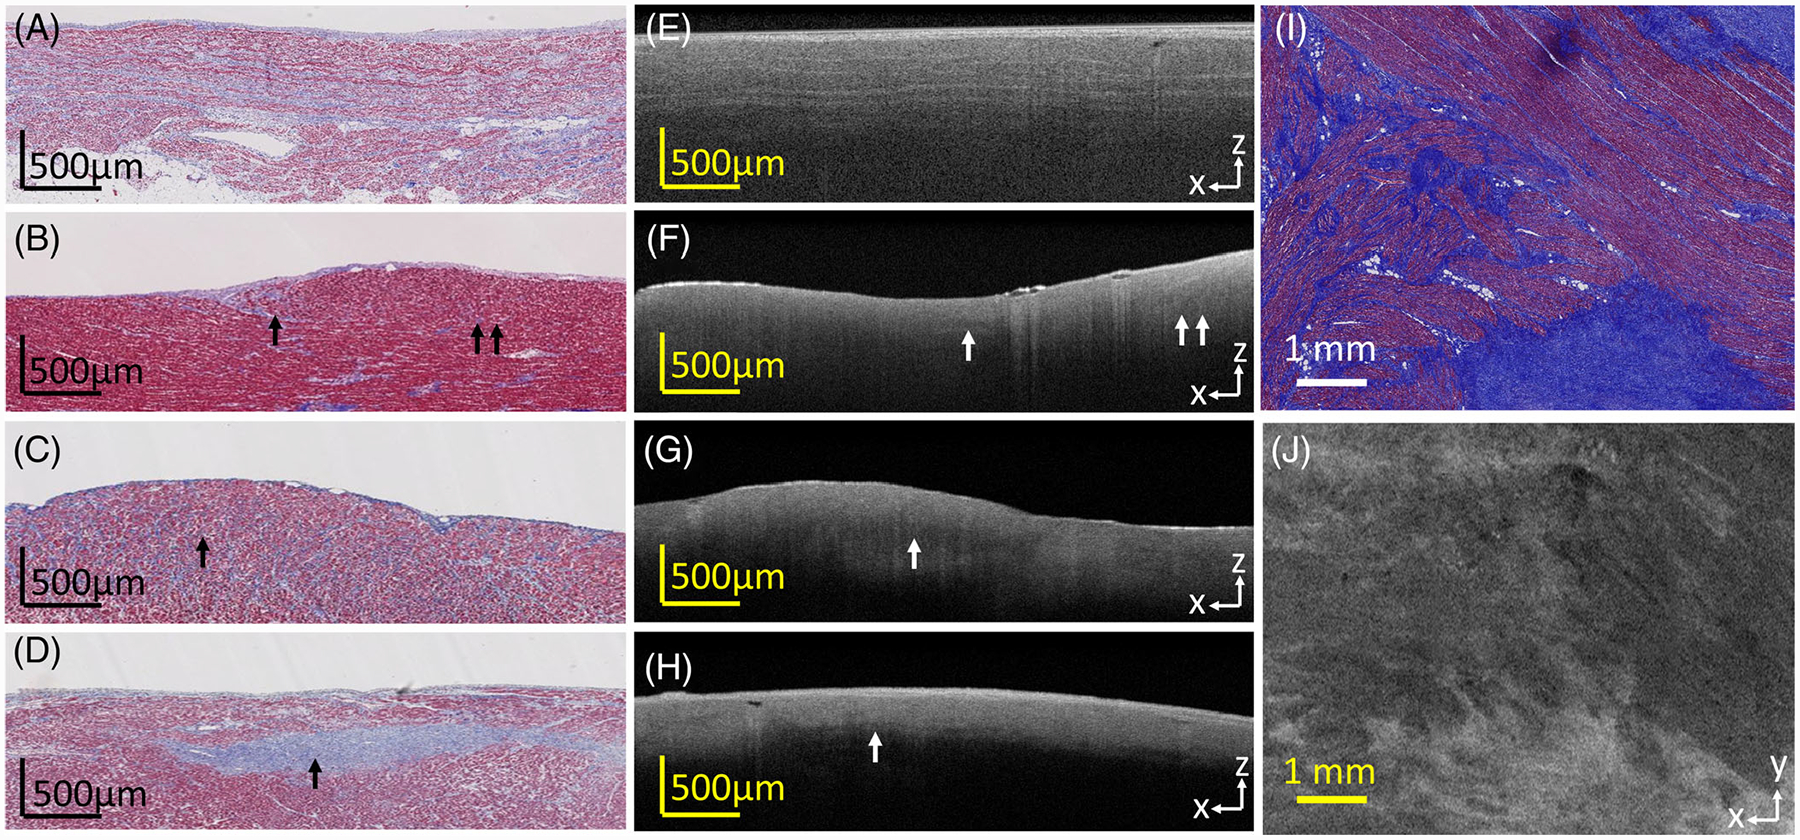
Optical coherence tomography (OCT) images and the corresponding histologic images of fibrosis, showing various fibrosis patterns. (A, E) Interstitial fibrosis, with collagen fibers running alongside myofibers; (B, F) low level of diffuse fibrosis; (C, G) higher level of diffuse fibrosis; (D, H) compact fibrosis region; I, J show fibrosis as seen in the en face plane; A, E, I, J are from the atria; B-D, F-H are from the ventricle
3.5 |. Collagen fiber maps
Collagen fibers could sometimes be seen as bright striations within myocardial regions, as mentioned above. In this case, collagen fiber directionality could be identified. Collagen fibers could be observed under regions of thin endocardium, as has been previously described at the pulmonary vein [32]. As seen in the en face images of Figure 6A,B, regions of endocardium had a smooth appearance, while regions showing collagen fibers in myocardium showed bright striations against a lower intensity background. Crossing patterns of collagen fibers, as well as collagen fibers wrapping around anatomical features such as the pulmonary veins, could be observed. However, in regions under thick endocardium, identification of collagen fibers was limited by imaging depth, and only the endocardial layer with a diffuse fall-off could be identified.
FIGURE 6.
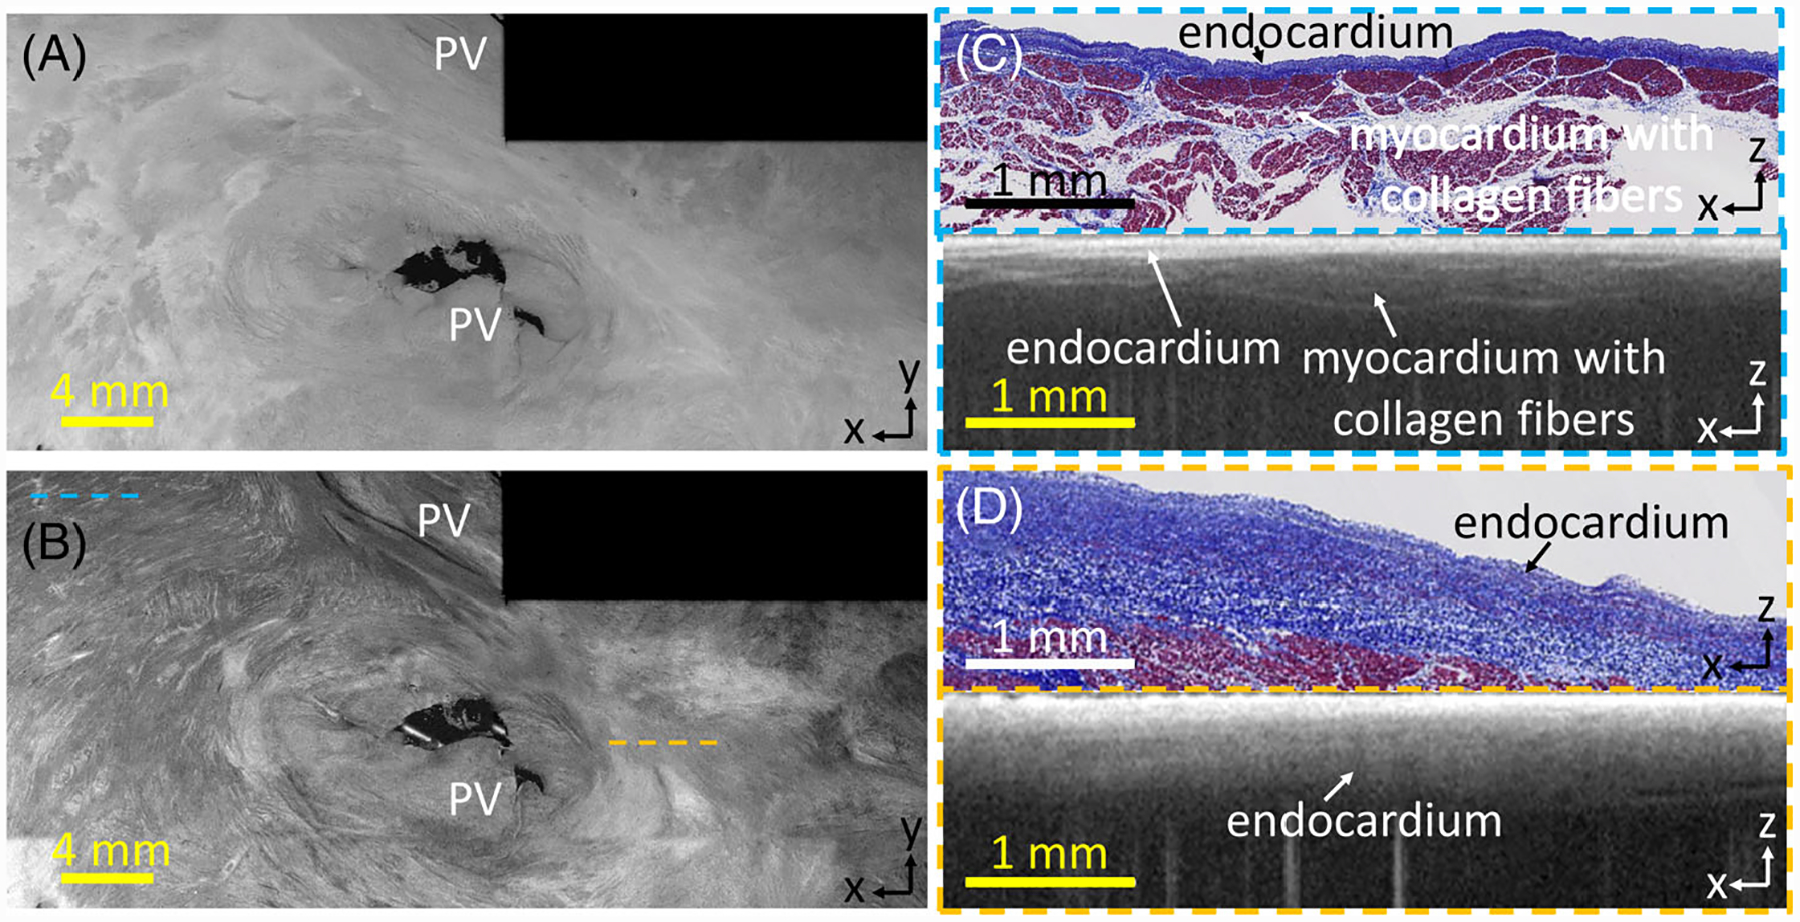
(A) En face optical coherence tomography (OCT) image, 0.07 mm and (B) 0.27 mm from the endocardial surface; (C) histology and corresponding stitched OCT B-scan in region with rich collagen fiber information; (D) histology and corresponding stitched OCT B-scan with thick endocardium and less fiber information
3.6 |. Tissue composition quantification
Human cardiac tissue is heterogeneous, with great variation in tissue types over broad regions. To quantitatively investigate the variation, we ran a Bayesian-based classifier, which we previously developed for B-scan classification [31, 41], to generate an adipose map from a stitched en face OCT image. For this study, a smaller window size and a sliding window were used to obtain smooth transitions between sub-regions. In addition, images were analyzed within the en face images as opposed to the B-scans. The pixels were color coded by the probability of adipose tissue present in the corresponding A-Line. As shown in Figure 7, the application of automated classification provides an approximation of adipose composition in various locations within the cardiac tissue, with regions of dense adipose tissue, such as shown in (ii), being well highlighted.
FIGURE 7.

(A) En face optical coherence tomography (OCT) image, shown 0.27 mm from the endocardial surface; (B) adipose map with a probability of containing adipose tissue in each lateral location; (i) OCT B-scan with collagen; (ii) OCT B-scan with adipose tissue; (iii) OCT B-scan with adipose and collagen fibers. (ii) histology corresponding to the B-scan in (ii). (i)-(iii) correspond to the white lines shown in (a) and (b)
4 |. DISCUSSION
This study presented both qualitative and quantitative descriptions of OCT image features as seen throughout the human heart, including thickened endocardial scar, adipose tissue and fibrosis. Statistical analysis of quantitative image features in different heart chambers and for different tissue types were provided, and an automated algorithm that identified the distribution of adipose from OCT images was demonstrated. OCT imaging of the human heart could be useful for the guidance of ablation procedures or endomyocardial biopsy, or for providing ex vivo, high-resolution detail of cardiac tissue structure as an alternative to histology. To better define the benefits and applications of OCT cardiac imaging, detailed descriptions of OCT imaging in the human heart are required. However, prior work of OCT imaging in the human heart focused on purely qualitative descriptions, on only one specific chamber, or provided features from only a few hearts. This work provides a general description and quantitative analysis of tissues from all chambers of the human heart, from a sample set of 50 human hearts.
OCT imaging has the potential to provide valuable detail of cardiac tissue structure relevant to treatment of cardiac disease. For ablation therapies, OCT-integrated catheters may be able to provide more information on remodeled substrates in real time. Although the structural substrates of arrhythmia may lie deeper than the imaging depth of OCT, the high-resolution structural information provided by OCT could still provide valuable information that can be used in conjunction with more commonly used imaging modalities, which typically do not provide information on tissue composition. As current technology enables the mapping of cardiac anatomy and voltage during ablation procedures [42], OCT imaging could augment such mapping with structural information such as the presence of adipose, endocardial scar or fibrosis. The adipose tissue detection algorithm presented within this study could also be expanded to other tissue types with appropriate training or incorporation of other image processing techniques [31], and the use of automated algorithms to detect different tissue types from OCT could assist in the identification of tissue compositions of interest. For example, tissue heterogeneity has been associated with arrhythmia dynamics [43, 44], and regions with significant amounts of adipose or collagen in the myocardium could be correlated to regions of abnormal electrical activity. The impact of the different biophysical properties of various tissue types, such as adipose or thickened endocardium, on lesion formation could also be considered. Additionally, regions of thickened endocardium imaged by OCT could be correlated to regions of low voltage, or conversely, help confirm the influence of deeper fibrotic tissue in low-voltage regions.
OCT-integrated catheters could also be used to guide endomyocardial biopsy, with high-resolution, real-time imaging enabling the clinician to avoid certain areas or direct their attention to specific features of interest, such as regions of thicker or thinner endocardium or adipose tissue. OCT could also potentially be used as a less invasive alternative to endomyocardial biopsy entirely. Endomyocardial biopsy samples are typically 1 to 2 mm3 in size and thus comparable to the imaging depth of OCT [45]. However, this application would require further study on OCT imaging of features specifically relevant to endomyocardial biopsy. In addition to in vivo applications, OCT could also be useful for high-resolution, ex vivo imaging of cardiac tissue as an alternative to histology, which may be labor-intensive, expensive and induce artifacts. Combined with optical clearing or thick sectioning methods, OCT imaging could provide large-scale image maps of tissue microstructure transmurally through the cardiac wall. These image maps could also be combined with computational modeling to investigate structure-function relationships [46].
Limitations of this study are as follows. OCT imaging of the cardiac tissues was carried out ex vivo. However, in vivo, OCT imaging has been previously achieved using OCT-integrated catheters [34, 35]. Applicability of the results of this study to in vivo imaging will require further investigation of the differences in image quality between the in vivo and ex vivo setting. Second, OCT images were obtained by randomly sampling small regions from each cardiac chamber, thus making it difficult to identify particular patterns of tissue composition over large regions. Third, statistical analysis was carried out on small ROIs within each B-scan, and more discriminating features could be possible by carrying out statistical analysis on fully segmented OCT image volumes.
In the future, imaging over larger regions of entire cardiac chambers and registration of OCT imaging to cardiac anatomy can provide a more comprehensive view of the distribution of tissue types throughout a chamber and any correlation to anatomical regions. Additionally, optical clearing or serial sectioning could be applied to improve imaging depth for ex vivo studies. Tissue properties as identified from OCT could also be correlated to clinical disease, and the identification of fibrotic regions could be improved by the use of polarization-sensitive OCT [27, 30]. Automatic identification of different tissue types can also be improved, with expansion of the adipose tissue detection algorithm to other tissue types and quantification of the detection accuracy over large regions. However, this atlas provides basic guidelines for OCT imaging features of cardiac tissue, which can be used to inform future applications of OCT imaging and image processing in the human heart.
5 |. CONCLUSION
OCT has the potential to characterize features of the myocardium important for evaluating tissue remodeling and arrhythmogenic substrates, such as endocardial thickening, fibrosis and adipose accumulation.
Supplementary Material
ACKNOWLEDGMENTS
The study was funded in part by the National Institute of Health (NIH) 1DP2HL127776-01 (CPH), the National Science Foundation NSF EEC-1342273 (CPH), NSF Career Award 1454365 (CPH), Columbia University Provost Award for Junior Faculty (CPH), and Columbia University Fu Foundation SEAS Presidential Fellowship (THL).
Footnotes
SUPPORTING INFORMATION
Additional supporting information may be found online in the Supporting Information section at the end of this article.
REFERENCES
- [1].Xu J, Murphy SL, Kochanek KD, Bastian B, Arias E National Vital Statistics Reports; 2018, 67. [PubMed] [Google Scholar]
- [2].Benjamin EJ, Virani SS, Callaway CW, Chamberlain AM, Chang AR, Cheng S, Chiuve SE, Cushman M, Delling FN, Deo R, de Ferranti SD, Ferguson JF, Fornage M, Gillespie C, Isasi CR, Jimenez MC, Jordan LC, Judd SE, Lackland D, Lichtman JH, Lisabeth L, Liu S, Longenecker CT, Lutsey PL, Mackey JS, Matchar DB, Matsushita K, Mussolino ME, Nasir K, Flaherty MO, Palaniappan LP, Pandey A, Pandey DK, Reeves MJ, Ritchey MD, Rodriguez CJ, Roth GA, Rosamond WD, Sampson UKA, Satou GM, Shah SH, Spartano NL, Tirschwell DL, Tsao CW, Voeks JH, Willey JZ, Wilkins JT, Wu JH, Alger HM, Wong SS, Muntner P, Circulation 2018, 137, e67. [DOI] [PubMed] [Google Scholar]
- [3].Varnava AM, Elliott PM, Sharma S, McKenna WJ, Davies MJ, Heart 2000, 84, 476. [DOI] [PMC free article] [PubMed] [Google Scholar]
- [4].Zhao J, Hansen BJ, Csepe TA, Lim P, Wang Y, Williams M, Mohler PJ, Janssen PML, Weiss R, Hummel JD, Fedorov VV, Circ. Arrhythm. Electrophysiol 2015, 8, 1514. [DOI] [PMC free article] [PubMed] [Google Scholar]
- [5].Maesen B, Zeemering S, Afonso C, Eckstein J, Burton RA, van Hunnik A, Stuckey DJ, Tyler D, Maessen J, Grau V, Verheule S, Kohl P, Schotten U, Circ. Arrhythm. Electrophysiol 2013, 6, 967. [DOI] [PubMed] [Google Scholar]
- [6].Haissaguerre M, Shah AJ, Cochet H, Hocini M, Dubois R, Efimov I, Vigmond E, Bernus O, Trayanova N, J. Physiol 2016, 594, 2387. [DOI] [PMC free article] [PubMed] [Google Scholar]
- [7].Conrad CH, Brooks WW, Hayes JA, Sen S, Robinson KG, Bing OH, Circulation 1995, 91, 161. [DOI] [PubMed] [Google Scholar]
- [8].Lombardi R, Dong J, Rodriguez G, Bell A, Leung TK, Schwartz RJ, Willerson JT, Brugada R, Marian AJ, Circ. Res 2009, 104, 1076. [DOI] [PMC free article] [PubMed] [Google Scholar]
- [9].Pouliopoulos J, Chik WW, Kanthan A, Sivagangabalan G, Barry MA, Fahmy PN, Midekin C, Lu J, Kizana E, Thomas SP, Thiagalingam A, Kovoor P, Circulation 2013, 128, 2296. [DOI] [PubMed] [Google Scholar]
- [10].Ertl G, Frantz S, Cardiovas. Res 2005, 66, 22. [DOI] [PubMed] [Google Scholar]
- [11].Helm P, Beg MF, Miller MI, Winslow RL, Ann. N.Y. Acad. Sci 2005, 1047, 296. [DOI] [PubMed] [Google Scholar]
- [12].Pashakhanloo F, Herzka DA, Ashikaga H, Mori S, Gai N, Bluemke DA, Trayanova NA, McVeigh ER, Circ. Arrhythm. Electrophysiol 2016, 9, e004133. [DOI] [PMC free article] [PubMed] [Google Scholar]
- [13].Rajiah P, Desai MY, Kwon D, Flamm SD, Radiographics 2013, 33, 1383. [DOI] [PubMed] [Google Scholar]
- [14].Sanaani A, Fuisz A, Cardiol. Clin 2019, 37, 27. [DOI] [PubMed] [Google Scholar]
- [15].Marrouche NF, Wilber D, Hindricks G, Jais P, Akoum N, Marchlinski F, Kholmovski E, Burgon N, Hu N, Mont L, Deneke T, Duytschaever M, Neumann T, Mansour M, Mahnkopf C, Herweg B, Daoud E, Wissner E, Bansmann P, Brachmann J, J. Am. Med. Assoc 2014, 311, 498. [DOI] [PubMed] [Google Scholar]
- [16].Boyle PM, Hakim JB, Zahid S, Franceschi WH, Murphy MJ, Prakosa A, Aronis KN, Zghaib T, Balouch M, Ipek EG, Chrispin J, Berger RD, Ashikaga H, Marine JE, Calkins H, Nazarian S, Spragg DD, Trayanova NA, Front. Physiol 2018, 9, 1151. [DOI] [PMC free article] [PubMed] [Google Scholar]
- [17].Shiozaki AA, Senra T, Arteaga E, Martinelli Filho M, Pita CG, Ávila LFR, Parga Filho JR, Mady C, Kalil-Filho R, Bluemke DA, Rochitte CE, J. Cardiovasc. Comput. Tomogr 2013, 7, 173. [DOI] [PMC free article] [PubMed] [Google Scholar]
- [18].Gosalia A, Haramati LB, Sheth MP, Spindola-Franco H, Am. J. Roentgenol 2004, 182, 1563. [DOI] [PubMed] [Google Scholar]
- [19].Kimura F, Matsuo Y, Nakajima T, Nishikawa T, Kawamura S, Sannohe S, Hagiwara N, Sakai F, Radiographics 2010, 30, 1587. [DOI] [PubMed] [Google Scholar]
- [20].Bouazizi K, Rahhal A, Kusmia S, Evin M, Defrance C, Cluzel P, Berthet M, Atassi F, Leprince P, Lebreton G, Kachenoura N, Hatem SN, Redheuil A, PLoS One 2018, 13, e0205104. [DOI] [PMC free article] [PubMed] [Google Scholar]
- [21].Huang D, Swanson EA, Lin CP, Schuman JS, Stinson WG, Chang W, Hee MR, Flotte T, Gregory K, Puliafito CA, Fujimoto JG, Science 1991, 254, 1178. [DOI] [PMC free article] [PubMed] [Google Scholar]
- [22].Fujimoto J, Drexler W, in Introduction to Optical Coherence Tomography, Vol (Eds: Drexler W, Fujimoto JG), Springer; Berlin Heidelberg, Berlin, Heidelberg, Germany: 2008, p. 1. [Google Scholar]
- [23].Bouma BE, Villiger M, Otsuka K, Oh WY, Biomed. Opt. Express 2017, 8, 2660. [DOI] [PMC free article] [PubMed] [Google Scholar]
- [24].Yabushita H, Bouma BE, Houser SL, Aretz HT, Jang IK, Schlendorf KH, Kauffman CR, Shishkov M, Kang DH, Halpern EF, Tearney GJ, Circulation 2002, 106, 1640. [DOI] [PubMed] [Google Scholar]
- [25].Tearney GJ, Yabushita H, Houser SL, Aretz HT, Jang IK, Schlendorf KH, Kauffman CR, Shishkov M, Halpern EF, Bouma BE, Circulation 2003, 107, 113. [DOI] [PubMed] [Google Scholar]
- [26].Wang Y, Ravanfar M, Zhang K, Duan D, Yao G, J. Biophotonics 2018, 11, e201700284. [DOI] [PubMed] [Google Scholar]
- [27].Wang Y, Zhang K, Duan D, Yao G, Biomed. Opt. Express 2017, 8, 1271. [DOI] [PMC free article] [PubMed] [Google Scholar]
- [28].Goergen CJ, Chen HH, Sakadžić S, Srinivasan VJ, Sosnovik DE, Physiol. Rep 2016, 4, e12894. [DOI] [PMC free article] [PubMed] [Google Scholar]
- [29].Ambrosi CM, Moazami N, Rollins AM, Efimov IR, J. Biomed. Opt 2009, 14, 054002. [DOI] [PMC free article] [PubMed] [Google Scholar]
- [30].Yao X, Gan Y, Ling Y, Marboe CC, Hendon CP, J. Biophotonics 2018, 11, e201700204. [DOI] [PMC free article] [PubMed] [Google Scholar]
- [31].Gan Y, Tsay D, Amir SB, Marboe CC, Hendon CP, J. Biomed. Opt 2016, 21, 101407. [DOI] [PMC free article] [PubMed] [Google Scholar]
- [32].Lye TH, Iyer V, Marboe CC, Hendon CP, Biomed. Opt. Express 2019, 10, 434. [DOI] [PMC free article] [PubMed] [Google Scholar]
- [33].Zhao X, Fu X, Blumenthal C, Wang YT, Jenkins MW, Snyder C, Arruda M, Rollins AM, Biomed. Opt. Express 2018, 9, 6400. [DOI] [PMC free article] [PubMed] [Google Scholar]
- [34].Wang H, Kang W, Carrigan T, Bishop A, Rosenthal N, Arruda M, Rollins AM, J. Biomed. Opt 2011, 16, 110505. [DOI] [PMC free article] [PubMed] [Google Scholar]
- [35].Fleming CP, Rosenthal N, Rollins AM, Arruda MM, J. Innov. Card. Rhythm Manag 2011, 2, 199. [Google Scholar]
- [36].Yu X, Singh-Moon RP, Hendon CP, Appl. Optics 2019, 58, 3823. [DOI] [PubMed] [Google Scholar]
- [37].Fu X, Wang Z, Wang H, Wang YT, Jenkins MW, Rollins AM, Opt. Lett 2014, 39, 5066. [DOI] [PMC free article] [PubMed] [Google Scholar]
- [38].Fleming CP, Wang H, Quan KJ, Rollins AM, J. Biomed. Opt 2010, 15, 030516. [DOI] [PMC free article] [PubMed] [Google Scholar]
- [39].Radu MD, Eur. Heart J 2012, 33, 1174. [DOI] [PubMed] [Google Scholar]
- [40].Landry DA, Optical Coherence Tomography: A Clinical Atlas of Retinal Images, Bryson Taylor Publishing, Saco, ME: 2011. [Google Scholar]
- [41].Yao X, Gan Y, Chang E, Hibshoosh H, Feldman S, Hendon C, Lasers Surg. Med 2017, 49, 258. [DOI] [PMC free article] [PubMed] [Google Scholar]
- [42].Rolf S, Hindricks G, Sommer P, Richter S, Arya A, Bollmann A, Kosiuk J, Koutalas E, Atr J. Fibrillation 2014, 7, 1140. [DOI] [PMC free article] [PubMed] [Google Scholar]
- [43].Anumonwo JMB, Herron T, Front. Physiol 2018, 9, 2. [DOI] [PMC free article] [PubMed] [Google Scholar]
- [44].de Jong S, van Veen TAB, van Rijen HVM, de Bakker JMT, J. Cardiovasc. Pharmacol 2011, 57, 630. [DOI] [PubMed] [Google Scholar]
- [45].Cooper LT, Baughman KL, Feldman AM, Frustaci A, Jessup M, Kuhl U, Levine GN, Narula J, Starling RC, Towbin J, Virmani R, J. Am. Coll. Cardiol 2007, 50, 1914. [DOI] [PubMed] [Google Scholar]
- [46].Lye TH, Vincent KP, McCulloch AD, Hendon CP, Biophys. J 2018, 114, 1477. [DOI] [PMC free article] [PubMed] [Google Scholar]
Associated Data
This section collects any data citations, data availability statements, or supplementary materials included in this article.