

Abstract
A rapid and reliable UPLC-MS/MS method was developed and validated for the simultaneous quantification of thirteen bioactive compounds (luteolin, cynaroside, luteolin 7-O-glucuronide, isochlorogenic acid C, chlorogenic acid, cryptochlorogenic acid, apigenin, apigenin 7-glucoside, acacetin, hyperoside, isoquercitrin, tilianin, and hesperidin) in rat plasma. The compounds were separated on an ACQUITY UPLC BEH C18 column (2.1 × 100 mm, 1.7 μm) with a gradient mobile phase system of acetonitrile and 0.1% (v/v) formic acid aqueous solution at a flow rate of 0.3 mL/min. All compounds were quantitated using Agilent Jet Stream electrospray ionization (AJS ESI) in a negative ion mode. The lower limit of quantification (LLOQ) for all compounds was below 5 ng/mL. The intra- and interday accuracy ranged from -13.0% to 14.0%, and precisions were less than 12.2%. The extraction recoveries of the compounds were in the range of 56.9% to 95.0%, and the matrix effect ranged between 71.6% and 109.3%. Stability studies proved that the thirteen compounds were stable under tested conditions, with a relative standard deviation (RSD) of less than 11.4%. This developed method was successfully applied to the pharmacokinetic study of the 13 bioactive compounds after oral administration of Flos Chrysanthemi extract in rat by UPLC-MS/MS. Pharmacokinetic parameters of 8 out of the 13 compounds investigated are presented in this paper.
1. Introduction
Flos Chrysanthemi is a dried capitulum belonging to the Compositae family and is native to Asia and northeastern Europe [1–3]. There are 7 different varieties of Flos Chrysanthemi, namely, Haoju, Chuju, Gongju, Hangju (Dabaiju, Huju, and Xiaobaiju), and Huaiju [4]. As a traditional Chinese medicine and popular herbal tea in China, Flos Chrysanthemi is commonly used to dispel wind, reduce heat, calm a hyperactive liver, and improve eyesight [4, 5]. Various studies have identified three different types of bioactive compounds in Flos Chrysanthemi, namely, flavonoids, caffeic acid, and phenolics, which provide a series of pharmacological actions such as antioxidative activity, anti-inflammatory activity, anticancer activity, lipid-lowering effect in a fatty liver, and antiangiogenic activity [6–13].
Pharmacokinetics plays an important role in drug development by quantitatively describing various dynamic processes in the body. At present, there are a few pharmacokinetic studies on luteolin, apigenin, diosmetin, and chrysoeriol in oral Flos Chrysanthemi extract [14–16]. The pharmacokinetics of Flos Chrysanthemi has not been comprehensively evaluated in the existing studies because its extract contains a wide variety of chemical compounds. Hence, it is of relevance to further research the pharmacokinetics of various ingredients in rat plasma after the oral intake of Flos Chrysanthemi extract.
This research develops a sensitive and reliable UPLC-MS/MS method for the determination of thirteen compounds in rat plasma after oral administration of Flos Chrysanthemi extract. In addition, this is the first pharmacokinetic study on the chemical components luteolin 7-O-glucuronide and apigenin 7-glucoside. This study would provide reference for further pharmacological studies on Flos Chrysanthemi extract.
2. Experimental
2.1. Chemicals, Reagents, and Materials
Acetonitrile (Thermo Fisher Scientific, Fair Lawn, NJ, USA), methanol (Thermo Fisher Scientific, Fair Lawn, NJ, USA), and formic acid (ROE SCIENTIFIC INC, Newark, USA, MO, USA) were of HPLC grade. Water used in the experiment was purified with Milli-Q advanced ultrapure water system (Millipore, Milford, MA, USA). Luteolin, cynaroside, luteolin 7-O-glucuronide, isochlorogenic acid C, chlorogenic acid, cryptochlorogenic acid, apigenin, apigenin 7-glucoside, acacetin, hyperoside, isoquercitrin, tilianin, hesperidin, and icariin (internal standard (IS)) (purity ≥ 99%) were purchased from Chengdu Must Bio-Technology Co., Ltd. (Chengdu, China).
2.2. Apparatus and Analytical Conditions
The UPLC-MS/MS system was made up of Agilent 1290 UPLC combined with an Agilent 6470 series triple quadrupole mass spectrometer, and AJS ESI was selected as a source. The chromatographic separation was performed on an ACQUITY UPLC BEH C18 (2.1 × 100 mm, 1.7 μm) column, set at 20°C. Mobile phases used were 0.1% (v/v) formic acid in water (A) and acetonitrile (B). The following elution gradient was used: 0-2 min, 2%-25% B; 2-4 min, 25%-26% B; 4-9 min, 26%-75% B; and 9-10 min, 75%-90% B. The flow rate was maintained at 0.3 mL/min, and a 5 μL sample was injected each time. Quantitative parameters are displayed in Table 1. And the chemical structures of 13 ingredients are shown in Figure 1.
Table 1.
Mass spectra properties of 13 analytes and IS.
| Compounds | Precursor ion (m/z) | Product ion (m/z) | Frag. (V) | C.E. (V) |
|---|---|---|---|---|
| Chlorogenic acid | 353.1 | 191.0 | 98 | 20 |
| Cryptochlorogenic acid | 353.1 | 173.0 | 108 | 16 |
| Cynaroside | 449.1 | 286.9 | 113 | 24 |
| Tilianin | 447.1 | 285.0 | 128 | 20 |
| Luteolin 7-O-glucuronide | 461.1 | 285.0 | 141 | 24 |
| Apigenin 7-glucoside | 431.1 | 268.0 | 189 | 36 |
| Isochlorogenic acid C | 515.1 | 173.0 | 123 | 32 |
| Luteolin | 285.0 | 133.0 | 151 | 40 |
| Apigenin | 269.0 | 117.0 | 141 | 36 |
| Hesperidin | 609.2 | 301.0 | 146 | 28 |
| Isoquercitrin | 463.1 | 300.0 | 151 | 32 |
| Hyperoside | 463.1 | 270.9 | 156 | 52 |
| Acacetin | 283.1 | 268.0 | 128 | 24 |
| Icariin (IS) | 675.2 | 513.1 | 194 | 28 |
Figure 1.
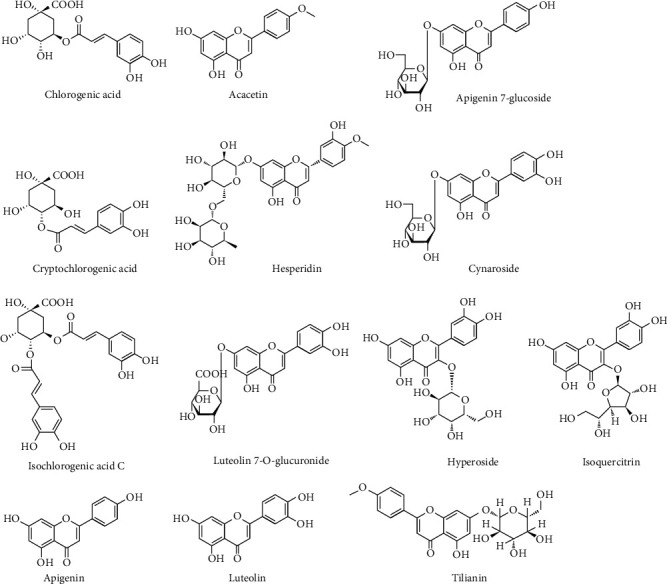
The chemical structures of the 13 ingredients.
2.3. The Acquisition of Flos Chrysanthemi Extract
To prepare the Flos Chrysanthemi extract, 1000 g of Flos Chrysanthemi powder was weighed and extracted twice using 14 L of 70% (v/v) ethanol via reflux for 80 min each time, according to Chinese Pharmacopoeia (2015). The extracted solutions were then filtered, mixed, and evaporated under reduced pressure. The Flos Chrysanthemi extract was pressed into powder and stored in a dryer until analysis. The extract contained luteolin, cynaroside, luteolin 7-O-glucuronide, isochlorogenic acid C, chlorogenic acid, cryptochlorogenic acid, apigenin, apigenin 7-glucoside, acacetin, hyperoside, isoquercitrin, tilianin, and hesperidin at 14.00, 17.11, 1.63, 5.18, 3.10, 0.65, 0.70, 3.89, 0.01, 0.01, 0.01, 0.21, and 0.22 mg/g, respectively.
2.4. Stock and Working Solution
Stock solutions of luteolin, cynaroside, luteolin 7-O-glucuronide, isochlorogenic acid C, chlorogenic acid, cryptochlorogenic acid, apigenin, apigenin 7-glucoside, acacetin, hyperoside, isoquercitrin, tilianin, hesperidin, and icariin (internal standard solution) were prepared individually and diluted to 1 mg/mL with methanol. Appropriate amounts of the 13 different stock solutions were added together in methanol for the mixed standard solution. The calibration solutions were prepared by adding 20 μL IS and appropriate volumes of mixed standard solution into 100 μL blank rat plasma. Low, medium, and high concentrations of quality control (QC) samples consisting of appropriate mixed standard solutions and blank plasma sample, adjusted to desired concentrations, were selected as calibration solutions. These solutions were kept at 4°C.
2.5. Sample Preparation
20 μL methanol (volume corresponding to that of QC samples and calibration curve) and 20 μL IS (1 μg/mL) were added into 100 μL plasma sample, which was then vortex-mixed with 400 μL acetonitrile for 3 min. The mixed solution was then centrifuged for 10 min at 14,000 rpm. After collecting the supernatant in a clean Eppendorf tube, the supernatant was evaporated to dryness under a gentle stream of nitrogen gas. The residue was dissolved in 100 μL methanol, vortex-mixed for 3 min, and then centrifuged for 10 min at 14,000 rpm. Finally, 5 μL supernatant was used for analysis by the UPLC-MS/MS system.
2.6. Method Validation
2.6.1. Specificity
Plasma samples acquired at 0.08 h after oral administration of Flos Chrysanthemi extract were compared to spiked plasma samples (containing working solutions and IS) and blank plasma samples from six different rats to evaluate method specificity and identify endogenous interfering substances.
2.6.2. The Calibration Curves and LLOQ
Blank rat plasma individually spiked with different concentrations of mixed standard solution and IS was quantitatively measured for three consecutive days, in replica, to validate the linearity. Calibration curves were drawn with peak-area ratios (y) of analyte relative to IS against its minimal concentration (x). The weighting factor was1/x2. The lowest limit of quantification (LLOQ) was calculated based on a signal-to-noise ratio of approximately 10 (S/N ≥ 10).
2.6.3. Precision and Accuracy
Intra- and interday precision and accuracy were estimated by analysing six duplicated QC samples at different concentrations as follows: 1, 10, and 200 ng/mL for tilianin and hesperidin; 5, 50, and 1000 ng/mL for isochlorogenic acid C, chlorogenic acid, cryptochlorogenic acid, apigenin, apigenin 7-glucoside, acacetin, hyperoside, and isoquercitrin; 10, 100, and 2000 ng/mL for luteolin 7-O-glucuronide; and 20, 200, and 4000 ng/mL for luteolin and cynaroside. A standard calibration curve was plotted based on the above readings. Intraday and interday precisions were measured by RSD, and accuracy was measured by relative error (RE) of respective readings.
2.6.4. The Recovery and Matrix Effect
Mixed working solution with IS, extracted samples of plasma samples spiked with mixed working solution and IS, and postextraction blank samples (containing IS) spiked with mixed working solution of three QC concentrations were quantitatively analysed in the same assay. Recovery was measured with peak-area differences between the corresponding extraction and postextraction spiked samples. A matrix effect was measured with peak-area differences between the corresponding extraction samples and mixed working solution. Six parallel experiments were performed in total.
2.6.5. Stability
To study the stability of all compounds in rat plasma, low, medium, and high concentrations of QC samples were tested under the following test conditions: stored at an autosampler for 12 hours, stored at room temperature for 6 hours, put through three freeze/thaw cycles, and stored at -80°C for 14 days. Three QC concentrations were tested for each of the above conditions.
2.7. The Study of Pharmacokinetics
Six male Sprague-Dawley rats (250 ± 5 g) were purchased from Huafukang Bioscience Co., Inc. (Beijing, China). The rats were adapted to the facility for a week. Before the experiments, rats were fasted for 12 h, although drinking water was readily accessible. Flos Chrysanthemi extract was dissolved in CMC-Na aqueous solution and orally administered to the animals once at 10 g/kg. Blood samples (220 μL) were taken from the orbital venous plexus of rats at 0, 0.03, 0.08, 0.17, 0.25, 0.5, 1, 2, 4, 6, 8, 10, 12, and 24 h after extract administration. Blood samples were promptly centrifuged at 6000 rpm for 10 min, and plasma samples were collected. The obtained plasma was stored at -80°C until analysis. “Drug and Statistics 3.0” software (Medical College of Wannan, China) was used to calculate pharmacokinetic parameters. The animal protocol was approved by the Animal Ethics Committee of Tianjin University of Traditional Chinese Medicine (TCM-LAEC20190056).
3. Results
3.1. LC-MS/MS Optimization
Various types of mobile phases were investigated for optimal separation of the 13 compounds, such as the use of acetonitrile or methanol as mobile (B) and 0.05% or 0.1% formic acid in water as mobile (A). Experimental results showed that acetonitrile (B) and 0.1% (v/v) formic acid in water (A) provided better peak shapes and reduced separation timings. Both positive and negative ion modes of the AJS ESI source were experimented for optimal mass spectrometry results. A negative ion mode showed greater signal intensity; thus, the thirteen compounds were quantitated with AJS ESI in the negative ion mode.
3.2. Sample Preparation
In the study, we identified two simple and efficient methods for processing plasma samples: protein precipitation and liquid-liquid extraction. The ethyl acetate liquid-liquid extraction method provided better recovery of flavonoids, but the recoveries of chlorogenic acid, cryptochlorogenic acid, and isochlorogenic acid C were poor. The effects of methanol and acetonitrile on protein precipitation were then compared, and the results demonstrated that acetonitrile precipitation produced better recovery rates.
3.3. Method Validation of Bioanalysis
3.3.1. Specificity
The respective chromatograms were compared to evaluate method specificity based on analyte retention times and the presence of interference peaks. Figure 2 shows chromatograms of (a) blank plasma samples, (b) blank plasma samples spiked with analytes and IS, and (c) plasma sample collected after oral administration of Flos Chrysanthemi extract. Results showed consistent retention times and no interference peaks for all analytes across samples.
Figure 2.
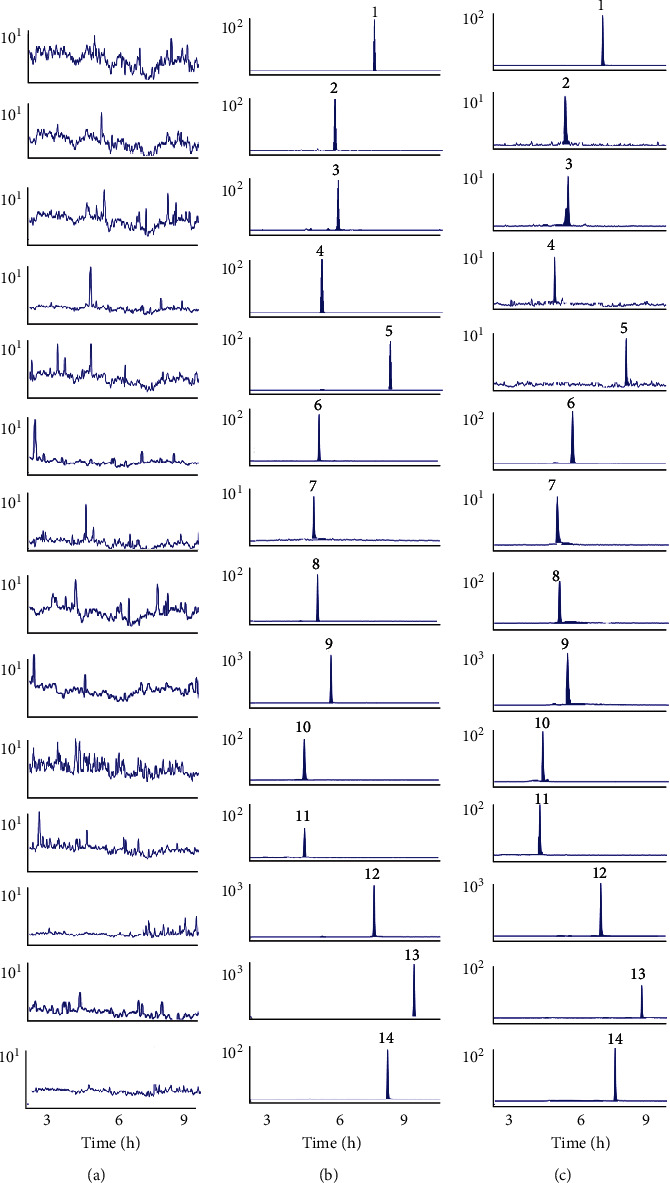
MRM chromatograms of hesperidin (1), isochlorogenic acid C (2), isoquercitrin (3), hyperoside (4), luteolin 7-O-glucuronide (5), cynaroside (6), tilianin (7), apigenin 7-glucoside (8), chlorogenic acid (9), cryptochlorogenic acid (10), luteolin (11), acacetin (12), apigenin (13), and IS (14). (a) Blank rat plasma chromatograms, (b) blank rat plasma samples added to chemical compounds and IS, and (c) plasma samples after oral Flos Chrysanthemi extract administration.
3.3.2. Linearity and LLOQ
Values of LLOQs and calibration curves are displayed in Table 2. The range of calibration curves for tilianin and hesperidin was 1-200 ng/mL; for isochlorogenic acid C, cryptochlorogenic acid, chlorogenic acid, apigenin, acacetin, hyperoside, isoquercitrin, and apigenin 7-glucoside, it was 5-1000 ng/mL; for luteolin 7-O-glucuronide, it was 10-2000 ng/mL; and for luteolin and cynaroside, it was 20-4000 ng/mL. Results showed that the compounds exhibited good linearity in the linear range r2 > 0.9919. LLOQs were all below 5 ng/mL, indicating high sensitivity.
Table 2.
Calibration curves, correlation coefficients, linear ranges, and LLOQ of the 13 analytes.
| Compounds | Calibration curves | Correlation coefficients (r2) | Linear range (ng/mL) | LLOQ (ng/mL) |
|---|---|---|---|---|
| Luteolin | Y = 6.422005X + 0.176762 | 0.9964 | 20.0-4000.0 | 0.1 |
| Cynaroside | Y = 0.047193X + 0.015018 | 0.9937 | 20.0-4000.0 | 0.1 |
| Luteolin 7-O-glucuronide | Y = 6.507693X + 0.091156 | 0.9927 | 10.0-2000.0 | 2.0 |
| Isochlorogenic acid C | Y = 2.288985X + 0.006645 | 0.9919 | 5.0-1000.0 | 5.0 |
| Cryptochlorogenic acid | Y = 3.232775X − 0.004798 | 0.9990 | 5.0-1000.0 | 5.0 |
| Chlorogenic acid | Y = 8.628364X + 0.060601 | 0.9943 | 5.0-1000.0 | 0.2 |
| Apigenin | Y = 8.015200X + 0.032229 | 0.9993 | 5.0-1000.0 | 0.2 |
| Acacetin | Y = 63.711025X + 1.046168 | 0.9984 | 5.0-1000.0 | 0.1 |
| Hyperoside | Y = 7.003472X + 0.008604 | 0.9953 | 5.0-1000.0 | 0.2 |
| Isoquercitrin | Y = 14.354529X + 0.013019 | 0.9958 | 5.0-1000.0 | 0.2 |
| Apigenin 7-glucoside | Y = 20.395291X + 0.169449 | 0.9989 | 5.0-1000.0 | 0.1 |
| Tilianin | Y = 53.090940X + 0.077200 | 0.9924 | 1.0-200.0 | 0.1 |
| Hesperidin | Y = 4.330534X − 0.008981 | 0.9975 | 1.0-200.0 | 1.0 |
3.3.3. Precision and Accuracy
The intraday and interday precision and accuracy were measured with six replicates of QC samples, with analytes set at low, medium, and high concentrations as described above. The results of the analysis are shown in Table 3. Accuracy (RE) ranged from -13.0% to 14.0%, and precision (RSD) ranged from 0.4% to 12.2%, indicating that the developed method was reliable.
Table 3.
Precision and accuracy of 13 analytes in rat plasma (n = 6).
| Compounds | Spiked concentration (ng/mL) | Intraday | Interday | ||||
|---|---|---|---|---|---|---|---|
| Measured concentration (ng/mL) | Accuracy (RE, %) | Precision (RSD, %) | Measured concentration (ng/mL) | Accuracy (RE, %) | Precision (RSD, %) | ||
| Luteolin | 20 | 20.0 ± 0.4 | 0.0 | 2.0 | 20.4 ± 0.2 | 2.0 | 1.0 |
| 200 | 187.6 ± 1.6 | -6.2 | 0.9 | 188.5 ± 2.5 | -5.8 | 1.3 | |
| 4000 | 4083.2 ± 46.1 | 2.1 | 1.1 | 4110.2 ± 65.5 | 2.8 | 1.6 | |
| Cynaroside | 20 | 20.9 ± 0.9 | 4.5 | 4.3 | 20.5 ± 0.8 | 2.5 | 3.9 |
| 200 | 208.1 ± 2.1 | 4.1 | 1.0 | 201.0 ± 0.9 | 0.5 | 0.4 | |
| 4000 | 3903.5 ± 58.1 | -2.4 | 1.5 | 3921.2 ± 39.8 | -2.0 | 1.0 | |
| Luteolin 7-O-glucuronide | 10 | 9.0 ± 0.5 | -10.0 | 5.6 | 8.9 ± 0.4 | -10.0 | 4.5 |
| 100 | 88.5 ± 0.6 | -11.5 | 0.7 | 89.1 ± 2.1 | -10.9 | 2.4 | |
| 2000 | 1840.1 ± 27.1 | -8.0 | 1.5 | 1848.2 ± 36.6 | -7.6 | 2.0 | |
| Isochlorogenic acid C | 5 | 4.6 ± 0.2 | -8.0 | 4.3 | 4.9 ± 0.3 | -2.0 | 6.1 |
| 50 | 44.4 ± 1.0 | -11.2 | 2.3 | 45.1 ± 1.3 | -9.8 | 2.9 | |
| 1000 | 1019.6 ± 26.6 | 2.0 | 2.6 | 1019.9 ± 34.6 | 2.0 | 3.4 | |
| Cryptochlorogenic acid | 5 | 5.0 ± 0.2 | 0.0 | 4.0 | 5.0 ± 0.1 | 0.0 | 2.0 |
| 50 | 44.0 ± 0.9 | -12.0 | 2.0 | 44.2 ± 0.8 | -11.6 | 1.8 | |
| 1000 | 1031.4 ± 24.1 | 3.1 | 2.3 | 1031.8 ± 25.0 | 3.2 | 2.4 | |
| Chlorogenic acid | 5 | 4.9 ± 0.3 | -2.0 | 6.1 | 5.0 ± 0.3 | 0.0 | 6.0 |
| 50 | 46.7 ± 2.2 | -6.6 | 4.7 | 47.3 ± 2.2 | -5.4 | 4.7 | |
| 1000 | 1057.8 ± 21.6 | 5.8 | 2.0 | 1074.5 ± 27.7 | 7.5 | 2.6 | |
| Apigenin | 5 | 5.6 ± 0.1 | 12.0 | 1.8 | 5.6 ± 0.1 | 12.0 | 1.8 |
| 50 | 44.5 ± 1.2 | -11.0 | 2.7 | 45.3 ± 1.2 | -9.4 | 2.6 | |
| 1000 | 1043.9 ± 35.9 | 4.4 | 3.4 | 1048.8 ± 30.5 | 4.9 | 2.9 | |
| Acacetin | 5 | 5.5 ± 0.2 | 10.0 | 3.6 | 4.9 ± 0.6 | -2.0 | 12.2 |
| 50 | 45.1 ± 0.7 | -9.8 | 1.6 | 45.3 ± 1.1 | -9.4 | 2.4 | |
| 1000 | 1038.1 ± 26.0 | 3.8 | 2.5 | 1044.8 ± 23.6 | 4.5 | 2.3 | |
| Hyperoside | 5 | 4.6 ± 0.1 | -8.0 | 2.2 | 4.7 ± 0.2 | -6.0 | 4.3 |
| 50 | 45.8 ± 1.1 | -8.4 | 2.4 | 45.9 ± 1.3 | -8.2 | 2.8 | |
| 1000 | 1019.7 ± 46.4 | 2.0 | 4.6 | 1032.2 ± 40.9 | 3.2 | 4.0 | |
| Isoquercitrin | 5 | 4.8 ± 0.2 | -4.0 | 4.2 | 4.9 ± 0.2 | -2.0 | 4.1 |
| 50 | 44.8 ± 0.5 | -10.4 | 1.1 | 45.5 ± 1.1 | -9.0 | 2.4 | |
| 1000 | 944.6 ± 41.8 | -5.5 | 4.4 | 1000.7 ± 30.1 | 0.1 | 3.0 | |
| Apigenin 7-glucoside | 5 | 5.7 ± 0.1 | 14.0 | 1.8 | 5.7 ± 0.1 | 14.0 | 1.8 |
| 50 | 45.6 ± 1.0 | -8.8 | 2.2 | 45.5 ± 1.0 | -9.0 | 2.2 | |
| 1000 | 1078.0 ± 26.9 | 7.8 | 2.5 | 1070.0 ± 34.2 | 7.0 | 3.2 | |
| Tilianin | 1 | 0.9 ± 0.1 | -10.0 | 11.1 | 0.9 ± 0.1 | -10.0 | 11.1 |
| 10 | 9.7 ± 0.4 | -3.0 | 4.1 | 9.8 ± 0.4 | -2.0 | 4.1 | |
| 200 | 201.7 ± 2.5 | 0.8 | 1.2 | 200.7 ± 3.9 | 0.3 | 1.9 | |
| Hesperidin | 1 | 1.1 ± 0.1 | 10.0 | 9.1 | 1.1 ± 0.1 | 10.0 | 9.1 |
| 10 | 8.7 ± 0.2 | -13.0 | 2.3 | 8.9 ± 0.2 | -11.0 | 2.2 | |
| 200 | 223.6 ± 2.0 | 11.8 | 0.9 | 222.3 ± 2.0 | 11.2 | 0.9 | |
3.3.4. Recovery and Matrix Effect
As shown in Table 4, the extraction recovery of all 13 analytes, at three different concentrations, ranged between 56.9% and 95.0%. The matrix effects on all analytes ranged between 71.6% and 109.3%. These results indicated that both the matrix effect and extraction recovery are satisfactory.
Table 4.
Extraction recoveries and matrix effects of the analytes (n = 6).
| Compounds | Spiked concentration (ng/mL) | Extraction recovery (%) | RSD (%) | Matrix effect (%) | RSD (%) |
|---|---|---|---|---|---|
| Luteolin | 20 | 91.0 ± 2.0 | 2.2 | 109.2 ± 3.6 | 3.3 |
| 200 | 80.7 ± 10.5 | 13.0 | 96.6 ± 7.0 | 7.2 | |
| 4000 | 78.9 ± 5.5 | 7.0 | 89.8 ± 2.8 | 3.1 | |
| Cynaroside | 20 | 94.9 ± 11.1 | 11.7 | 101.7 ± 2.6 | 2.6 |
| 200 | 73.8 ± 7.6 | 10.3 | 109.3 ± 8.4 | 7.7 | |
| 4000 | 85.8 ± 3.0 | 3.5 | 97.6 ± 1.9 | 1.9 | |
| Luteolin 7-O-glucuronide | 10 | 76.5 ± 8.3 | 10.8 | 109.1 ± 2.6 | 2.4 |
| 100 | 69.2 ± 2.0 | 2.9 | 100.4 ± 1.2 | 1.2 | |
| 2000 | 57.4 ± 4.7 | 8.2 | 101.8 ± 6.3 | 6.2 | |
| Isochlorogenic acid C | 5 | 77.3 ± 11.2 | 14.5 | 95.4 ± 13.4 | 14.0 |
| 50 | 72.7 ± 4.4 | 6.1 | 106.4 ± 6.1 | 5.7 | |
| 1000 | 75.6 ± 3.2 | 4.2 | 90.6 ± 4.6 | 5.1 | |
| Cryptochlorogenic acid | 5 | 69.8 ± 9.5 | 13.6 | 95.5 ± 3.2 | 3.4 |
| 50 | 61.2 ± 4.1 | 6.7 | 107.5 ± 8.4 | 7.8 | |
| 1000 | 75.3 ± 1.1 | 1.5 | 109.3 ± 3.1 | 2.6 | |
| Chlorogenic acid | 5 | 74.3 ± 4.1 | 5.5 | 86.6 ± 4.3 | 5.0 |
| 50 | 84.2 ± 7.6 | 9.0 | 82.0 ± 11.5 | 14.0 | |
| 1000 | 69.6 ± 4.4 | 6.3 | 81.1 ± 2.8 | 3.5 | |
| Apigenin | 5 | 80.9 ± 4.9 | 6.1 | 99.7 ± 6.1 | 6.1 |
| 50 | 95.0 ± 4.5 | 4.7 | 71.6 ± 8.1 | 11.3 | |
| 1000 | 74.3 ± 5.6 | 7.5 | 87.2 ± 2.3 | 2.6 | |
| Acacetin | 5 | 83.3 ± 8.4 | 10.1 | 104.0 ± 4.5 | 4.3 |
| 50 | 74.8 ± 6.6 | 8.8 | 111.6 ± 10.1 | 9.1 | |
| 1000 | 78.0 ± 5.6 | 7.2 | 85.9 ± 1.6 | 1.9 | |
| Hyperoside | 5 | 63.4 ± 4.5 | 7.1 | 101.3 ± 4.9 | 4.8 |
| 50 | 70.7 ± 8.8 | 12.4 | 81.0 ± 10.7 | 13.2 | |
| 1000 | 67.6 ± 4.2 | 6.2 | 85.0 ± 2.4 | 2.8 | |
| Isoquercitrin | 5 | 58.5 ± 4.3 | 7.4 | 97.2 ± 3.4 | 3.5 |
| 50 | 56.9 ± 1.7 | 3.0 | 92.7 ± 9.9 | 10.7 | |
| 1000 | 67.6 ± 4.1 | 6.1 | 85.0 ± 2.6 | 3.1 | |
| Apigenin 7-glucoside | 5 | 86.7 ± 7.6 | 8.8 | 104.4 ± 4.4 | 4.2 |
| 50 | 81.5 ± 9.4 | 11.5 | 91.4 ± 7.0 | 7.7 | |
| 1000 | 74.9 ± 5.6 | 7.5 | 85.4 ± 3.0 | 3.5 | |
| Tilianin | 1 | 75.3 ± 10.8 | 14.3 | 104.1 ± 3.3 | 3.2 |
| 10 | 72.2 ± 7.4 | 10.2 | 100.9 ± 11.8 | 11.7 | |
| 200 | 84.6 ± 3.9 | 4.6 | 95.6 ± 1.7 | 1.8 | |
| Hesperidin | 1 | 86.2 ± 11.2 | 13.0 | 103.1 ± 9.6 | 9.3 |
| 10 | 84.5 ± 6.1 | 7.2 | 89.3 ± 10.4 | 11.6 | |
| 200 | 75.3 ± 5.6 | 7.4 | 84.6 ± 1.4 | 1.7 |
3.3.5. Stability
The stability of all 13 analytes during sample collection and processing was evaluated with the various storage conditions being tested on spiked plasma samples at three QC concentrations. As shown in Table 5, the RSD of all tested samples were below 11.4%, suggesting that all 13 analytes were stable in the above four test conditions.
Table 5.
Stability of 13 analytes in rat plasma (n = 6).
| Compounds | Spiked concentration (ng/mL) | Room temperature for 6 h | Three freeze-thaw cycles | Autosampler for 12 h | -80°C for 14 days | ||||
|---|---|---|---|---|---|---|---|---|---|
| Measured concentration (ng/mL) | RSD (%) | Measured concentration (ng/mL) | RSD (%) | Measured concentration (ng/mL) | RSD (%) | Measured concentration (ng/mL) | RSD (%) | ||
| Luteolin | 20 | 20.3 ± 0.3 | 1.5 | 23.2 ± 0.7 | 3.0 | 21.3 ± 0.4 | 1.9 | 17.4 ± 0.3 | 1.7 |
| 200 | 193.5 ± 3.3 | 1.7 | 223.7 ± 1.5 | 0.7 | 181.7 ± 0.8 | 0.4 | 195.1 ± 2.6 | 1.3 | |
| 4000 | 4419.0 ± 9.2 | 0.2 | 4475.1 ± 11.8 | 0.3 | 3656.3 ± 33.7 | 0.9 | 4195.2 ± 15.1 | 0.4 | |
| Cynaroside | 20 | 20.6 ± 0.9 | 4.4 | 22.6 ± 1.0 | 4.4 | 20.0 ± 0.2 | 1.0 | 21.1 ± 0.8 | 3.8 |
| 200 | 182.4 ± 0.6 | 0.3 | 219.8 ± 1.0 | 0.5 | 203.4 ± 6.1 | 3.0 | 205.0 ± 4.0 | 2.0 | |
| 4000 | 4360.1 ± 32.4 | 0.7 | 4152.9 ± 34.1 | 0.8 | 4158.6 ± 15.3 | 0.4 | 4060.3 ± 121.9 | 3.0 | |
| Luteolin 7-O-glucuronide | 10 | 10.9 ± 0.8 | 7.3 | 11.1 ± 0.1 | 0.9 | 9.6 ± 0.3 | 3.1 | 8.8 ± 0.2 | 2.3 |
| 100 | 110.9 ± 1.2 | 1.1 | 112.6 ± 0.5 | 0.4 | 90.7 ± 0.4 | 0.4 | 99.7 ± 0.3 | 0.3 | |
| 2000 | 2214.4 ± 17.9 | 0.8 | 2225.7 ± 9.3 | 0.4 | 1960.1 ± 38.5 | 2.0 | 1930.7 ± 22.5 | 1.2 | |
| Isochlorogenic acid C | 5 | 5.2 ± 0.2 | 3.8 | 5.9 ± 0.1 | 1.7 | 4.6 ± 0.4 | 8.7 | 5.6 ± 0.1 | 1.8 |
| 50 | 48.1 ± 0.8 | 1.7 | 55.3 ± 0.4 | 0.7 | 45.1 ± 0.6 | 1.3 | 43.3 ± 0.3 | 0.7 | |
| 1000 | 1049.2 ± 32.0 | 3.0 | 1052.4 ± 38.4 | 3.6 | 1047.3 ± 12.4 | 1.2 | 1080.3 ± 37.8 | 3.5 | |
| Cryptochlorogenic acid | 5 | 5.3 ± 0.1 | 1.9 | 5.9 ± 0.1 | 1.7 | 5.0 ± 0.2 | 4.0 | 5.2 ± 0.2 | 3.8 |
| 50 | 49.1 ± 1.5 | 3.1 | 54.1 ± 0.3 | 0.6 | 44.5 ± 1.3 | 2.9 | 46.7 ± 1.4 | 3.0 | |
| 1000 | 1012.9 ± 11.1 | 1.1 | 1122.8 ± 6.8 | 0.6 | 1069.3 ± 16.2 | 1.5 | 1075.7 ± 52.9 | 4.9 | |
| Chlorogenic acid | 5 | 5.8 ± 0.1 | 1.7 | 5.8 ± 0.1 | 1.7 | 5.1 ± 0.1 | 2.0 | 5.2 ± 0.1 | 1.9 |
| 50 | 49.7 ± 2.3 | 4.6 | 54.7 ± 0.4 | 0.7 | 43.5 ± 0.7 | 1.6 | 44.4 ± 0.3 | 0.7 | |
| 1000 | 1079.2 ± 8.3 | 0.8 | 1123.5 ± 7.3 | 0.6 | 1084.8 ± 13.6 | 1.3 | 1117.1 ± 2.0 | 0.2 | |
| Apigenin | 5 | 4.9 ± 0.1 | 2.0 | 5.7 ± 0.1 | 1.8 | 5.4 ± 0.2 | 3.7 | 5.2 ± 0.1 | 1.9 |
| 50 | 49.3 ± 1.1 | 2.2 | 50.5 ± 0.4 | 0.8 | 45.8 ± 1.3 | 2.8 | 49.3 ± 1.9 | 3.9 | |
| 1000 | 1112.4 ± 11.7 | 1.1 | 1086.4 ± 17.6 | 1.6 | 987.0 ± 11.4 | 1.2 | 1063.8 ± 62.8 | 5.9 | |
| Acacetin | 5 | 4.6 ± 0.1 | 2.2 | 5.8 ± 0.1 | 1.7 | 5.3 ± 0.1 | 1.9 | 4.5 ± 0.1 | 2.2 |
| 50 | 50.3 ± 0.8 | 1.6 | 50.2 ± 5.7 | 11.4 | 47.8 ± 0.7 | 1.5 | 50.5 ± 0.7 | 1.4 | |
| 1000 | 1126.2 ± 9.5 | 0.8 | 1032.7 ± 5.6 | 0.5 | 1030.3 ± 4.9 | 0.5 | 977.4 ± 57.9 | 5.9 | |
| Hyperoside | 5 | 4.4 ± 0.1 | 2.3 | 5.7 ± 0.1 | 1.8 | 3.9 ± 0.1 | 2.6 | 4.8 ± 0.2 | 4.2 |
| 50 | 48.7 ± 1.9 | 3.9 | 54.5 ± 2.1 | 3.9 | 41.8 ± 1.4 | 3.3 | 50.3 ± 1.8 | 3.6 | |
| 1000 | 1009.6 + 19.9 | 2.0 | 1110.2 ± 4.5 | 0.4 | 803.4 ± 2.5 | 0.3 | 997.8 ± 19.4 | 1.9 | |
| Isoquercitrin | 5 | 4.7 ± 0.2 | 4.3 | 5.6 ± 0.1 | 1.8 | 4.0 ± 0.2 | 5.0 | 4.5 ± 0.1 | 2.2 |
| 50 | 49.0 ± 1.2 | 2.4 | 54.5 ± 0.8 | 1.5 | 41.6 ± 0.5 | 1.2 | 50.7 ± 2.1 | 4.1 | |
| 1000 | 1039.7 ± 20.6 | 2.0 | 1110.5 ± 21.8 | 2.0 | 1039.7 ± 20.6 | 2.0 | 1006.3 ± 30.5 | 3.0 | |
| Apigenin 7-glucoside | 5 | 5.9 ± 0.1 | 1.7 | 5.6 ± 0.4 | 7.1 | 4.3 ± 0.1 | 2.3 | 5.1 ± 0.2 | 3.9 |
| 50 | 50.5 ± 1.0 | 2.0 | 53.7 ± 0.6 | 1.1 | 44.5 ± 0.7 | 1.6 | 51.1 ± 0.4 | 0.8 | |
| 1000 | 1086.7 ± 12.9 | 1.2 | 1112.8 ± 7.2 | 0.6 | 1077.6 ± 9.6 | 0.9 | 1108.3 ± 25.6 | 2.3 | |
| Tilianin | 1 | 1.1 ± 0.1 | 9.1 | 1.0 ± 0.1 | 10.0 | 0.9 ± 0.1 | 11.1 | 0.9 ± 0.1 | 11.1 |
| 10 | 9.9 ± 0.3 | 3.0 | 11.3 ± 0.2 | 1.8 | 9.3 ± 0.1 | 1.1 | 10.2 ± 0.2 | 2.0 | |
| 200 | 226.4 ± 0.2 | 0.1 | 209.6 ± 0.3 | 0.1 | 179.0 ± 1.2 | 0.7 | 188.6 ± 0.9 | 0.5 | |
| Hesperidin | 1 | 1.1 ± 0.1 | 9.1 | 1.1 ± 0.1 | 9.1 | 1.0 ± 0.1 | 10.0 | 1.1 ± 0.1 | 9.1 |
| 10 | 10.2 ± 0.4 | 3.9 | 10.0 ± 0.1 | 1.0 | 8.8 ± 0.1 | 1.1 | 9.5 ± 0.2 | 2.1 | |
| 200 | 213.7 ± 2.1 | 1.0 | 218.3 ± 0.7 | 0.3 | 222.7 ± 2.0 | 0.9 | 209.5 ± 2.3 | 1.1 | |
3.4. Pharmacokinetic Study
Plasma samples from rats orally administered with Flos Chrysanthemi extract (10.0 g/kg) were analysed with UPLC-MS/MS. Plasma concentration-time curves are shown in Figure 3, and the primary pharmacokinetic parameters of each analyte are summarized in Table 6.
Figure 3.
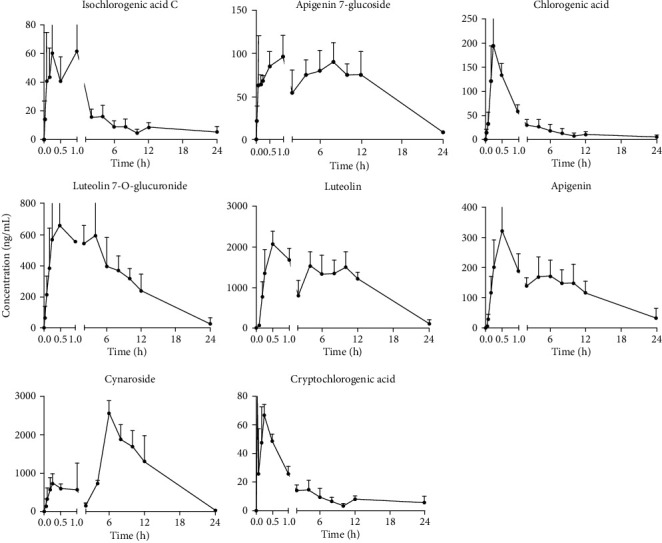
Primary concentration-time curves of isochlorogenic acid C, apigenin 7-glucoside, chlorogenic acid, luteolin 7-O-glucuronide, luteolin, apigenin, cynaroside, and cryptochlorogenic acid after oral administration of Flos Chrysanthemi extract (n = 6, mean ± SD).
Table 6.
Pharmacokinetic parameters of 8 analytes after oral administration of Flos Chrysanthemi extract (n = 6).
| Compounds | T max (h) | C max (ng/mL) | T 1/2 (h) | Ke (1/h) | AUC(0 − tn) (h·ng/mL) | AUC(0 − ∞) (h·ng/mL) |
|---|---|---|---|---|---|---|
| Chlorogenic acid | 0.25 ± 0.00 | 194.41 ± 56.36 | 0.20 ± 0.17 | 4.03 ± 0.90 | 425.83 ± 139.21 | 494.42 ± 204.82 |
| Cryptochlorogenic acid | 0.61 ± 0.33 | 89.36 ± 45.31 | 6.90 ± 3.40 | 0.12 ± 0.04 | 318.79 ± 97.33 | 431.13 ± 196.93 |
| Cynaroside | 6.38 ± 3.80 | 2547.84 ± 1121.18 | 5.01 ± 4.44 | 0.28 ± 0.24 | 19064.87 ± 19942.21 | 19092.57 ± 19960.87 |
| Luteolin 7-O-glucuronide | 0.50 ± 0.27 | 749.25 ± 195.04 | 6.17 ± 1.43 | 0.12 ± 0.03 | 6448.10 ± 1807.31 | 6731.89 ± 2276.56 |
| Apigenin 7-glucoside | 0.69 ± 0.49 | 96.43 ± 24.75 | 13.87 ± 10.15 | 0.25 ± 0.20 | 1321.88 ± 488.77 | 1473.6352 ± 614.27 |
| Isochlorogenic acid C | 0.40 ± 0.31 | 101.23 ± 73.33 | 0.24 ± 0.22 | 4.69 ± 2.04 | 309.13 ± 148.61 | 404.53 ± 228.04 |
| Apigenin | 0.50 ± 0.00 | 301.81 ± 87.13 | 11.11 ± 7.10 | 0.09 ± 0.05 | 2903.87 ± 251.44 | 3088.95 ± 447.45 |
| Luteolin | 0.50 ± 0.00 | 2079.55 ± 307.09 | 8.89 ± 4.01 | 0.10 ± 0.05 | 24237.94 ± 2113.55 | 25094.35 ± 2232.12 |
Five analytes, namely, acacetin, hyperoside, isoquercitrin, tilianin, and hesperidin, were detected only at the first few blood sampling points following oral administration of the Flos Chrysanthemi extract, which made it difficult to plot a complete pharmacokinetic curve. Hence, these 5 analytes were excluded in the following results.
As shown in Table 6, Cmax of cynaroside and luteolin were 2547.84 ± 1121.18 ng/mL and 2079.55 ± 307.09 ng/mL, respectively, ranking as the highest two amongst the 8 remaining analytes. In addition, AUC(0 − tn) of cynaroside and luteolin were larger than the other analytes, indicating a higher level of plasma exposure.
T max of chlorogenic acid, cryptochlorogenic acid, cynaroside, luteolin 7-O-glucuronide, apigenin 7-glucoside, isochlorogenic acid C, apigenin, and luteolin were 0.25 ± 0.00 hours, 0.61 ± 0.33 hours, 6.38 ± 3.80 hours, 0.50 ± 0.27 hours, 0.69 ± 0.49 hours, 0.40 ± 0.31 hours, 0.50 ± 0.00 hours, and 0.50 ± 0.00 hours, respectively. Results showed that besides cynaroside, the other seven compounds were rapidly absorbed into the bloodstream. Meanwhile, Tmax of apigenin and luteolin were similar to the values of previous reports [15].
T 1/2 of chlorogenic acid and isochlorogenic acid C are 0.20 h and 0.24 h, respectively, indicating that these two compounds are eliminated shortly after oral administration. T1/2 of cynaroside, luteolin 7-O-glucuronide, cryptochlorogenic acid, apigenin 7-glucoside, apigenin, and luteolin range from 5.01 h to 13.87 h, suggesting that these compounds have a relatively longer therapeutic time, especially apigenin 7-glucoside.
4. Conclusion
A reliable and sensitive UPLC-MS/MS method was developed to measure 13 ingredients (luteolin, cynaroside, luteolin 7-O-glucuronide, isochlorogenic acid C, chlorogenic acid, cryptochlorogenic acid, apigenin 7-glucoside, apigenin, acacetin, hyperoside, isoquercitrin, tilianin, and hesperidin) after the oral administration of Flos Chrysanthemi extract in rat plasma. This method offered adequate specificity, precision, recovery, and stability. In addition, the results showed that the blood concentrations of cynaroside and luteolin were higher than the other 11 analytes following oral administration of the Flos Chrysanthemi extract. Meanwhile, the absorption and elimination of chlorogenic acid and isochlorogenic acid C were rapid compared to other compounds. These pharmacokinetic parameters facilitate further development and clinical application for Flos Chrysanthemi.
Acknowledgments
The experimental research was supported by the National Natural Science Foundation of China (81673824).
Contributor Information
Huizi Ouyang, Email: huihui851025@163.com.
Jun He, Email: hejun673@163.com.
Data Availability
The data used to support the findings of this study are available from the corresponding authors upon request.
Conflicts of Interest
The authors declare no conflict of interests.
Authors' Contributions
Qi Jia and Xuhua Huang contributed equally to this work.
References
- 1.Yang P. F., Yang Y. N., Feng Z. M., Jiang J. S., Zhang P. C. Six new compounds from the flowers of Chrysanthemum morifolium and their biological activities. Bioorganic Chemistry. 2019;82:139–144. doi: 10.1016/j.bioorg.2018.10.007. [DOI] [PubMed] [Google Scholar]
- 2.Zheng C., Dong Q., Chen H., Cong Q., Ding K. Structural characterization of a polysaccharide from Chrysanthemum morifolium flowers and its antioxidant activity. Carbohydrate Polymers. 2015;130:113–121. doi: 10.1016/j.carbpol.2015.05.004. [DOI] [PubMed] [Google Scholar]
- 3.Liu F., Ong E. S., Li S. F. Y. A green and effective approach for characterisation and quality control of Chrysanthemum by pressurized hot water extraction in combination with HPLC with UV absorbance detection. Food Chemistry. 2013;141(3):1807–1813. doi: 10.1016/j.foodchem.2013.04.083. [DOI] [PubMed] [Google Scholar]
- 4.Chen C., Yan H., Han B. Rapid identification of three varieties of Chrysanthemum with near infrared spectroscopy. Revista Brasileira de Farmacognosia. 2014;24(1):33–37. doi: 10.1590/0102-695X20142413387. [DOI] [Google Scholar]
- 5.Liang F., Hu C., He Z., Pan Y. An arabinogalactan from flowers of Chrysanthemum morifolium: structural and bioactivity studies. Carbohydrate Research. 2014;387:37–41. doi: 10.1016/j.carres.2013.09.002. [DOI] [PubMed] [Google Scholar]
- 6.Li Y., Yang P., Luo Y., et al. Chemical compositions of chrysanthemum teas and their anti-inflammatory and antioxidant properties. Food Chemistry. 2019;286:8–16. doi: 10.1016/j.foodchem.2019.02.013. [DOI] [PubMed] [Google Scholar]
- 7.Han Y., Zhou M., Wang L., et al. Comparative evaluation of different cultivars of Flos Chrysanthemi by an anti-inflammatory-based NF-κB reporter gene assay coupled to UPLC-Q/TOF MS with PCA and ANN. Journal of Ethnopharmacology. 2015;174:387–395. doi: 10.1016/j.jep.2015.08.044. [DOI] [PubMed] [Google Scholar]
- 8.Yang C., Chen H., Lu S., et al. Structural modification of luteolin from Flos Chrysanthemi leads to increased tumor cell growth inhibitory activity. Bioorganic & Medicinal Chemistry Letters. 2016;26(15):3464–3467. doi: 10.1016/j.bmcl.2016.06.043. [DOI] [PubMed] [Google Scholar]
- 9.Rao P. S., Satelli A., Moridani M., Jenkins M., Rao U. S. Luteolin induces apoptosis in multidrug resistant cancer cells without affecting the drug transporter function: involvement of cell line-specific apoptotic mechanisms. International Journal of Cancer. 2012;130(11):2703–2714. doi: 10.1002/ijc.26308. [DOI] [PMC free article] [PubMed] [Google Scholar]
- 10.Zheng C. H., Zhang M., Chen H., et al. Luteolin from Flos Chrysanthemi and its derivatives: new small molecule Bcl-2 protein inhibitors. Bioorganic & Medicinal Chemistry Letters. 2014;24(19):4672–4677. doi: 10.1016/j.bmcl.2014.08.034. [DOI] [PubMed] [Google Scholar]
- 11.Lin L. Z., Harnly J. M. Identification of the phenolic components of chrysanthemum flower (Chrysanthemum morifolium Ramat) Food Chemistry. 2010;120(1):319–326. doi: 10.1016/j.foodchem.2009.09.083. [DOI] [Google Scholar]
- 12.Cui Y., Wang X., Xue J., Liu J., Xie M. Chrysanthemum morifolium extract attenuates high-fat milk-induced fatty liver through peroxisome proliferator-activated receptor α-mediated mechanism in mice. Nutrition Research. 2014;34(3):268–275. doi: 10.1016/j.nutres.2013.12.010. [DOI] [PubMed] [Google Scholar]
- 13.Zheng C., Dong Q., du Z., Wang P., Ding K. Structural elucidation of a polysaccharide from Chrysanthemum morifolium flowers with anti-angiogenic activity. International Journal of Biological Macromolecules. 2015;79:674–680. doi: 10.1016/j.ijbiomac.2015.04.026. [DOI] [PubMed] [Google Scholar]
- 14.Chen Z., Kong S., Song F., Li L., Jiang H. Pharmacokinetic study of luteolin, apigenin, chrysoeriol and diosmetin after oral administration of Flos Chrysanthemi extract in rats. Fitoterapia. 2012;83(8):1616–1622. doi: 10.1016/j.fitote.2012.09.011. [DOI] [PMC free article] [PubMed] [Google Scholar]
- 15.Chen Z., Tu M., Sun S., et al. The exposure of luteolin is much lower than that of apigenin in oral administration of Flos Chrysanthemi extract to rats. Drug Metabolism and Pharmacokinetics. 2012;27(1):162–168. doi: 10.2133/dmpk.DMPK-11-RG-081. [DOI] [PubMed] [Google Scholar]
- 16.Li L. P., Wu X. D., Chen Z. J., et al. Interspecies difference of luteolin and apigenin after oral administration of Chrysanthemum morifolium extract and prediction of human pharmacokinetics. Pharmazie. 2013;68(3):195–200. [PubMed] [Google Scholar]
Associated Data
This section collects any data citations, data availability statements, or supplementary materials included in this article.
Data Availability Statement
The data used to support the findings of this study are available from the corresponding authors upon request.