Abstract.
Purpose: Diabetic retinopathy (DR) is characterized by retinal lesions affecting people having diabetes for several years. It is one of the leading causes of visual impairment worldwide. To diagnose this disease, ophthalmologists need to manually analyze retinal fundus images. Computer-aided diagnosis systems can help alleviate this burden by automatically detecting DR on retinal images, thus saving physicians’ precious time and reducing costs. The objective of this study is to develop a deep learning algorithm capable of detecting DR on retinal fundus images. Nine public datasets and more than 90,000 images are used to assess the efficiency of the proposed technique. In addition, an explainability algorithm is developed to visually show the DR signs detected by the deep model.
Approach: The proposed deep learning algorithm fine-tunes a pretrained deep convolutional neural network for DR detection. The model is trained on a subset of EyePACS dataset using a cosine annealing strategy for decaying the learning rate with warm up, thus improving the training accuracy. Tests are conducted on the nine datasets. An explainability algorithm based on gradient-weighted class activation mapping is developed to visually show the signs selected by the model to classify the retina images as DR.
Result: The proposed network leads to higher classification rates with an area under curve (AUC) of 0.986, sensitivity = 0.958, and specificity = 0.971 for EyePACS. For MESSIDOR, MESSIDOR-2, DIARETDB0, DIARETDB1, STARE, IDRID, E-ophtha, and UoA-DR, the AUC is 0.963, 0.979, 0.986, 0.988, 0.964, 0.957, 0.984, and 0.990, respectively.
Conclusions: The obtained results achieve state-of-the-art performance and outperform past published works relying on training using only publicly available datasets. The proposed approach can robustly classify fundus images and detect DR. An explainability model was developed and showed that our model was able to efficiently identify different signs of DR and detect this health issue.
Keywords: diabetic retinopathy, convolutional neural networks, residual networks, inception, microaneurysms, exudates and hemorrhage
1. Introduction
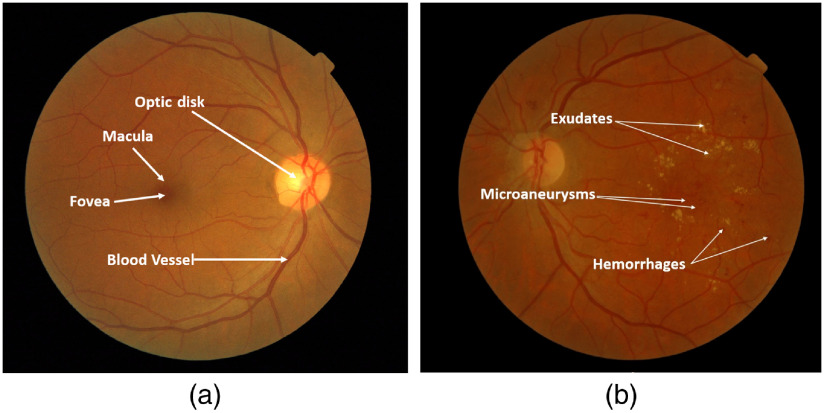
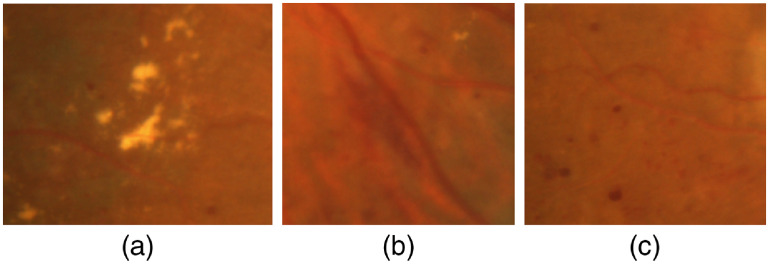
Diabetic retinopathy (DR) is one of the leading causes of visual impairment worldwide with a global prevalence of 4.8% DR blindness.1 The incidence of diabetes is increasing, with significant variations across ethnic and racial groups worldwide. DR is characterized by retinal lesions in people having diabetes mellitus for several years. This disease is detected by a systematic examination of the fundus of the eye. At the initial stage, DR appears with no symptoms, but its progression can lead to a progressive loss of visual acuity and blindness. The earliest signs of DR appearing on the retina are microaneurysms (MA) because of abnormal blood leakage from retinal vessels. MA are very small and appear as red dots with sharp margins. When blood vessels are broken by abnormal swelling, bleeding creates hemorrhage (HM), which is similar to MA but larger and clearly visible in the retina image. More capillary leakage can create exudates (EX), a fluid rich in protein and cellular elements. They are often arranged in yellow spots and located in or adjacent to the outer plexiform layer. A simple comparison between normal retina and retina with DR is shown in Fig. 1. Figure 2 shows an example of these signs. It takes a considerable amount of time, resources, and money to manually diagnose DR. A computer-aided diagnosis (CAD) system reduces work for the clinicians, saves time and money, and improves use of available resources. Machine learning and deep learning can be efficiently used to develop such a CAD system.
Fig. 1.
Examples of (a) a normal retina and (b) a DR damaged retina.
Fig. 2.
Different signs of DR on fundus images: (a) EX, (b) HM, and (c) MA.
Various approaches have been proposed for DR detection, however, detecting DR in the retinal fundus images is still a challenging task. The limitations are mainly due to the spherical shape of the eye, leading to a brighter region in the center of the retina and dark regions in the borders. Nonuniform lighting, low contrast, small lesions (MA), and the presence of objects in a normal retina that have similar attributes to EX, HM such as optic disc and blood vessels, makes the task of identifying EX, MA, and HM very difficult. Furthermore, the attributes of EX, MA, and HM are characterized by different shapes that can be lost depending on the image processing algorithm used during preprocessing.
In a previous work,2 machine learning and computer vision techniques were used to extract DR signs. LBP,3 LTP,4 and LESH5 are used to extract the features histogram and support vector machine (SVM) is used to classify EX, MA, and HM. Tests on MESSIDOR dataset6 achieve an area under curve (AUC) score of 0.931 for LESH, 0.916 for LTP, and 0.897 for LBP. The score is interesting, but this technique requires a feature extraction step. It is also time-consuming during the SVM process because the feature vectors are very large. In deep learning, a CNN model is learned in an end-to-end manner. It automatically learns the characteristics and has exceptional classification performances. In 2014, Simonyan and Zisserman7 proposed a CNN model called VGGNet, which contains 19 layers and discovered that depth is critical to improve the results. Based on these results, deeper models such as Inception8 and ResNet9 were proposed, showing incredible efficiency in many computer vision tasks. Mansour10 combined deep learning and machine learning techniques for DR detection. The author applied multiple techniques for features extraction. An adaptive learning-based Gaussian mixture model was used for background subtraction and connected component analysis was used for region of interest localization. Alexnet,11 CNN, and spatial invariant feature transform12 were used for features extraction. Principle component analysis13 and linear discriminant analysis (LDA)14 were used for feature selection. For DR classification, the author used SVMs. EyePACS dataset was used for training and testing. The best performing technique was Alexnet with LDA, which gives an accuracy (ACC) of 97.7%.
Chalakkal et al.15 presented a framework for detecting Macular Edema on fundus retinal images. The authors used a CNN for features extraction and k-NN-based classifier. They combined three datasets (MESSIDOR, IDRID, and UoA-DR16) to give a total of 1903 retinal images used in their experiments. The best CNN model for features extraction was an InceptionResnet-v2 with k-NN classifier achieving a sensitivity (SE) of 0.623, a specificity (SP) of 0.930, and an ACC of 0.853.
Gulshan et al.17 applied deep learning techniques for detecting DR. They used an Inception V318 architecture. Tests conducted on EyePACS19 and MESSIDOR-26 datasets show very interesting results. For EyePACS and MESSIDOR-2, the AUCs were 0.991 and 0.990, respectively. So far, this study remains the benchmark for all research in DR because of the highest score obtained. In this study, the authors use a private dataset named EyePACS-1 with around 120,000 fundus images. This makes the network more efficient by training it on a larger amount of data. Voets et al.20 tried to reproduce the work above. They used the same CNN but could not achieve similar performances. They obtained an SP of 67.2% (resp. 44.0%) and an SE of 68.2% (resp. 64.8%). This is mainly due to nonavailable training data that were used in the previous work.17 Using image normalization techniques, they managed to increase the performance of their algorithms and obtained an AUC of 0.94 (resp. 0.82). Roy et al.21 built discriminative and generative pathology histograms and combined them with feature representations extracted from fully connected CNN layers. They used random forest (RF) for classification.22 The authors used EyaPACS19 dataset for training and testing and they show interesting results with a quadratic kappa score = 0.86. This method produces robust features. For classification, the model based on SVM outperforms the RF22 classifier because overfitting can easily occur with RF. RF also needs the number of trees as input. In a similar study,23 the authors provided an innovative method for red lesion (HE) detection based on combining both deep learning and domain knowledge. Features learned by a CNN are improved by incorporating hand-crafted features. Ensemble vector of descriptors is subsequently used to detect true lesion candidates using an RF classifier.22 The performance of this method on a per-lesion basis on DIARETDB124 and E-ophtha25 datasets achieved an and for the DIARETDB1 dataset and an , for the E-ophtha dataset. Lin et al.26 used CNN to detect DR using a sample of 21,123 interpretable fundus photographs obtained from EyePACS19 dataset. They excluded images with low quality, thus the dataset was expanded to 33,000 images by rotating and flipping. 30,000 images are randomly selected as the training set and the remaining 3000 images used as the testing set. The system achieves an ACC, SE, and SP of 81.80%, 68.36%, and 89.87%, respectively. Doshi et al.27 used an ensemble learning based on three CNNs with five convolutional layers to detect DR. The quadratic kappa scores on EyePACS for the three models are: model , model , and model . The kappa score for the hybrid model is 0.3996. Wang et al.28 used a CNN termed Zoom-in-Net, which mimics the zoom-in process of a clinician to examine the retinal images. Zoom-in-Net generates attention maps and predicts the disease level. It was validated on EyePACS and MESSIDOR6 datasets and achieved a kappa score of (resp. ). In a similar study,29 Brown et al. used an automated diagnosis of plus disease in retinopathy of prematurity using deep convolutional neural networks (DCNNs). The study includes 5511 retinal photographs; the algorithm achieved average AUCs of 0.94 and 0.99 for the diagnoses of normal and plus disease, respectively. On an independent test set of 100 images, the algorithm achieved 91% ACC and the quadratic kappa scores . Grinsven et al.30 presented a CNN with nine layers inspired by OxfordNet7 to detect HM on color fundus images. They selected 6679 images from EyePACS dataset for training. MESSIDOR dataset was used as an independent set for testing. The model achieved an AUC of 0.972 for MESSIDOR and 0.894 for EyePACS test set. Colas et al.31 proposed a deep convolutional network for detecting DR lesions. They trained the DCNN model on 70,000 images and tested on 10,000 images from the EyePACS dataset. Their model achieved an , an , and an . Zeng et al.32 presented two CNN models: monocular Inception V3 model and a binocular model. The authors trained these CNNs with a transfer learning technique and they customized the loss function by combining cross entropy loss and contrastive loss in order to guide the gradient descent. They used 28,104 images for training and a test set of 3510 images obtained from the EyePACS dataset. Monocular Inception V3 gives an AUC of 0.938 and the binocular model has an AUC of 0.949. Chalakkal et al.33 presented a deep learning approach based on CNN. The authors used an unsupervised CNN that evaluates the field definition and content in the retina images. The model was tested on 7007 images from seven different public datasets including 3000 images from the EyePACS dataset. The model achieved SE, SP, and ACC of 0.983, 0.951, and 0.974, respectively. The study of Li et al.34 combines deep learning and a machine learning approach. They used 34,124 training images and 1000 for validation and tested on 53,572 images from the EyePACS dataset. The experimental results of the proposed method achieved an ACC of 0.861.
For all these studies, we see very interesting scores due to many reasons; first, the large number of images in the datasets used for training the algorithms; second, optimization of hyperparameters applied to CNN; third, the training methods are end-to-end or transfer learning. End-to-end learning generally means omitting any hand-crafted intermediate algorithms and learning straight from the sample data set to solve a particular problem. Transfer learning has also proven effective in processing large datasets because it gives very interesting results even if the transfer of data knowledge is between two different types of datasets. But the use of this technique can be difficult, especially with medical datasets that can be unbalanced.
In this paper, we propose an approach to perform transfer learning and fine-tuning, which will allow us to take advantage of the pretrained weights on millions of images and adjust them to our task. We empirically analyze the impact of the fine-tuned fraction of the final results. Then we propose to use a cosine learning rate decay with warm up to customize all the pretrained weights from the ImageNet35 dataset and make them progressively fit our data. The proposed model can be used as a baseline to detect DR on fundus retinal images. Tests are conducted on eight publicly available datasets: EyePACS,19 MESSIDOR,6 MESSIDOR-2,6 DIARETDB0,36 DIARETDB1,24 STARE,37 E-ophtha,25 IDRID,38 and UoA-DR.39 Average ACCs, SEs, SPs, and AUCs are computed in a 10-fold cross-validation scheme. We compare our work with recent approaches and demonstrate that the proposed approach is able to achieve higher scores in DR detection across multiple datasets. Testing with multiple datasets helps benchmark the generalization performance of the proposed algorithm and makes it more robust to real-life conditions.40 It is worth mentioning that this work relies only on available public datasets, while many high-performing techniques proposed in the literature use proprietary data (hundreds of thousands more images) to achieve equivalent scores to ours. Finally, to explain the results of the proposed deep model, we developed a technique based on gradient-weighted class activation mapping (Grad-CAM) to visually show the signs selected by the model to classify the retinal images as DR and analyze the misclassification results.
2. Proposed Approach
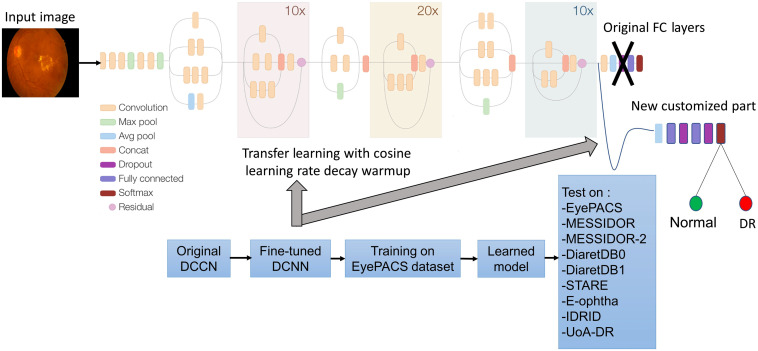
The proposed approach is based on a DCNN Inception-Resnet-v2. In the first step, we fine-tuned the original DCNN by customizing the fully connected layers (see Sec. 2.1). In the second step, we train this fine-tuned CNN on the EyePACS dataset by applying a cosine learning rate decay with warm up. Finally, the learned model was tested on eight public datasets. Figure 3 shows the pipeline of the proposed approach.
Fig. 3.
Proposed approach for DR detection.
2.1. Transfer Learning and Fine-Tuning
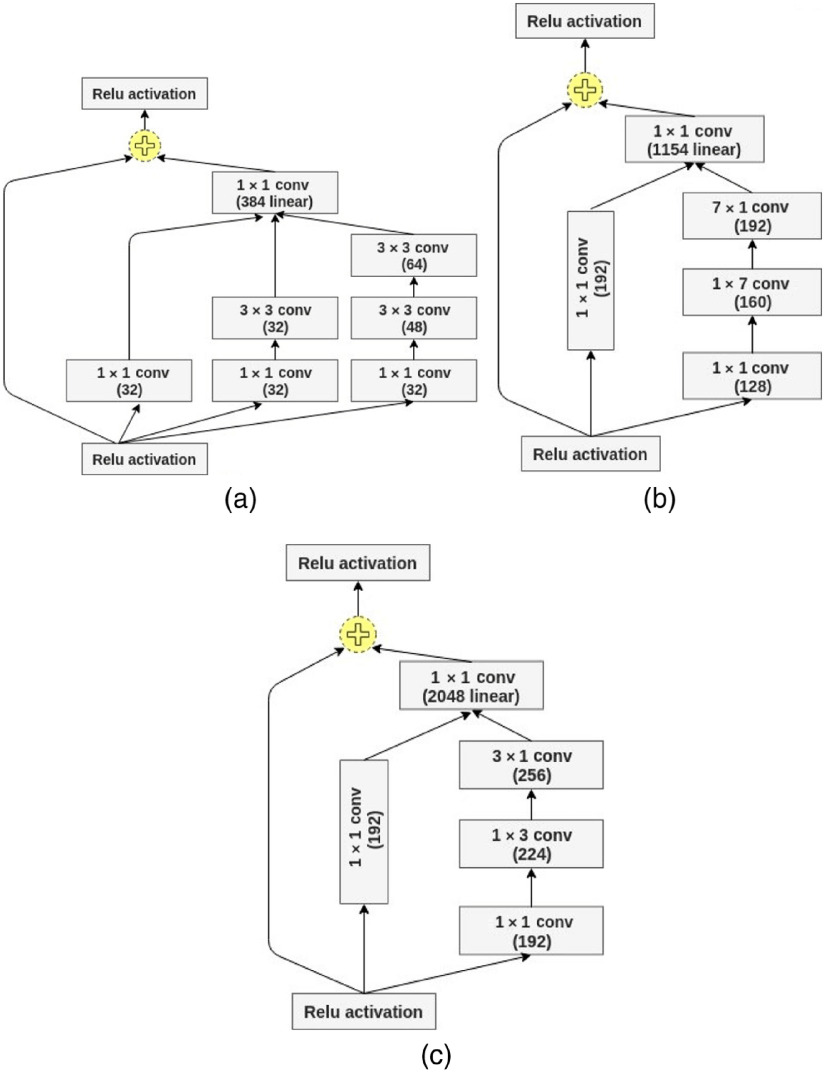
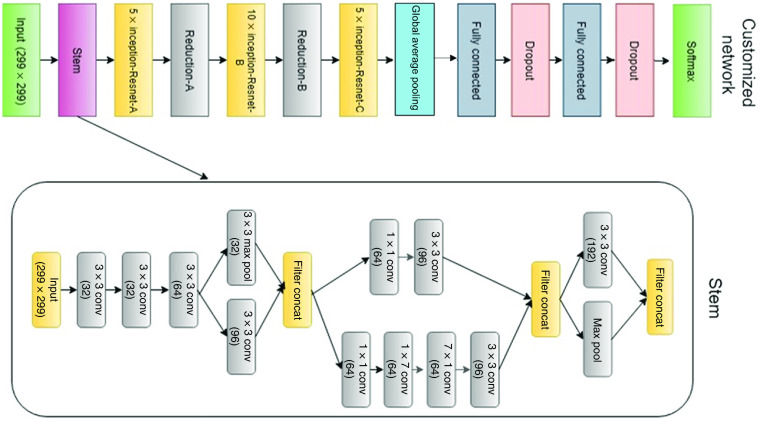
Our proposed CNN model is Inception-Resnet-v2. It consists of a combination of two recent networks, a residual network and a recent version of an inception architecture. Several studies used the residual network in their experiments and achieved state-of-the-art ACCs in various computer vision and medical imaging classification tasks.41–43 The residual blocks solve the problem of “vanishing gradient” by allowing the gradients to flow directly through the skip connections, thus reducing the vanishing effect.44 In addition, inception modules allow for deeper networks without overfitting and more efficient computation.8 The inception modules included in our model have a set of filters with different scales, , , and , that are merged with concatenation in each branch. The split-transform-merge architecture of the inception module has a powerful representational ability in its dense layers. Inception modules and residual blocks make the proposed network hybrid and robust. The core module of the network includes Inception-Resnet-A, Inception-Resnet-B, and Inception-Resnet-C blocks as shown in Fig. 4. The full customized network architecture with a Stem module is shown in Fig. 5.
Fig. 4.
Inception-Resnet-v2 blocks: (a) Inception-Resnet-A, (b) Inception-Resnet-B, and (c) Inception-Resnet-C.
Fig. 5.
The customized network with Stem module.
The model architecture consists of two main parts. The first part of Inception-Resnet-v2 is a feature extraction that learns global, invariant, and high-level features. The convolution part on the top has 5 convolutional layers, each one followed by batch normalization, 2 pooling layers, 43 inception modules, and 3 residual connections. The second part deals with classification. It consists of fully connected and Softmax layers. We customize this second part by removing the fully connected part of the model and build one customized to our number of classes of normal versus DR. We also added global average pooling and two fully connected layer with the rectified linear unit (ReLU) function as activation. We added a dropout layer with 25% dropout probability to minimize overfitting. Finally, a Softmax layer gives normalized class probabilities for the output being “normal” or “DR.” We tested nine configurations:
-
1.
IncRes-v2-WF. We use a pretrained model without fine-tuning.
-
2.
IncRes-v2-1FT, IncRes-v2-2FT, IncRes-v2-3FT, and IncRes-v2-AllFT. We fine-tuned the weights of the network by gradually unfreezing the lower layers of the convolutional part of the CNN (the last block, the last two blocks, the last three blocks, and all the convolutional blocks).
-
3.
IncRes-v2-FTCDW, IncRes-v2-FTCD, IncRes-v2-FTED, and IncRes-v2-FTSD. We fine-tuned all the weights of the network by performing back-propagation on all the layers with a cosine learning rate decay with warm up, cosine decay, exponential decay, and step decay, respectively.
3. Datasets
3.1. MESSIDOR and MESSIDOR-2
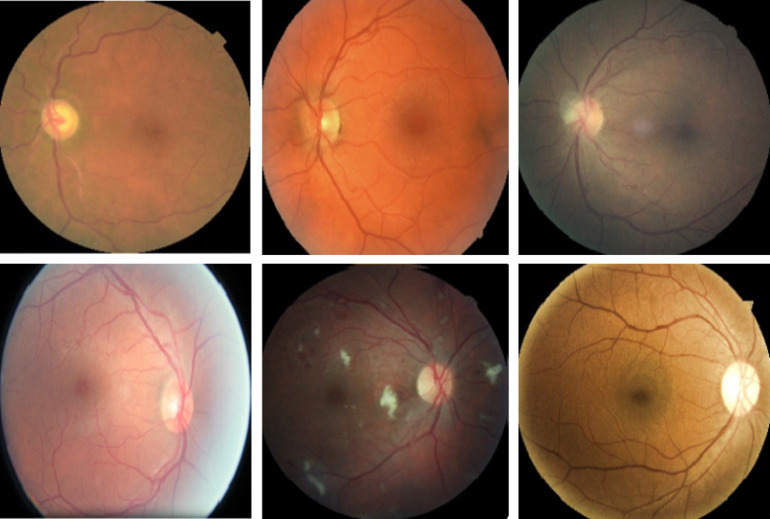
MESSIDOR6 contains 1200 color images of the eyes’ retinal fundus acquired by 3 ophthalmological departments. They used a 3 CCD camera on a Topcon TRC NW6 nonmydriatic retinograph with a 45-deg field of view (FOV) with resolution of , , and . Figure 6 shows some fundus images of the MESSIDOR dataset. The MESSIDOR-2 (Ref. 6) is an extension of the original MESSIDOR database for DR. It contains 1748 retinal images. The images were acquired with a Topcon TRC NW6 nonmydriatic fundus camera with a 45-deg FOV. The two datasets come with multiple resolutions (see Table 1).
Fig. 6.
Sample fundus images in MESSIDOR and MESSIDOR-2 datasets.
Table 1.
Public datasets used for training and testing in our study.
| Name | No. of images | Resolution | Uses |
|---|---|---|---|
| EyePACS | 88,702 | , , , | DR grading EX, HM, and MA detection |
| MESSIDOR | 1200 | , , | EX, HM, MA, and abnormal blood vessels detection |
| MESSIDOR-2 | 1748 | , , | EX, HM, MA, and abnormal blood vessels detection |
| DIARETDB0 | 130 | EX, HM, MA, and abnormal blood vessels detection | |
| DIARETDB1 | 89 | EX, HM, MA, and abnormal blood vessels detection | |
| E-ophtha | 381 | MA detection | |
| STARE | 400 | EX, HM, MA, and abnormal blood vessels detection | |
| IDRID | 516 | EX, HM, MA, and abnormal blood vessels detection | |
| UoA-DR | 200 | EX, HM, MA, and abnormal blood vessels detection |
3.2. E-Ophtha
The dataset25 consists of 381 compressed images of which 148 have MA and 233 are healthy. Images were acquired at more than 30 screening centers around France. There are no separate testing and training datasets provided. The variety of image quality and resolution of makes it the most challenging publicly available dataset. Figure 7 shows some fundus images of the E-ophtha dataset.
Fig. 7.
Sample fundus images in the E-ophtha dataset.
3.3. DIARETDB0 and DIARETDB1
DIARETDB036 contains 130 color fundus images of which 20 are normal and 110 contain signs of the DR (hard EX, soft EX, MA, HM, and neovascularization) with a unique resolution of . DIARETDB124 consists of 89 retinal images. The fundus images were captured with a 50-deg FOV digital fundus camera. The data correspond to practical situations and can be used to evaluate the general performance of diagnosis methods. This data set is referred to as “calibration level 0 fundus images.” Figure 8 shows some fundus images of DIARETDB0 and DIARETDB1 datasets.
Fig. 8.
Sample fundus images in DIARETDB0 and DIARETDB1 datasets.
3.4. STARE
This dataset45 is comprised of retinal color images acquired by a TRV50 fundus camera (Topcon Corp., Tokyo, Japan) at a 35-deg field with resolution images. It contains 397 images in 14 disease categories including emboli, branch retinal artery occlusion, cilio-retinal artery occlusion, branch retinal vein occlusion, central retinal vein occlusion (CRVO), hemi-CRVO, background DR, proliferative diabetic retinopathy (PDR), arteriosclerotic retinopathy, hypertensive retinopathy, coat’s disease, and macroaneurism. Figure 9 shows some fundus images of the STARE dataset.
Fig. 9.
Sample fundus images in the STARE dataset.
3.5. IDRID
This dataset contains 516 images with a variety of pathological conditions of DR. The images were acquired using a Kowa VX-10 alpha digital fundus camera with a 50-deg FOV and all are centered near the macula. The images have a resolution of . Medical experts provided the diagnosis for each image and evaluated the presence of DR and a retinopathy grade from 0 (normal) to 4 (severe). Figure 10 shows some fundus images of the IDRID dataset.
Fig. 10.
Sample fundus images in the IDRID dataset.
3.6. UoA-DR
The UoA-DR16 dataset was created as part of the University of Auckland research, which aims to establish an automatic diagnostic system that could screen patients affected by DR. This database has been developed in partnership with three Indian hospitals: Al-Salama Eye Hospital, Dr. Tony Fernandez Eye Hospital, and Giridhar Eye Institute. The ophthalmologists from these hospitals acquired retinal images from their patients, collecting a total of 200 images. The photos were taken in JPEG format using a Zeiss VISUCAM 500 fundus camera with an FOV of 45 deg and a resolution of . The dataset is categorized into three classes: healthy, nonproliferative DR, and PDR. Figure 11 shows some fundus images from the UoA-DR dataset.
Fig. 11.
Sample fundus images in the UoA-DR dataset.
3.7. EyePACS
This dataset contains more than 88,702 high-resolution images under a variety of imaging conditions. These retina images were obtained from a group of subjects, and for each subject, two images were obtained for left and right eyes, respectively. The images come from different camera models and sizes, which can affect the visual appearance of left versus right. Figure 13 shows a sample of images from EyePACS. This dataset is unbalanced as normal images with label “0” represent a large class, whereas PDR images represent a small portion of the dataset images. Figure 12 shows a sample fundus images in the EyePACS dataset.
Fig. 13.
EyePACS dataset distribution.
Fig. 12.
Sample fundus images in the EyePACS dataset.
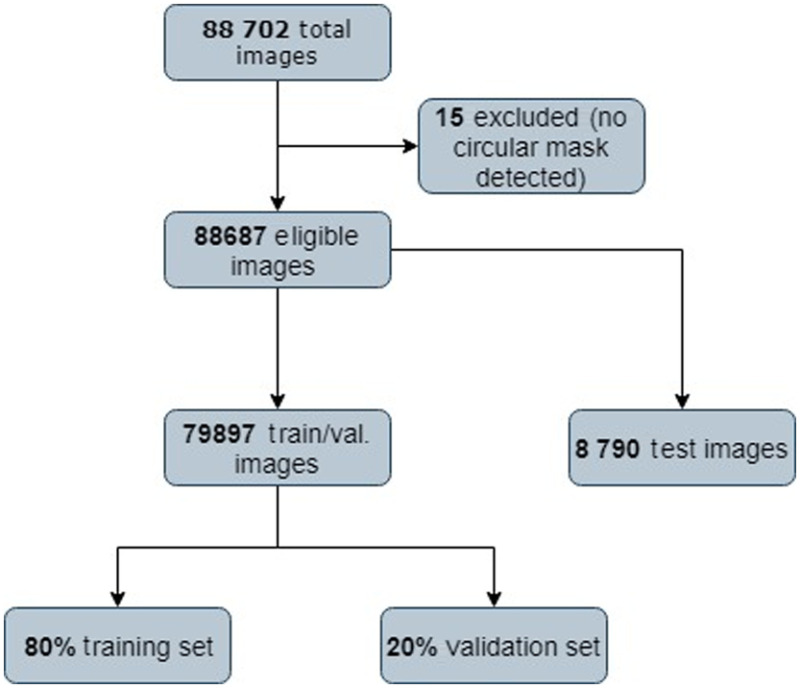
Table 1 gives an overview of each dataset. Fifteen fundus images are excluded because no circular mask was detected. We split EyePACS into 79,897 images for training and 8790 for testing. Figure 13 shows a diagram of the EyePACS dataset distribution. According to Refs. 26 and 32, we defined the patient as having DR if the DR stage is between 2 and 4 (moderate, severe, and proliferative). Images labeled 0 and 1 are classified “normal” and relabeled with 0, images with labels of 2, 3, and 4 are classified as “DR” and relabeled with 1. For the unbalanced classes, we use the class-weight technique. This technique the asymmetry of cost errors directly into account during the model training on the EyePACS dataset. We used the MESSIDOR datasets to detect the presence of DR (Ex, HM, and MA) using DR labeling as in the work of Chalakkal et al.,15 Wang et al.,28 and Grinsven et al.30 The detection of diabetic macula edema is not considered in this work since the EyePACS used for training does not have grades for macular edema.
The nine datasets contain fundus images with the sphere of the retina surrounded by black margins. These black regions were cropped and the images were resized to (input size of our deep CNN). All training and testing images were normalized by subtracting the average and dividing by the standard deviation computed on all the pixels of an image.
4. Experimental set Up
4.1. Training
At the beginning of the training, CNN’s parameters are usually random values, and therefore, far from the final solution. The use of a high learning rate can lead to numerical instability. In our study, we use a small learning rate at the beginning and then switch back to the initial learning rate. Based on the gradual warm-up strategy proposed by Goyal,46 we linearly increase the learning rate from 0 to the initial learning rate. In other terms, we use the first batches to warm up (10 data epochs), the initial learning rate is , and at batch , , we set the learning rate to . Once the warm up is performed at batch , we decay the learning rate with a cosine annealing by following the cosine function given by47
| (1) |
where represent the total number of batches. This scheduling, called “cosine” decay, decreases the learning rate slowly at the beginning, which then becomes almost linear decreasing in the middle, and slows down again at the end to improve the model’s ACC. In other words, the learning rate increases linearly from 0 to the initial value with the warm-up steps, then switches to a cosine decaying. An Adam optimizer was used to train from scratch with a momentum of 0.9 used for fine-tuning. The initial learning rate for all nine configurations is , which will be the warm up at each layer. The experiments are carried out for 100 epochs with a batch size of 64. The proposed method was implemented using Keras/Tensorflow48 on an NVIDIA Quadro P600049 and Intel Xeon 2.1GHzx16 CPU with 32 GB DDR2 RAM.
4.2. Metrics
The images of the eight datasets were organized into two classes labeled as 0 (normal) and 1 (DR). All the experiments are evaluated in terms of SE, SP, AUC, and ACC. The SE and SP show the performance of the method with respect to both the DR and normal classes. ACC is used as a statistical measure of how well a binary classification test correctly identifies or excludes a condition. An AUC–receiver operating characteristic (ROC) curve is a performance measure widely used for medical classification problems. ROC is a probability curve and AUC represents the degree or measure of separability. It shows how much the model is capable of distinguishing between DR or normal. The ROC curve is plotted with true positive rate (TPR) against the false positive rate (FPR) where TPR/SE is on the axis and FPR is on the axis. These metrics are defined in the following:
| (2) |
| (3) |
| (4) |
| (5) |
where TP is the true positive rate and represents the number of positive cases that are labeled correctly, TN is the true negative rate and means the number of negative cases that are labeled correctly, FP is the false positive rate, the number of positive cases that are labeled falsely, and FN is the false negative rate for the number of negative cases that are labeled falsely.
5. Results
5.1. Performance of DR Detection
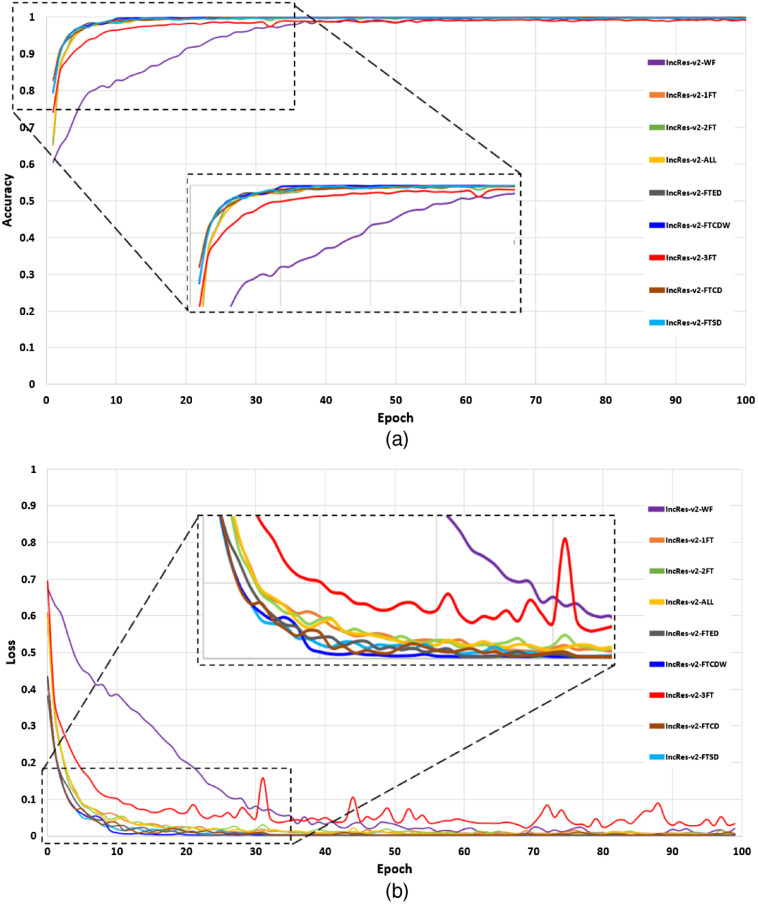
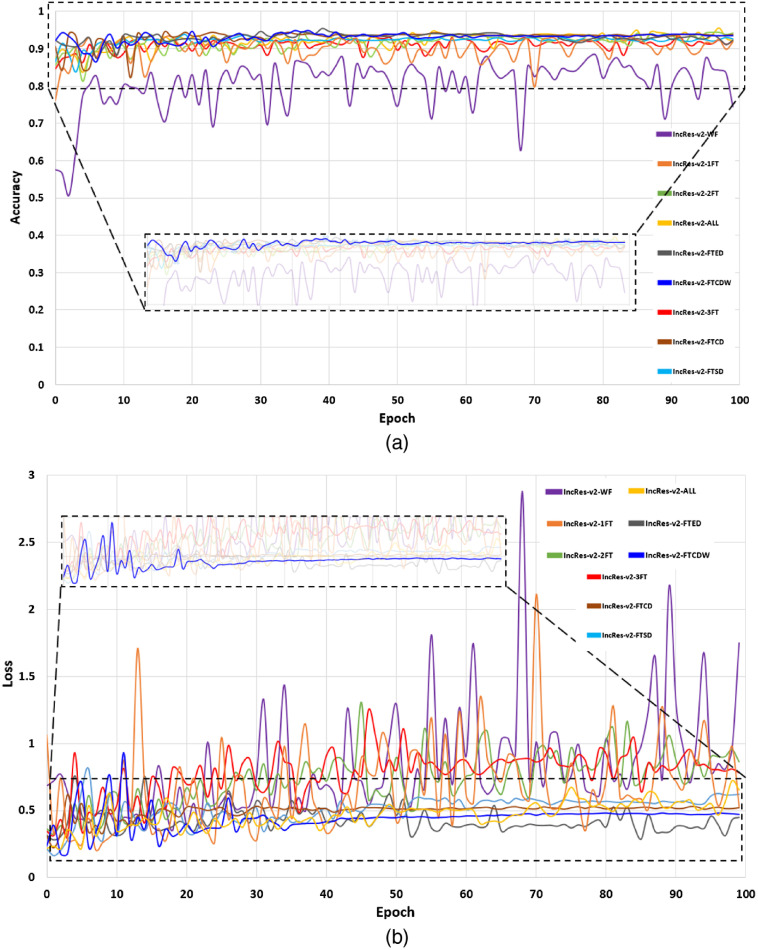
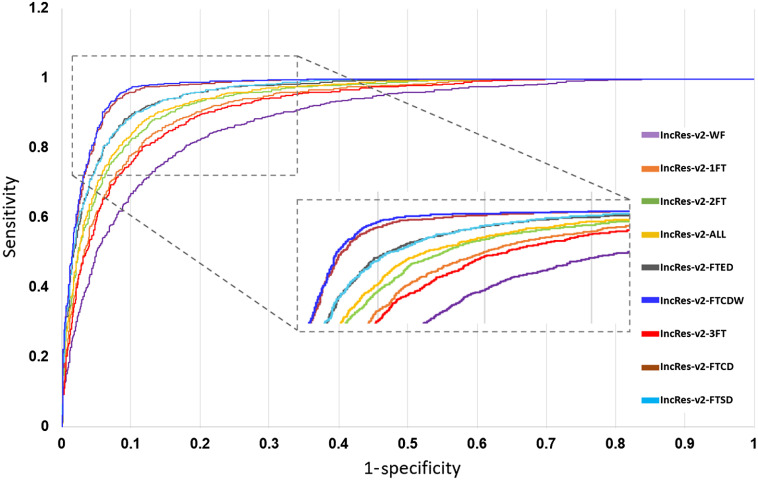
In this section, we present the performance of the models by reporting the ACC, AUC, SE, and SP metrics. Table 2 gives the test scores for the nine configurations tested on the EyePACS dataset. The results show that IncRes-v2-FTCDW achieved better results with and . An interesting AUC with 0.971 was achieved by IncRes-v2-FTCD. IncRes-v2-FTED has a good AUC with 0.964 while the other models achieved 0.914 and 0.908 for IncRes-v2-2FT and IncRes-v2-3FT, respectively. IncRes-v2-WF scored 0.841 and was the worst among the other models in the classification of referable DR. Figures 14 and 15 show the learning curves [(a) ACC and (b) loss] for the nine configurations. We can see the curves of IncRes-v2-FTCDW and IncRes-v2-FTCD showing the good performance of these models and their stability during training and validation compared to the other tested models. Figure 16 represents the AUC of the ROC for the nine configurations. We can see that the ROC curve of IncRes-v2-FTCDW is the highest, followed by the ROC curve of IncRes-v2-FTCD. The ROC curves of IncRes-v2-FTSD and IncRes-v2-FTED are almost identical because there is a difference of only 0.003 in their scores. IncRes-v2-WF has the lowest curve (this model was not fine-tuned).
Table 2.
Performance measures using the nine configurations on the EyePACS dataset.
| Model | AUC | ACC | SE | SP |
|---|---|---|---|---|
| IncRes-v2-WF | 0.841 | 0.854 | 0.877 | 0.799 |
| IncRes-v2-1FT | 0.937 | 0.881 | 0.908 | 0.887 |
| IncRes-v2-2FT | 0.914 | 0.905 | 0.897 | 0.902 |
| IncRes-v2-3FT | 0.908 | 0.884 | 0.785 | 0.896 |
| IncRes-v2-All | 0.943 | 0.966 | 0.913 | 0.876 |
| IncRes-v2-FTCDW | 0.986 | 0.979 | 0.958 | 0.971 |
| IncRes-v2-FTCD | 0.971 | 0.954 | 0.922 | 0.969 |
| IncRes-v2-FTED | 0.964 | 0.962 | 0.918 | 0.946 |
| IncRes-v2-FTSD | 0.961 | 0.945 | 0.914 | 0.943 |
Note: The values in bold show the best performing model results.
Fig. 14.
Learning curves for training with the nine configurations: (a) ACC and (b) loss.
Fig. 15.
Learning curves for validation with the nine configurations: (a) ACC and (b) loss.
Fig. 16.
ROC curves for the nine configurations.
We tested the best model IncRes-v2-FTCDW with different values of learning rates and dropouts to find the optimal value. Table 3 summarizes the comparison of these values. A learning rate of 0.0003 and a dropout of 0.25 achieved the highest on the EyePACS test set and an ACC of 0.978 on the validation set.
Table 3.
Performance measures on different learning rates and dropout values.
| Learning rate | Dropout | Val ACC | Test AUC |
|---|---|---|---|
| 0.0001 | 0.25 | 0.964 | 0.972 |
| 0.0001 | 0.50 | 0.971 | 0.934 |
| 0.0002 | 0.25 | 0.968 | 0.961 |
| 0.0002 | 0.50 | 0.969 | 0.962 |
| 0.0003 | 0.25 | 0.978 | 0.986 |
| 0.0003 | 0.50 | 0.974 | 0.980 |
Note: The values in bold show the results for the best performing parameters.
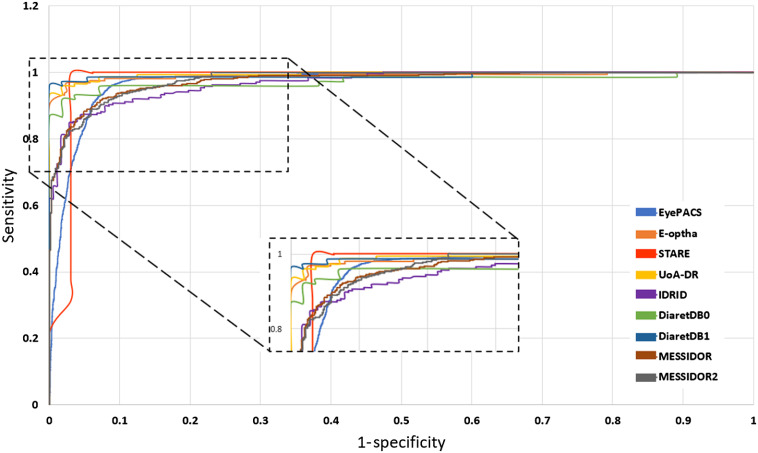
We selected the best model IncRes-v2-FTCDW, which achieved a high score on the EyePACS dataset (see Table 2) and tested this model on eight other datasets. For MESSIDOR, the model obtained an and . An interesting score was obtained on MESSIDOR-2 with and . The model gives an AUC of 0.986 and 0.988 for DIARETDB0 and DIARETDB1, respectively. The AUC scores of STARE, IDRID, E-ophtha, and UoA-DR were 0.964, 0.957, 0.984, and 0.990, respectively. The remaining results of other metrics such as SE, SP, and ACC are shown in Table 4. Figure 17 shows the ROC curves for the nine datasets. UoA-DR achieved the highest AUC with 0.990 and the minimum AUC was obtained by IDRID with 0.957.
Table 4.
Performance measures on nine datasets using the model with cosine learning rate warm-up (IncRes-v2-FTCDW).
| Datasets | ACC | AUC | SE | SP |
|---|---|---|---|---|
| EyePACS | 0.979 | 0.986 | 0.958 | 0.971 |
| MESSIDOR | 0.944 | 0.963 | 0.934 | 0.898 |
| MESSIDOR-2 | 0.962 | 0.979 | 0.967 | 0,891 |
| DIARETDB0 | 0.984 | 0.986 | 0.969 | 0.984 |
| DIARETDB1 | 0.971 | 0.988 | 0.968 | 0.901 |
| STARE | 0.957 | 0.964 | 0.889 | 0.912 |
| IDRID | 0.976 | 0.957 | 0.971 | 0.947 |
| E-ophtha | 0.984 | 0.984 | 0.968 | 0.922 |
| UoA-DR | 0.955 | 0.990 | 0.950 | 0.960 |
Note: The values in bold show the best performing model results.
Fig. 17.
ROC curves for the nine datasets.
5.2. Explainability of DR Detection
To explain the results of the deep model and see what DR signs led to the classification of the retinal image as DR, we use Grad-CAM.50 This technique does not require any changes to our proposed model architecture. It uses the gradient information flowing into the last convolutional layer in order to obtain a localization map highlighting the importance of each pixel of the input image and its contribution to the final classification. To compute Grad-CAM, the gradient of the score for a specific class , before the Softmax layer, is calculated and the global average pooled to obtain a neuron importance weight by the following equation:
| (6) |
where is the number of pixels in the feature map, is the gradient of the score for class , and represents the feature map of the last convolutional layer.
A weighted combination of forward activation maps followed by ReLU is obtained by the following equation:
| (7) |
The result is a coarse heatmap using ReLU activation, which allows to focus on the features that have a positive influence on the class of interest.
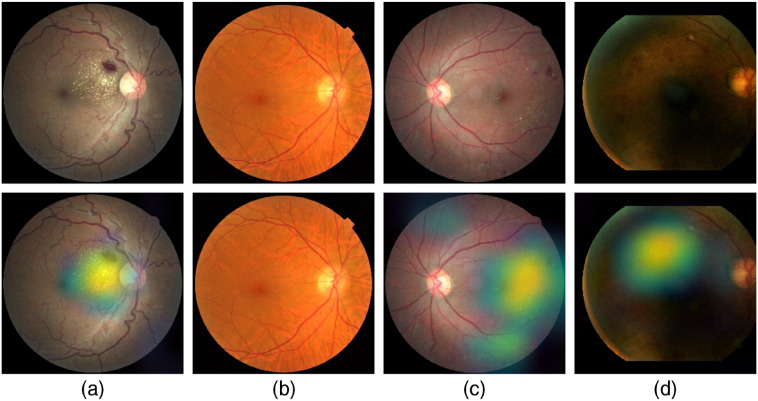
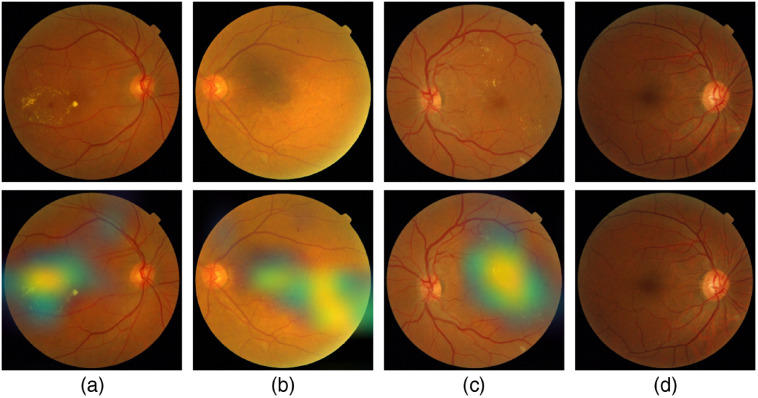
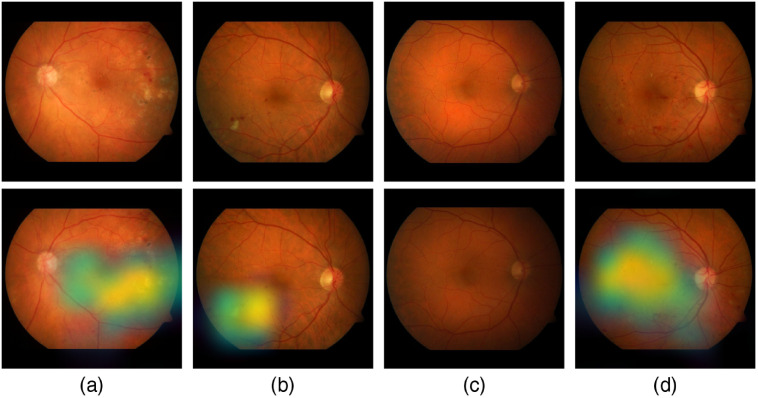
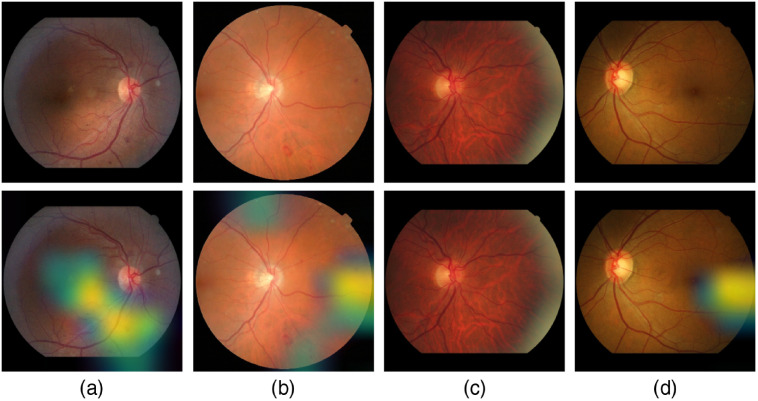
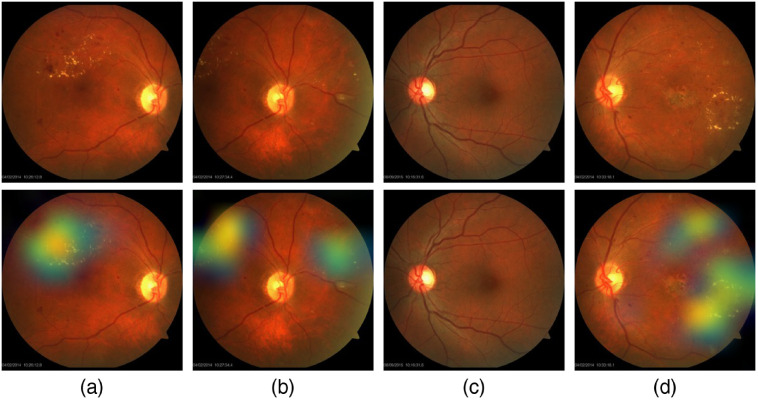
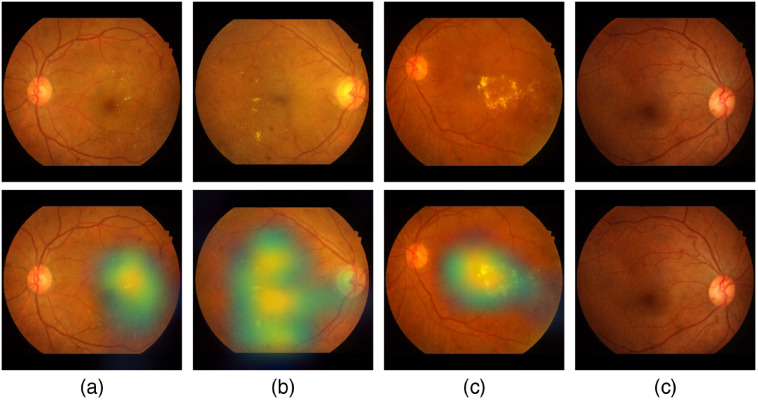
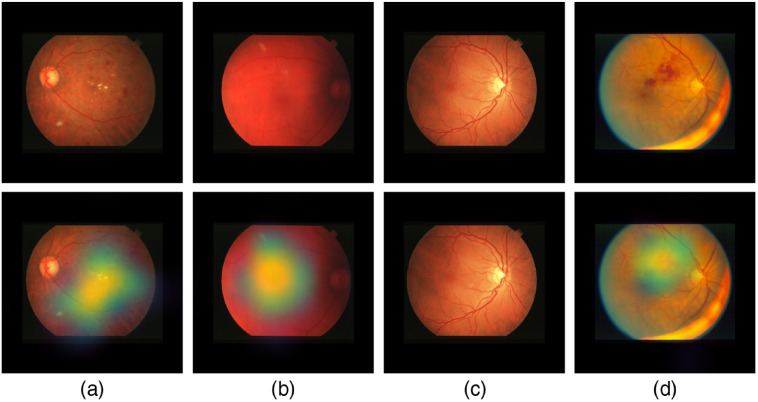
Figure 18 shows samples of TP and TN of the EyePACS dataset using Grad-CAM to localize (EX, HM, and MA) on retinal images. Similar results are shown for MESSIDOR and MESSIDOR-2. The proposed model detects HM, MA, and EX on retinal images as signs of DR (Fig. 19). This includes images having EX near macula, which are classified as DR as in the work of Mateen et al.,51 because EX are among the signs of DR.52,53 DIARETDB0 and DIARETDB1 (Fig. 20), STARE (Fig. 21), IDRID (Fig. 22), E-ophtha (Fig. 23), and UoA-DR (Fig. 24) are also shown. We can see that the heatmaps are located around the signs of DR, such as EX, MA, and HM. This explains the efficiency of the proposed deep learning approach in detecting DR signs and its high performance in DR classification.
Fig. 18.
Examples of true positive and true negative on EyePACS: (a) TP for EX and HM detected near the optic disc, (b) TN with no sign of DR, (c) TP includes EX, HM, and MA located on the right of the retina, and (d) TP for detected HM.
Fig. 19.
Examples of true positive and true negative on MESSIDOR and MESSIDOR-2 datasets: (a) TP for EX near macula, (b) TP includes detection of MA, (c) TP for EX detection, and (d) TN with no sign of DR.
Fig. 20.
Examples of true positive and true negative on DIARETDB0 and DIARETDB1 datasets: (a), (b) TP includes detection of MA and HM, (c) TN with no sign of DR, and (d) TP includes detection for soft EX, MA, and HM.
Fig. 21.
Examples of true positive and true negative on STARE dataset: (a) TP including the detection of EX and HM, (b) TP includes detection of MA, (c) TN with no sign of DR, and (d) TP including the detection of HM.
Fig. 22.
Examples of true positive and true negative on IDRID dataset: (a), (b) TP includes detection of EX and HM, (c) TP includes detection for hard EX and HM, and (c) TN with no sign of DR.
Fig. 23.
Examples of true positive and true negative on E-ophtha dataset: (a), (b) TP includes detection of MA and hemorrhage, (c) TN with no sign of DR, and (d) TP includes detection for soft EX and MA.
Fig. 24.
Examples of true positive and true negative on UoA-DR dataset: (a), (b) TP including the detection of EX and HM, (c) TN with no sign of DR, and (d) TP includes detection for EX and MA.
5.3. Comparison with Other Deep Networks
We compared our results to some of the recent works on DR classification presented in Sec. 1. Since not all of the works use the same metrics and dataset, it can be difficult to compare their performances. Tables 5 and 6 summarize the performance comparison with state-of-the-art methods using two popular datasets, EyePACS and MESSIDOR-2.
Table 5.
Performance comparison with state-of-the-art methods using EyePACS.
| Model | ACC | AUC | SE | SP | Training images | Source |
|---|---|---|---|---|---|---|
| Gulshan et al.17 | — | 0.991 | 0.903 | 0.981 | 128,175 | 9% public 91% proprietary |
| Voets et al.20 | — | 0.940 | 0.838 | 0.901 | 57,146 | 100% public |
| Grinsven et al.30 | — | 0.890 | 0.942 | 0.806 | 6679 | 100% public |
| Rakhlin et al.54 | — | 0.923 | 0.920 | 0.920 | 81,670 | 100% public |
| Lin et al.26 | 0.861 | 0.920 | 0.732 | 0.938 | 33,000 | 100% public |
| Zeng et al.32 | 0.949 | 0.950 | 0.807 | 28,100 | 100% public | |
| Ours | 0.979 | 0.986 | 0.958 | 0.971 | 71,056 | 100% public |
Note: The values in bold show the best performing model results.
Table 6.
Performance comparison with state-of-the-art methods using MESSIDOR-2.
| Model | ACC | AUC | SE | SP |
|---|---|---|---|---|
| Gulshan et al.17 | — | 0.961 | 0.939 | 0.961 |
| Voets et al.20 | — | 0.800 | 0.900 | 0.760 |
| Rakhlin et al.54 | — | 0.970 | 0.990 | 0.710 |
| Pratt et al.55 | 0.750 | — | 0.300 | 0.950 |
| Gargeya et al.56 | — | 0.940 | 0.930 | 0.870 |
| Ours | 0.962 | 0.979 | 0.967 | 0.891 |
Note: The values in bold show the best performing model results.
We can see that our work outperforms many state-of-the-art techniques on different metrics. We are only surpassed by the work of Gulshan et al.17 However, in this later work, they used a large private dataset having more than 120,000 images (91% training images are proprietary). Our work uses only publicly available datasets. Still, we have the best SE for the largest available dataset EyePACS (see Table 5), meaning that we have a better performance in measuring the proportion of actual positives that are correctly identified as such (e.g., the percentage of people who are correctly identified as having DR).
Table 7 summarizes some state-of-the-art techniques tested on the DIARETDB1 dataset. We can see that our proposed architecture gives the best AUC score. In addition, these comparative works, cited in Sec. 1, mostly tested their models on a limited number of datasets.60 Even though the work of Gulshan et al.17 has the best AUC using nonpublic images, they reported their results on two datasets only (EyePACS and MESSIDOR-2). This work gives a larger analysis on nine datasets and can help in benchmarking more techniques for DR detection.
Table 7.
Performance comparison with state-of-the-art methods using DIARETDB1 dataset.
| Model | AUC | ACC | SE | SP |
|---|---|---|---|---|
| Gondal et al.57 | — | — | 0.870 | — |
| Shan et al.58 | 0.913 | — | — | 0.916 |
| Quellec et al.59 | 0.954 | — | — | — |
| Ours | 0.988 | 0.971 | 0.968 | 0.901 |
Note: The values in bold show the best performing model results.
5.4. Analysis of Misclassifications
Using the best proposed model IncRes-v2-FTCDW, 184 images of the EyePACS test set were misclassified, 67 for MESSIDOR, 20 for MESSIDOR-2, 3 for DIARETDB0, 4 for DIARETDB1, 7 for E-ophtha, 12 for IDRID, 17 for STARE, and 9 for UoA-DR. Table 8 shows the error rate for each dataset. In each test set, we find some low-quality images such as being too bright, having camera artifacts, being dark or blurred, having a low contrast, etc. In the EyePACS dataset, 25% of the images were considered as ungradable by Rakhlin et al.54 due to their low quality, such as being out of focus or overexposed (see Fig. 25). These images show the complexity of DR classification in the presence of low-quality images.
Table 8.
Misclassification error rate for each dataset.
| Datasets | Number of test images | Error (%) |
|---|---|---|
| EyePACS | 8790 | 2.1 |
| MESSIDOR | 1200 | 5.6 |
| MESSIDOR-2 | 1748 | 3.8 |
| DIARETDB0 | 130 | 1.6 |
| DIARETDB1 | 89 | 2.9 |
| E-ophtha | 439 | 1.6 |
| IDRID | 516 | 2.4 |
| STARE | 397 | 4.3 |
| UoA-DR | 200 | 4.5 |
Fig. 25.
Examples of ungradable images in the EyePACS dataset.
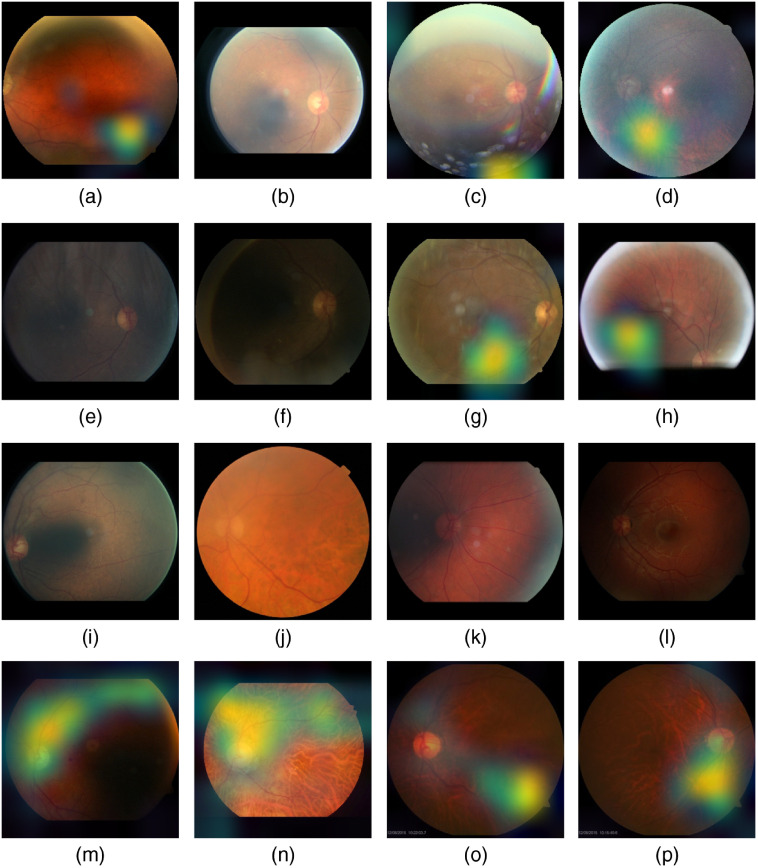
Figure 26 shows examples of FP and FN on the tested datasets. For example, Fig. 26(a) represents an FP from EyePACS. Here, the retinal image has artifacts, pale areas, and the details of the retina are not clear. In this case, the model detected the noise as hemorrhages and classified the image as DR. The same occurred in Fig. 26(d). In addition, this image has a red region that leads the model to classify it as DR. Figure 26(g), for example, was classified as DR (FP) because it contains noise with the same color and shape as EX. The same is true for Fig. 26(m) from DIARETDB1. Figures 26(b) and 26(c) are FNs from EyePACS. We can see that the images are too bright and the model is not able to detect signs of DR. In the opposite, Figs. 26(e) and 26(f) from EyePACS and (l) from DIARETDB0 are too dark making it difficult to see the signs of DR. For Fig. 26(j) from the MESSIDOR-2 dataset, its low contrast makes the signs of DR nonvisible and leads to it being an FN. Figure 26(i) from EyePACS and Fig. 26(k) from E-ophtha are blurred. The details of the retina are difficult to see except for the optic disc and some blood vessels, thus the models classify these images as normal. Figure 26(h) from EyePACS is an FP. This image is unfocused (underexposed) making it difficult for the model to get the right classification. Figure 26(n) from IDRID is an FP. We can see that the bad illumination makes the retina looks as if there is bleeding. Figures 26(o) and 26(p) from UoA-DR are FPs. We can see that the poor illumination and blur make the retina looks as if there is bleeding and the details are not easy to see. We can arguably conclude that the misclassifications are mainly due to the bad quality of the images in the dataset, which shows that the proposed model has a very interesting performance overall.
Fig. 26.
FP images and FN images in nine datasets: (a), (d), (g), and (h) FP: EyePACS; (b), (c), (e), (f), and (i) FN: EyePACS; (j) FN: MESSIDOR-2; (k) FN: E-ophtha; (l) FN: DIARETDB0; (m) FP: DIARETDB1; (n) FP: IDRID; (o) FP: UoA-DR; and (p) FP: UoA-DR.
6. Conclusion
In this work, we propose an end-to-end deep learning architecture for DR detection. We developed and fine-tuned a DCNN to increase the performance of detecting DRs. The proposed method uses transfer learning and cosine learning rate decay with warm up during training. The proposed network was trained on one public fundus image dataset (EyePACS) and tested on nine public datasets. Our work uses only publicly available datasets, which helps in future benchmarking with other developed techniques for DR detection. We show that the proposed approach can robustly classify fundus images and detect DRs. The obtained results on these datasets show the higher performance obtained by our network and its generalization ability across multiple datasets. An explainability model was developed and showed that our model was able to efficiently identify different signs of DR and detect this health issue. The obtained results outperform past published works relying on training using only publicly available datasets. Future work includes testing with other deep architectures and the use of more images for training. In addition, the approach will be adapted to the classification of other types of medical images and diseases.
Acknowledgments
This work was partially supported by the New Brunswick Health Research Foundation (NBHRF). This research was enabled in part by support provided by WestGrid61 and Compute Canada.62 The NVIDIA Quadro P6000 used for this research was donated by the NVIDIA Corporation.
Biographies
Mohamed Chetoui received his BScA degree in business intelligence from the Institut Supérieur d’Ingénierie et des Affaires, Morocco. He is an MSc student and research assistant at the Perception, Robotics, and Intelligent Machines Group of the Université de Moncton. His research interests include machine learning, deep learning, computer vision, and business intelligence.
Moulay A. Akhloufi received his MSc and PhD degrees in electrical engineering from the École Polytechnique of Montreal and Laval University, Canada, respectively. He is a professor in computer science at the University of Moncton and the head of the Perception, Robotics, and Intelligent Machines Group. He is the author of more than 100 journal and conference papers. His current research interests include machine learning, deep learning, and computer vision. He is a senior member of IEEE and a member of SPIE.
Disclosures
The authors declare no conflicts of interest.
Contributor Information
Mohamed Chetoui, Email: emc7409@umoncton.ca.
Moulay A. Akhloufi, Email: akhloufi@gel.ulaval.ca.
References
- 1.Buch H., Vinding T., Nielsen N. V., “Prevalence and causes of visual impairment according to world health organization and United States criteria in an aged, urban Scandinavian population: the Copenhagen city eye study,” Ophthalmology 108(12), 2347–2357 (2001). 10.1016/S0161-6420(01)00823-5 [DOI] [PubMed] [Google Scholar]
- 2.Chetoui M., Akhloufi M. A., Kardouchi M., “Diabetic retinopathy detection using machine learning and texture features,” in IEEE Can. Conf. Electr. Comput. Eng. (CCECE), IEEE, pp. 1–4 (2018). 10.1109/CCECE.2018.8447809 [DOI] [Google Scholar]
- 3.Ojala T., Pietikäinen M., Harwood D., “A comparative study of texture measures with classification based on feature distributions,” Pattern Recognit. 29, 51–59 (1996). 10.1016/0031-3203(95)00067-4 [DOI] [Google Scholar]
- 4.Tan X., Triggs B., “Enhanced local texture feature sets for face recognition under difficult lighting conditions,” IEEE Trans. Image Process. 19, 1635–1650 (2010). 10.1109/TIP.2010.2042645 [DOI] [PubMed] [Google Scholar]
- 5.Sarfraz M., Hellwich O., “Head pose estimation in face recognition across pose scenarios,” in Int. Conf. Comput. Vision Theory and Appl., VISAPP, Vol. 1, pp. 235–242 (2008). [Google Scholar]
- 6.Decencière E., Zhang X., Cazuguel G., et al. , “Feedback on a publicly distributed image database: the Messidor database,” Image Anal. Stereol. 33(3), 231–234 (2014). 10.5566/ias.1155 [DOI] [Google Scholar]
- 7.Simonyan K., Zisserman A., “Very deep convolutional networks for large-scale image recognition,” arXiv:1409.1556 abs/1409.1556, https://arxiv.org/abs/1409.1556 (2014).
- 8.Szegedy C., et al. , “Going deeper with convolutions,” in Proc. IEEE Conf. Comput. Vision and Pattern Recognit., pp. 1–9 (2015). 10.1109/CVPR.2015.7298594 [DOI] [Google Scholar]
- 9.He K., et al. , “Deep residual learning for image recognition,” in Proc. IEEE Conf. Comput. Vision and Pattern Recognit., pp. 770–778 (2016). 10.1109/CVPR.2016.90 [DOI] [Google Scholar]
- 10.Mansour R. F., “Deep-learning-based automatic computer-aided diagnosis system for diabetic retinopathy,” Biomed. Eng. Lett. 8(1), 41–57 (2018). 10.1007/s13534-017-0047-y [DOI] [PMC free article] [PubMed] [Google Scholar]
- 11.Krizhevsky A., Sutskever I., Hinton G. E., “Imagenet classification with deep convolutional neural networks,” in Advances in Neural Information Processing Systems, Pereira F., et al., Eds., Vol. 25, pp. 1097–1105, Curran Associates, Inc, New York: (2012). [Google Scholar]
- 12.Mortensen E. N., Deng H., Shapiro L., “A SIFT descriptor with global context,” in IEEE Comput. Soc. Conf. Comput. Vision and Pattern Recognit. (CVPR’05), IEEE, Vol. 1, pp. 184–190 (2005). 10.1109/CVPR.2005.45 [DOI] [Google Scholar]
- 13.Ringnér M., “What is principal component analysis?” Nat. Biotechnol. 26, 303–304 (2008). 10.1038/nbt0308-303 [DOI] [PubMed] [Google Scholar]
- 14.Balakrishnama S., Ganapathiraju A., “Linear discriminant analysis: a brief tutorial,” Inst. Signal Inf. Process., McGill University, Montreal, Canada: (1998). [Google Scholar]
- 15.Chalakkal R. J., et al. , “An efficient framework for automated screening of clinically significant macular edema,” arXiv:2001.07002, https://arxiv.org/abs/2001.07002v1 (2020). [DOI] [PubMed]
- 16.Abdulla W., Chalakkal R. J., “University of Auckland diabetic retinopathy (UoA-DR) database,” (2018).
- 17.Gulshan V., et al. , “Development and validation of a deep learning algorithm for detection of diabetic retinopathy in retinal fundus photographs,” J. Am. Med. Assoc. 316(22), 2402–2410 (2016). 10.1001/jama.2016.17216 [DOI] [PubMed] [Google Scholar]
- 18.Szegedy C., et al. , “Rethinking the inception architecture for computer vision,” in Proc. IEEE Conf. Comput. Vision and Pattern Recognit., pp. 2818–2826 (2016). 10.1109/CVPR.2016.308 [DOI] [Google Scholar]
- 19.EyePACS, “Diabetic retinopathy detection,” 2015, www.kaggle.com/c/diabetic-retinopathy-detection/data.
- 20.Voets M., Møllersen K., Bongo L. A., “Reproduction study using public data of: Development and validation of a deep learning algorithm for detection of diabetic retinopathy in retinal fundus photographs,” PLoS ONE 14(6), e0217541 (2019). 10.1371/journal.pone.0217541 [DOI] [PMC free article] [PubMed] [Google Scholar]
- 21.Roy P., et al. , “A novel hybrid approach for severity assessment of diabetic retinopathy in colour fundus images,” in IEEE 14th Int. Symp. Biomed. Imaging (ISBI 2017), pp. 1078–1082 (2017). 10.1109/ISBI.2017.7950703 [DOI] [Google Scholar]
- 22.Breiman L., “Random forests,” Mach. Learn. 45, 5–32 (2001). 10.1023/A:1010933404324 [DOI] [Google Scholar]
- 23.Orlando J. I., et al. , “An ensemble deep learning based approach for red lesion detection in fundus images,” Comput. Methods Prog. Biomed. 153, 115–127 (2018). 10.1016/j.cmpb.2017.10.017 [DOI] [PubMed] [Google Scholar]
- 24.DIARETDB1, “Standard diabetic retinopathy database calibration level 1,” 2007, http://www.it.lut.fi/project/imageret/diaretdb1.
- 25.E-ophtha, “E-ophtha: a color fundus image database,” 2013, http://www.adcis.net.
- 26.Lin G.-M., et al. , “Transforming retinal photographs to entropy images in deep learning to improve automated detection for diabetic retinopathy,” J. Ophthalmol. 2018, 2159702 (2018). 10.1155/2018/2159702 [DOI] [PMC free article] [PubMed] [Google Scholar]
- 27.Doshi D., et al. , “Diabetic retinopathy detection using deep convolutional neural networks,” in Int. Conf. Comput., Anal. Secur. Trends (CAST), p. 6142839 (2016). [Google Scholar]
- 28.Wang Z., et al. , “Zoom-in-net: deep mining lesions for diabetic retinopathy detection,” in Int. Conf. Medical Image Computing and Computer-Assisted Intervention, Descoteaux M., et al., Eds., Vol. 10435, Springer, Cham, Switzerland, pp. 267–275 (2017). [Google Scholar]
- 29.Brown J. M., et al. , “Automated diagnosis of plus disease in retinopathy of prematurity using deep convolutional neural networks,” JAMA Ophthalmol. 136(7), 803–810 (2018). 10.1001/jamaophthalmol.2018.1934 [DOI] [PMC free article] [PubMed] [Google Scholar]
- 30.Grinsven M. V., et al. , “Fast convolutional neural network training using selective data sampling: Application to hemorrhage detection in color fundus images,” IEEE Trans. Med. Imaging 35, 1273–1284 (2016). 10.1109/TMI.2016.2526689 [DOI] [PubMed] [Google Scholar]
- 31.Colas E., et al. , “Deep learning approach for diabetic retinopathy screening,” Acta Ophthalmol. 94 (2016). 10.1111/j.1755-3768.2016.0635 [DOI] [Google Scholar]
- 32.Zeng X., et al. , “Automated detection of diabetic retinopathy using a Binocular Siamese-like convolutional network,” in IEEE Int. Symp. Circuits Syst. (ISCAS), pp. 1–5 (2019). 10.1109/ISCAS.2019.8702328 [DOI] [Google Scholar]
- 33.Chalakkal R. J., Abdulla W. H., Thulaseedharan S. S., “Quality and content analysis of fundus images using deep learning,” Comput. Biol. Med. 108, 317–331 (2019). 10.1016/j.compbiomed.2019.03.019 [DOI] [PubMed] [Google Scholar]
- 34.Li Y. H., et al. , “Computer-assisted diagnosis for diabetic retinopathy based on fundus images using deep convolutional neural network,” Mob. Inf. Syst. 2019, 1–14 (2019). 10.1155/2019/6142839 [DOI] [Google Scholar]
- 35.Deng J., et al. , “Imagenet: a large-scale hierarchical image database,” in IEEE Conf. Comput. Vision and Pattern Recognit., IEEE, pp. 248–255 (2009). 10.1109/CVPR.2009.5206848 [DOI] [Google Scholar]
- 36.DIARETDB0, “Standard diabetic retinopathy database calibration level 0,” 2007, http://www.it.lut.fi/project/imageret/diaretdb0 (accessed July 2020).
- 37.STARE, “Structured analysis of the retina,” 1975, http://cecas.clemson.edu/ahoover/stare (accessed July 2020).
- 38.IDRID, “Indian diabetic retinopathy image dataset,” 2018, https://idrid.grand-challenge.org (accessed July 2020).
- 39.Chalakkal R. J., Abdulla W. H., Sinumol S., “Comparative analysis of university of Auckland diabetic retinopathy database,” in Proc. 9th Int. Conf. Signal Process. Syst. (ICSPS 2017), pp. 235–239, Association for Computing Machinery, New York: (2017). [Google Scholar]
- 40.Heaven W. D., “Google’s medical AI was super accurate in a lab. Real life was a different story,” 2020, https://www.technologyreview.com/2020/04/27/1000658/google-medical-ai-accurate-lab-real-life-clinic-covid-diabetes-retina-disease/ (accessed July 2020).
- 41.Rufaida S. I., Fanany M. I., “Residual convolutional neural network for diabetic retinopathy,” in Int. Conf. Adv. Comput. Sci. and Inf. Syst. (ICACSIS), pp. 367–374 (2017). [Google Scholar]
- 42.Nibali A., He Z., Wollersheim D., “Pulmonary nodule classification with deep residual networks,” Int. J. Comput. Assist. Radiol. Surg. 12(10), 1799–1808 (2017). 10.1007/s11548-017-1605-6 [DOI] [PubMed] [Google Scholar]
- 43.Costa P., et al. , “EyeWeS: weakly supervised pre-trained convolutional neural networks for diabetic retinopathy detection,” in 16th Int. Conf. Mach. Vision Appl. (MVA), IEEE, pp. 1–6 (2019). 10.23919/MVA.2019.8757991 [DOI] [Google Scholar]
- 44.Zaeemzadeh A., Rahnavard N., Shah M., “Norm-preservation: why residual networks can become extremely deep?,” IEEE Trans. Pattern Anal. Mach. Intell. (2018). [DOI] [PubMed] [Google Scholar]
- 45.Popovic N., et al. , “Manually segmented vascular networks from images of retina with proliferative diabetic and hypertensive retinopathy,” Data Brief 18, 470–473 (2018). 10.1016/j.dib.2018.03.041 [DOI] [PMC free article] [PubMed] [Google Scholar]
- 46.Goyal P., et al. , “Accurate, large minibatch SGD: training imagenet in 1 hour,” CoRR abs/1706.02677, https://arxiv.org/abs/1706.02677v2 (2017).
- 47.He T., et al. , “Bag of tricks for image classification with convolutional neural networks,” in Proc. IEEE Conf. Comput. Vision and Pattern Recognit., pp. 558–567 (2019). 10.1109/CVPR.2019.00065 [DOI] [Google Scholar]
- 48.TensorFlow, “Tensorflow,” 2015, https://www.tensorflow.org (accessed July 2020).
- 49.NVIDIA, “QUADRO P6000,” 2018, https://www.nvidia.com/content/dam/en-zz/Solutions/design-visualization/productspage/quadro/quadro-desktop/quadro-pascal-p6000-data-sheet-us-nv-704590-r1.pdf (accessed July 2020).
- 50.Selvaraju R. R., et al. , “Grad-CAM: visual explanations from deep networks via gradient-based localization,” IEEE Int. Conf. Comput. Vision (ICCV), Venice, Italy, pp. 618–626 (2017). [Google Scholar]
- 51.Mateen M., et al. , “Exudate detection for diabetic retinopathy using pretrained convolutional neural networks,” Complexity 2020, 5801870 (2020). 10.1155/2020/5801870 [DOI] [Google Scholar]
- 52.Yu S., Xiao D., Kanagasingam Y., “Exudate detection for diabetic retinopathy with convolutional neural networks,” in 39th Annu. Int. Conf. IEEE Eng. Med. and Biol. Soc. (EMBC), pp. 1744–1747 (2017). 10.1109/EMBC.2017.8037180 [DOI] [PubMed] [Google Scholar]
- 53.Adem K., “Exudate detection for diabetic retinopathy with circular Hough transformation and convolutional neural networks,” Expert Syst. Appl. 114, 289–295 (2018). 10.1016/j.eswa.2018.07.053 [DOI] [Google Scholar]
- 54.Rakhlin A., “Diabetic retinopathy detection through integration of deep learning classification framework,” bioRxiv 225508, 11, https://www.biorxiv.org/content/10.1101/225508v2.full (2018).
- 55.Pratt H., et al. , “Convolutional neural networks for diabetic retinopathy,” Procedia Comput. Sci. 90, 200–205 (2016). 10.1016/j.procs.2016.07.014 [DOI] [Google Scholar]
- 56.Gargeya R., Leng T., “Automated identification of diabetic retinopathy using deep learning,” Ophthalmology 124(7), 962–969 (2017). 10.1016/j.ophtha.2017.02.008 [DOI] [PubMed] [Google Scholar]
- 57.Gondal W. M., et al. , “Weakly-supervised localization of diabetic retinopathy lesions in retinal fundus images,” in IEEE Int. Conf. Image Process. (ICIP), IEEE, pp. 2069–2073 (2017). 10.1109/ICIP.2017.8296646 [DOI] [Google Scholar]
- 58.Shan J., Li L., “A deep learning method for microaneurysm detection in fundus images,” in IEEE First Int. Conf. Connected Health: Appl., Syst. and Eng. Technol. (CHASE), IEEE, pp. 357–358 (2016). 10.1109/CHASE.2016.12 [DOI] [Google Scholar]
- 59.Quellec G., et al. , “Deep image mining for diabetic retinopathy screening,” Med. Image Anal. 39, 178–193 (2016). 10.1016/j.media.2017.04.012 [DOI] [PubMed] [Google Scholar]
- 60.Asiri N., et al. , “Deep learning based computer-aided diagnosis systems for diabetic retinopathy: a survey,” Artif. Intell. Med. 99, 101701 (2019). 10.1016/j.artmed.2019.07.009 [DOI] [PubMed] [Google Scholar]
- 61.WestGrid, https://www.westgrid.ca/ (accessed 17 August 2020).
- 62.Compute Canada, https://www.computecanada.ca/ (accessed 17 August 2020).


