

Abstract
Background:
The design of cities has been heavily influenced by the needs of private motor vehicles, resulting in significant population and planetary health challenges. Death and injury due to motor vehicle crashes is now the world’s 5th leading cause of mortality and morbidity and motor vehicle-related air pollution accounts for 4.2 million deaths per year. This study highlights the global importance of urban design as a factor through which challenges associated with rapid motorisation and road transport injury may be mitigated.
Methods:
Urban characteristics were obtained from sample maps for 1692 cities capturing one third of the world’s population. Applying a combined convolutional neural network and graph-based approach, cities were classified into unique types based on selected urban design characteristics represented in sample maps. Associations between identified city types and the burden of road transport injury were estimated using data from the most recent Global Burden of Disease (GBD) study while controlling for the effect of economic activity.
Findings:
After screening for outliers, nine city types based on 1632 cities were identified that captured the diversity of global urban design configurations and were associated with differences in road transport injury rates. After controlling for economic activity at the city level, burden of road transport injury was an estimated 2x higher (RR=2.00) for the poorest performing city type as compared to the best performing city type. An estimated total loss of 9.6 million DALYs per year to road transport injury were attributed to suboptimal urban design. In general, city types that emphasised combined dense road networks with smaller blocks and more prevalent railed public transport networks demonstrated the lowest rates of road traffic injury per person.
Interpretation:
With a 2-fold difference observed in the total estimated burden of road transport injury between the best performing city type and the worst performing city types, this study highlights the important role that urban design can play in creating circumstances for the generation of road traffic injury. More upstream investment in promoting urban design that supports transport mode shift that places people within lower risk transport modes such as rail or safe active transport could deliver consequent reductions in road transport injury.
Introduction
The design of cities that evolved during the twentieth century has been heavily influenced by the needs of private motor vehicles1. This influence is reflected in the dramatic increase over-time in distances travelled by the population in private motor vehicles2–4. The benefit of building cities to accommodate motor vehicles has been mixed. Considerable economic and industrial benefit has accrued as a consequence of the motor vehicle industry5,6, yet significant population and planetary health challenges have arisen as a consequence7,8. For example, death and injury due to motor vehicle crashes is now the world’s 5th leading cause of mortality and morbidity9,10 claiming an estimated 1.35 million lives per year and 50 million non-fatal injuries11. Adding to this burden is escalating exposure to motor vehicle-related air pollution which accounts for 4.2 million deaths per year12, with particulate pollution (PM2.5, PM10) reducing average life expectancy by 1.8 years per person13,14. The costs associated with managing a predominantly private motor vehicle transport system are also significant. They include costs associated with habitat destruction15,16, escalating costs in managing injury insurance and legal systems17,18, the ongoing costs of building and maintaining road and parking infrastructure19,20, and the costs of transport-related policing and law enforcement activities21.
Urban design interventions that can reduce dependence upon private vehicle transport without creating reductions in population mobility or productivity may be critical for preventing many of the environmental and public health issues facing 21st century cities22,23. However, understanding the association between urban design features and health or environmental outcomes remains difficult, especially when underlying data, locations, models, methods, and demographics upon which statistical models are developed vary considerably between studies24,25.
Opportunities to enhance population health and to mitigate the negative externalities arising from private motor vehicle use have been described in the recent Lancet Series on Urban Design, Transport and Health1,2,26. In a paper arising from the series, Stevenson et. al,1 compared six geographically diverse cities to estimate health gains that could be achieved through strategies that emphasised compact urban design; defined as a city with reduced private motor-vehicle use, a re-orientation toward public and active urban transport (walking and cycling) and greater mixed land-use. The paper highlighted that reductions in total disability adjusted life years (DALYs) lost, of between 420 and 826 per 100,000 population could be achieved across combined reductions in road transport injury, type II diabetes, cardiovascular disease, and respiratory disease1.
Studies that examine associations between urban design and population health assist to provide macro-level guidance for urban and city planners to maximize population health outcomes27. As cities are complex, dynamic systems, it is critical that researchers take a systems-oriented approach to understanding cities and the concomitant health of residents22,28–30. It is also critical that, where possible, researchers access standardised global sources of data and health information so that valid between-city, country, or regional comparisons can be readily made, rather than relying on methods such as land-use regression models, which may not prove generalisable25. This paper embraces this approach, using advances in remote sensing, artificial intelligence, complexity science, and the availability of global geospatial data to identify the design of cities associated with the highest burden of road transport injury. Providing a global perspective on road trauma is crucial, particularly as low- and middle-income countries are rapidly motorising31 and where the identification of strategies to reduce growing burden of road transport-related injury is increasingly urgent.23. As such, this study’s aims are two-fold; 1) to utilise contemporary methods of inquiry drawn from the field of artificial intelligence and machine learning to identify global city typologies, and 2) to determine whether derived urban typologies are associated with variation road transport injury rates32.
Methods
City sampling
A list of 1692 global cities with populations exceeding 300,000 residents was identified from the 2015 United Nations world population prospect33. This list captured cities housing a combined 2.2 billion people or approximately 31% of the world’s population. Map images for each city were obtained using a 2-stage approach.
In the first stage, a circular baseline image sampling area was calculated for each city with a centroid derived from the United Nations dataset33 and an initial minimum radius of 1.5 km. As each city’s population size increased, the sampling area from which images of the city were extracted increased by a power of 0.85 to the proportional increase in population34. Standardising the sampling area in this way avoided socio-political discrepancies related to urban boundaries35. Further, it captured differences in urban density between cities while also appropriately adjusting for areas of the world’s mega-cities (e.g., Tokyo, Japan and Delhi, India). The sampling area for each city was adjusted for the earth’s curvature at various latitudes36.
The second sampling stage involved selecting precinct-level image representations of each city using a customised version of Google Static Maps37 of approximately 400 × 400m at a resolution of 256 × 256 pixels. Each image provided a high-level abstraction of the urban characteristics of interest namely, road networks, rail transit networks, water bodies, and designated parks or greenspace. Images containing only water did not provide insight into urban form and were re-sampled. All South Korean cities were removed from the sample (n = 25) due to South Korean government restrictions on the availability of map information at the scale used in this study,38 hence the sample comprised 1667 cities.
Figure 1 shows four typical precinct-level images for Paris, France39. A total of 1000 images were generated for each city, producing a final dataset containing 1.667 million map images.
Figure 1.

Four sample images for Paris, France demonstrating combinations of rail transit networks (orange), green space (green), water bodies (blue), and road infrastructure (black)39.
City image classification
With the map image database for each city established, a convolutional neural network based on ‘Inception V3’ architecture40 was used to determine whether cities could be correctly classified based on the urban design characteristics present within the sample maps (hereby referred to as ‘the model’). The model was calibrated using a supervised learning procedure that passed through 2 phases; a training phase featuring 75% of images (1,250,250 maps) where it learned which images were associated with which city, and a validation phase (25%, or 416,750 images), where it tested model performance. During the validation phase, the model predicted the probability that each validation image was from each of the 1,667 cities, including its actual ‘ground truth’ location. An accuracy of 86% correct classification for the validation set was achieved after iteration over 300 epochs whereupon a 1667×1667 confusion matrix41 was generated. This confusion matrix was a table that showed the frequency that maps from any individual city were incorrectly predicted (i.e., confused) by the model to be from an alternative city. When city map images from the validation set were confused between the actual city location and an alternate city, it indicated that shared features existed between maps from each location. However, whilst the goal of most convolutional neural network applications used for image recognition is model accuracy, our primary interest was not in those maps the model correctly predicted, but in the mistakes it made in confusing one city for another. The more the model confused cities for one another, the more likely they were likely to share similar urban design features.
Though it did not strictly form part of the analysis for this stage, within city-type similarities were also confirmed by subjective visual analysis by the research team and additional objective methods that included descriptive statistics associated with pixel colour counts and block-size and regularity measures using flood-fill techniques for individual cities (see Appendix A). Subsequent analyses therefore assume that confused cities shared at least some common urban design characteristics observable through the extracted maps.
Identification of city types
Graph-based analysis using the Force Atlas 2 algorithm42 was then applied to all cities in the confusion matrix that demonstrated an aggregated weighted degree of > 1. One outlier city, Effon, Alaiye, Nigeria, was removed from analysis as it contained predominantly unmapped white space, which resulted in a weighted network degree 14.5 times that of the next highest city, Brussels. This process produced a spatially representative network graph comprising 1641 cities where groups of cities more often confused for one another in the model tended to appear closer together in the network. Conversely, those least similar (i.e., cities that were rarely or never confused for one another) were represented as further apart. A modularity analysis43,44 was then performed on the graph with a resolution of 1.1045 to identify groups comprising individual city types. Conceptually similar to cluster analysis, modularity analysis is a technique that enables potentially non-trivial community structures to be identified in connected graphs based on the extent to which graph nodes share greater connection (through shared vertices) with other nodes in their group than those outside the group. The number of modules contained within the graph was not pre-determined.
City types and road transport injuries
To investigate the association between city types and burden of road transport injury we estimated burden using data from the Global Burden of Disease (GBD) study46. Road transport injuries (ICD-10-CM V00-V89) were reported as DALYs (Disability Adjusted Life Years)46 lost for drivers and passengers, motorcyclists, pedestrians and cyclists across each city type. DALYs are a combination of the sum of the years of potential life lost due to premature mortality (YLLs) and years of productive life lost due to a disability (YLDs) per 100,000 population47. As GBD data is only available at a country level, mean DALY rates were calculated for all cities within each city type based on their country-level disease-burden estimates. We then produced a population-weighted estimate of total road injury burden that incorporated the influence of multiple cities and country level rate estimates from within each city type. For example, if DALYs from country x made up y proportion of the total estimated population captured within city type z, then total road injury burden for the contribution of cities from within country x were inflated or discounted to reflect this proportional contribution (i.e., individual city population * country DALY rate / total within city-type population).
The proportion of land area dedicated to road and rail networks for cities in each city type (based on pixel colour counts from each individual city map image – 1.667 million images) was calculated and regressed on the burden of road transport injury for each city type. Risk ratios (RR) for road transport injury for each city type were estimated for varying transport modes (motor vehicle drivers and passengers, pedestrians and bicyclists, and motorcyclists) and compared between city types. Using the RR and city populations, we then estimated the total DALYs lost to road transport injury for populations contained within each city type and estimated the aggregate excess DALYs lost for each city type relative to the risks associated with the lowest-risk city type.
To assess the association between city type and mean road transport injury rates, 2 × 3 multivariate analysis of variance (MANOVA) was undertaken using city type as the independent variable, and 1) driver and passenger injury rates, 2) motorcycle injury rate, and 3) pedestrian and cyclist injury rate as the dependent variables. To control for the effect of economic activity within locations, Fossil Fuel Data Assimilation System (FFDAS)48 readings were collected at a city-level and broken into quintiles (<= .16, .17 to .57, .58 to 1.37, 1.38 to 3.23, >= 3.24). The FFDAS is a measure of fossil fuel emissions available at a global, city-level scale that expresses emissions as a product of population density, per capita economic activity, energy and carbon intensity of the economy. While it does not measure units of per-capita productivity, it can be used as a means of understanding the magnitude of variation in economic activity between locations. A univariate ANOVA was also undertaken to assess the association between City Type and FFDAS on overall road trauma rates (injuries within all transport modes combined).
Results
Identification and characteristics of city types
The analysis produced a set of 17 city types represented by modules. Eight ‘outlier’ modules (representing just nine cities in total) were removed from further analysis leaving a total of nine city types from 1632 cities. The nine city types are represented in Figure 2 by different colours and can be identified by the numbers in the chart inset. Given the detail in this chart, we recommend accessing the interactive, searchable version available for download in Appendix B. The list of cities included in this analysis alongside their identified urban design type is available in Appendix C.
Figure 2.

Network graph of the model’s confusion matrix, featuring all 1632 cities and city types (inset).
Descriptive city-type titles, alongside a representative city and map image from the nine city types is presented in Table 1 and Figure 3 outlines the global distribution of the city types described in Table 1. Further details on each city type across elements associated with: i) geographic location, ii) characteristics of the urban design including average block size and intersection intensity, and iii) the total population captured by cities contained within each city type are described in Appendix A.
Table 1.
Representative cities and sample map images by city type.
| City Type | Name of City Type | Representative City | Sample Map Images |
|---|---|---|---|
| 1 | Informal (INF) | Hyderabad, India |  |
| 2 | Irregular (IRR) | Beijing, China |  |
| 3 | Large block (LBL) | Saint Petersburg, Russia | 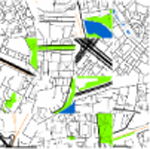 |
| 4 | Cul de sac (CUL) | Jakarta, Indonesia | 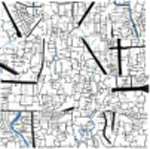 |
| 5 | High transit (HTR) | Paris, France |  |
| 6 | Motor city (MOT) | Los Angeles, USA |  |
| 7 | Chequerboard (CHQ) | Mexico City, Mexico |  |
| 8 | Intense (INT) | Osaka, Japan |  |
| 9 | Sparse (SPR) | Dar Es Salaam, Tanzania |  |
Figures 3.

Global distribution of identified city types.
Figures 4a and 4b highlight the association between the mean proportion of land area dedicated to road (a) and rail (b) networks in each city type and the estimated mean DALYs lost to road transport injury. Considerable differences in the mean proportions of land dedicated to road and rail transport networks were observed across city types. For example, the High Transit, Motor City, and Intense city types featured a combination of high percentage of land space allocated to both road and rail networks. Irregular, Sparse and Informal city types contained limited land dedicated to roads or rail. Taken independently, the observed proportion of road and rail transport networks within city types measured via pixel counts showed a strong negative correlation to road transport injury. The percentage of land area dedicated to railed transport networks accounted for most of the variance (R2=0.79) highlighting those cities with considerable rail networks have a reduced burden of road transport injury. Although the direction of effect is similar for road transport networks, they accounted for 17% of the variance in road transport injury. Together, the combination of land-area devoted to road and rail transport networks accounted for 85% of the variance in road transport injury, suggesting that the burden of road transport injury was lower in cities featuring both a high percentage of land dedicated to more intense road and rail networks (e.g., HTR and INT cities). However, caution needs also to be taken in understanding the shape and structure of road networks as discerned by the city types (see Table 1), not just their proportional representation. Appendix A includes additional analysis demonstrating differences in block size and shape between city types and the association between these characteristics and road transport injury rates.
Figures 4a-b.

Association between city types dedicated to road (4a) and rail (4b) networks and DALYs lost to road transport injury per 100,000 population.
Road transport injuries and city types
Figures 5a-5d highlight differences in the mean estimated DALYs lost to road transport injury for drivers and passengers, motorcyclists, and pedestrians and cyclists across each city type per 100,000 population. Overall, High Transit, Intense, and Motor Cities performed best, demonstrating a reduced total burden of road transport injury (see Figure 5d). High Transit city types were the only group that showed reduced injury burden for all road user types. By contrast, estimates for Irregular, Chequerboard, and Informal city types with neither a high proportion of road or rail networks nor smaller block sizes performed poorly. Results of the univariate ANOVA with estimated effect sizes (η2) showed a main effect for differences in total road transport DALYs lost per person for City Type (F (8, 1587) = 34.65, p < .001, η2 = .15) and the interaction term of City Type and FFDAS (F (32, 1587) = 2.38, 32, p<.001, η2 = 0.05) but not FFDAS. The nature of the interaction effect showed that increases in FFDAS led to increased road transport injury within some city types but decreases within others (see Figure 6). A similar pattern of results was obtained in the MANOVA. It showed that while City Type was strongly associated with differences in road transport injury DALY rates across combined (η2 = .20) and individual mode types ((i.e., motorcycle injuries (η2 = 0.16), pedestrian and cyclist injuries (η2 = 0.27), and drivers and passenger injuries (η2 = 0.15)) and the interaction term between City Type and FFDAS was again significant (η2 = 0.05), FFDAS was not associated with road transport injury on the multivariate tests, nor associated with differences by individual transport mode (p > .05).
Figures 5a-d.

Mean Disability Adjusted Life Years (DALYs) per 100,000 population lost due to road transport injuries with 95% confidence intervals by road-user and city type, with grand mean for road user type indicated by the vertical line.
Figure 6.

Estimated Disability Adjusted Life Years (DALYs) lost to road transport injury associated with City Type and FFDAS quintiles.
The network graph (see Figure 7) highlights that city types proximal to one another (in the graph) showed similar patterns of road transport injury. Motor Cities, which demonstrated regular, grid-based, motor-vehicle oriented transport-networks are situated on the extreme left of the graph and are therefore least like those on the extreme right that feature more irregular, informal road networks (e.g., Informal, Cul de Sac, Intense, and Sparse cities). Motor Cities were adjacent to Large Block, High Transit, and Chequerboard city types indicating similarities in urban design, but they also show concordance in the extent and nature of the burden of injury among road user categories; that is, they showed high rates of driver and passenger injuries. The mean burden of injury for motor vehicle drivers and passengers in these car-oriented city types was 406 DALYs lost per 100,000 population, or 1.53 times greater than in remaining types.
Figure 7.

Network graph of city types, road user groups and road transport injury.
The rates of motorcycle injury showed similar links between urban design and elevated road transport injury within modes. Intense, Cul de Sac, Sparse, Chequerboard, and Informal city types featuring either tight street networks suited to navigation by motorcycles, and also featured in countries with comparatively high motorcycle use49, were located together on the network graph’s right-hand side. Taken together, these city types accounted for a mean 204 DALYs lost per 100,000 population for motorcycle injury; 1.74 times greater than remaining city types. Sparse, Irregular, and Informal city types appearing in the lower right area of the graph had a combined average of 4465 DALYs lost to pedestrian and cyclist injuries per 100,000 population, which was 1.73 times greater than remaining city types. The risk ratios between various city types by road users relative to the High Transit city type (city type with the overall lowest burden of road transport injury) are shown in Table 2.
Table 2.
Risk ratios of road user transport injuries and the total road transport injury by city type with 95% confidence intervals.
| City Type | Driver and Passenger Injuries | Motorcycle Injuries | Bicyclist and Pedestrian Injuries | Total Road Transport Injuries |
|---|---|---|---|---|
| High Transit* | 1.00 | 1.00 | 1.00 | 1.00 |
| Intense | 0.70 (0.50–1.00) | 2.31 (1.95–3.40) | 1.46 (1.19–2.07) | 1.24 (1.05–1.63) |
| Motor City | 2.04 (1.73–2.35) | 1.40 (1.03–2.25) | 0.98 (0.71–1.50) | 1.52 (1.32–1.95) |
| Large Block | 2.08 (1.93–2.24) | 1.53 (1.34–2.18) | 1.85 (1.71–2.37) | 1.89 (1.79–2.25) |
| Sparse | 1.00 (0.84–1.17) | 2.33 (2.16–3.22) | 2.85 (2.70–3.57) | 1.90 (1.79–2.27) |
| Irregular | 1.17 (1.06–1.27) | 2.14 (2.01–2.88) | 2.73 (2.64–3.38) | 1.90 (1.83–2.23) |
| Cul de Sac | 1.43 (1.09–1.76) | 3.81 (3.40–5.37) | 1.77 (1.46–2.47) | 1.94 (1.72–2.44) |
| Chequerboard | 1.96 (1.83–2.08) | 2.19 (2.05–2.99) | 1.83 (1.72–2.32) | 1.94 (1.86–2.29) |
| Informal | 1.75 (1.65–1.86) | 2.65 (2.52–3.53) | 2.10 (2.00–2.62) | 2.00 (1.93–2.35) |
Risk ratios relative to High Transit city type
Table 3 uses the road transport injury risk ratios associated with the city types from Table 2 to estimate the total burden of road transport injury associated with specific city types, along with the estimated share of the total road transport injury burden attributable to city types that do not match the lowest risk, High Transit, design. Based on 2015 world population estimates, the greatest total burden of road transport injury is associated with the Irregular and Informal city types, followed by Sparse and Motor cities. The estimated global burden of road transport injury attributable to urban form that does not match the lowest risk example from High Transit city types is estimated at close to 9.6 million DALYs per year.
Table 3.
Estimated burden of road transport injury lost to road transport injury attributed to city types with 95% confidence intervals.
| City Type | Total DALYs lost to road transport injury per annum | Share of total DALYs lost to road transport injury attributed to city type per annum |
|---|---|---|
| High Transit | 1,368,007 (1,207,972 – 1,528,042) | - |
| Intense | 592,296 (499,964 – 684,628) | 476,033 (420,345 – 476,033) |
| Motor City | 1,689,967 (1,468,564 – 1,911,370) | 1,109,625 (979,817 – 1,109,625) |
| Large Block | 1,589,335 (1589335 – 1,505,545) | 836,471 (750,961 – 821,465) |
| Sparse | 2,803,727 (2,803,727 – 2,686,847) | 1,447,125 (1,277,835 – 1,447,125) |
| Irregular | 4,597,289 (4,438,875 – 4,755,703) | 2,294,240 (2,025,850 – 2,294,240) |
| Cul de Sac | 431,993 (383,213 – 480,773) | 228,498 (213,305 – 213,977) |
| Chequerboard | 1,797,200 (1,797,200 – 1,696,397) | 946,104 (835,425 – 946,104) |
| Informal | 4,325,466 (4,325,466 – 4,172,277) | 2,232,798 (1,834,294 – 2,427,875) |
| Total | 19,195,280 (18,059,654 – 18,059,654) | 9,570,894 (8,337,832 – 9,736,445) |
Discussion
This analysis has identified nine global city types through visual classification techniques that capture the diversity of urban design related to land transport. It has demonstrated the benefit of accessing and harnessing combined, global, standardised datasets for urban analysis alongside global health burden data. We have identified differences between city types that appear strongly associated with the magnitude and nature of road transport injury between transport modes. The study identifies city types whose transport networks differ across multiple dimensions; from cities with intense, extensive, highly organised road and rail networks (e.g., High Transit and Intense city types), to cities with limited, irregularly shaped road infrastructure and almost no railed public transport networks (e.g., the Sparse and Informal city type). The global geographic distribution of city types provides insight into the role ethnographic drift and motorisation has played in city design. For example, cities in North America and Australasia whose suburbs evolved post-motorisation are characterised by highly organised, medium to low density, rectangular, grid-based road networks (e.g., Motor City type). In contrast, cities influenced by historic planning regimes throughout the Mediterranean, Latin America and the ‘new world’50 or ancient cities in Asia and Europe were discernible by regular, but considerably more dense (e.g., Chequerboard city types) and/or irregularly shaped, road networks (e.g., Irregular and Cul de Sac city types).
The findings highlight that urban design is strongly associated with the burden of road transport injury. Controlling for the influence of economic activity, a 2-fold difference was observed in the total estimated burden of road transport injury between the best performing city type (High Transit) and the poorest performing types (Cul-de Sac, Chequerboard, and Informal, followed by Irregular, Sparse and Large Block types). Together, these poorly performing city types contain over 1.6 billion people located in areas across western China, India and Asia, South America, the Former Soviet Union, and Africa. Many of the cities that fall within the specific city types are in low-income regions and are transitioning through a period of rapid development. Significantly, they are often located within countries targeted by multilateral development bank infrastructure programs promoting road safety initiatives that do not emphasise reducing motor vehicle use through changes to urban design or land use planning23. Furthermore, seldom do these projects advocate investment in safer public or active transport alternatives beyond the motor car51. The limitation of tackling transport injury through a restricted lens of ‘road safety’ that places the car at the centre of transport policy while discounting investment in safer alternative transport options are emphasised by the results presented here. Efforts to promote urban design that features characteristics inherent in High Transit and Intense city types (e.g., higher density road infrastructure and high rates of public transit) must also be advocated by global institutions responsible for promoting transport safety and supporting the development of high performing52 transport and health systems.
Pedestrian and bicyclist transport-related injury were demonstrably higher for Sparse, Irregular and Informal city types, with the risk of such injuries being two to three times greater compared to High Transit cities. Patterns over the last century have shown that when cities are in earlier stages of development and motorisation, vulnerable road users such as pedestrians and cyclists are overrepresented in injurious crashes53. The rates of these injuries typically continue to increase as motorisation takes greater hold before declining again once active transport is usurped for motor vehicles54. This is well illustrated in China where road infrastructure once allocated for cycling has been increasingly engineered to provide greater egress for motor vehicles55. The health co-benefits associated with walking and cycling, as integral transport modes, is unequivocal56,57 with many cities represented by the High Transit city type such as Paris, Copenhagen and Helsinki having built (and continuing to develop) safe public and active transport infrastructure58,59. Given the considerable health and environmental co-benefits associated with active transport8,56 urgent attention by low-income and rapidly motorising cities is needed to ensure these transport modes receive greater emphasis in transport, planning, and health policies.
While the total DALYs lost to road transport injury in Motor Cities (a city type that reflects extensive lower density, high capacity road networks that encourage urban sprawl and the need for households to operate multiple motor vehicles60) was comparatively low, it is notable that: 1) DALYs lost among motor vehicle drivers and passengers were among the highest, and 2) they demonstrated among the highest potential for improvement based on total captured population (see Table 3). Driver and passenger risk in Motor Cities was more than twice that of High Transit cities, reflecting the car-dominated nature of regions typical of this city type (e.g., North America, Australasia, UAE). Due to an orientation toward motor vehicles, rates of active transport in regions dominated by Motor Cities is also low61, which is reflected in the reduced observed burden of road transport injury among pedestrians and cyclists.
Although this study points to the association between urban design and the burden of road transport injury, it also highlights that some cities are relative outliers in relation to their reduced burden of road transport injury given their dominant city type. For example, Australian cities fall within the Motor City type and yet Australia has observed considerable success in reducing road transport injury over the past 40 years. However, much of the success is attributed to considerable investment in public education, behaviour-change, and enforcement activities62 whose impact now appears to be waning as reductions in aggregate and per-capita injuries plateau, or are even beginning to increase again22,63,64. The findings from this study suggest more upstream investment in urban design that supports transport mode shift away from motor vehicle and into lower risk modes such as rail1,4,7 or safe active transport65 can deliver reductions in transport injury.
This study outlines a novel and efficient method for understanding the association between urban design and road injury at a global scale. We have used a unique combination of techniques drawn from artificial intelligence, graph theory, complexity science, and geospatial information to understand differences in global cities’ design that may explain variation in the extent and nature of road-transport injury burden. We have demonstrated the ability of these techniques to define, describe, and understand the influence of city designs that cross geo-political boundaries and follow previously documented ethnographic and historical approaches to city design50,66. The methods applied in this study can be used by other researchers to explore other urban-related domains including air pollution, physical inactivity, overweight and obesity, and associated non-communicable disease and public health issues linked to urban form7.
There are acknowledged limitations to the results. First, the contribution of individual cities to city-type road trauma rates and total DALYs lost is drawn from country-level, rather than city-level rates. Though unavoidable due to the current unavailability of detailed disease data across global cities, this limitation removes within-country variation in road injury per capita risk between cities. In general, however, within-country variation of city types was low, with just 35 of 176 countries demonstrating more than two city types and over 50% containing just one.
Secondly, although we observe clear differences in injury rates across road users across city types, our analysis does not consider potential differential crash rates between urban and rural areas, which may pose dissimilar injury risk. High speed, low quality, and low density roads place drivers, passengers and vulnerable road users at higher risk due to increased kinetic energy at the point of collision. By contrast, dense, low speed networks containing more intersections may produce more crashes, however the kinetic energy transferred at the point of collision is lower, reducing the risk of injury or death should a crash occur67. Such differences between crash risks are observed in road trauma statistics from rural areas where low density roads and high speeds predominate. For example, in the state of Victoria, Australia, rural roads account for just 19% of total reported crashes but over 63% of deaths68. An exception to this general trend is in transport systems dominated by motorcycles or other small, motorised vehicles designed to navigate dense road networks at high speed but low cost. Riders and passengers who use these vehicles are subject to high injury risk due to the lack of protection they afford69–72.
It is further acknowledged that these results may be influenced by unobserved or related factors such as historic patterns of social or urban development22, road safety management approaches73,74, or other conditions not captured by our observations but present within cities and countries represented within each of the nine city types. Although we have included a detailed control for economic activity (FFDAS), we suggest it is important to recognise two aspects; Firstly, that economic activity shapes city design and is hence captured by maps to some extent, and 2) that while advanced city economies may provide opportunity for more public transport, effective policing, formal planning, safer roads, safer vehicles, behavioural change campaigns, enforcement activities and road regulations, economies do not implement ‘safe systems’ policies by themselves – they remain governance choices and priorities of cities and countries. For example, elevated total road injury burden in high-income countries (e.g., the United States, Saudi Arabia, United Arab Emirates), and high motorcycle injury rates in countries dominated by Intense city types (e.g., Japan), show that comparatively high GDP is not a sufficient condition for preventing road transport injuries nor a solution to their occurrence. This appears lost in contemporary solutions to road transport injury such as ‘safe systems’75–77, which can ignore the issue that economic and technological development has been the primary driver of motorised transport systems and consequent road injury in the first place. Developing economies are not necessarily experiencing high rates of road transport injury because they have comparably low GDP, they are experiencing it because GDP is increasing alongside uptake of motor vehicles78.
We do not contend that urban design alone, accounts for the entirety of the burden of road transport injury nor can it be artificially divorced factor described above. However, this study highlights the importance of urban design with respect to road and rail networks in mitigating the burden associated with road transport injury. Clearly, if the urban design of a city sits within one of the poorly performing city types, or those where considerable gains can be made, then effort should focus on prioritising development strategies that actively support increased public transit and urban density; strategies that are not currently high priorities among global agencies promoting road safety23.
The future design of cities in which the world’s 7 billion city-dwellers will live, work and play will be crucial to increasing global productivity and reducing the incidence, prevalence and costs associated with non-communicable diseases and injury79. This study demonstrates an entirely new, replicable, scalable, and highly efficient method for understanding the characteristics of urban design with respect to health outcomes; in this instance the burden associated with road transport injury. The study highlights the opportunity for reducing the global burden of road transport injury by embracing urban designs that emphasise characteristics captured within High Transit city types.
Supplementary Material
Research in context.
This research builds upon a long history of studies conducted to better understand the interaction between cities and health. The authors considered a wide range of interdisciplinary sources consistent with our backgrounds that were unrestricted to any given database or reference lists. The manuscript attempts to directly overcome challenges and limitations of observational dependence associated with previous work. The added value this research provides is the generation of a methodology to identify empirically derived global city types and then link these to potential health outcomes associated with urban design. The method produces a degree of fidelity not previously possible at a global scale. The work provides researchers with a platform upon which to extend our findings to other health domains, improve interpretation and understanding of city types, and refine the methodology, itself. In particular, it provides a basis upon which health data collected at a more granular geographic (e.g., city) level can be linked to city design.
Acknowledgements
JT is supported by an Australian Research Council Discovery Early Career Research Award [grant number DE180101411]. MS is supported by a National Health and Medical Research Council (Australia) Fellowship [grant number APP1136250]. CNM receives support from the US National Institute of Alcohol Abuse and Alcoholism (K01AA026327).
References
- 1.Stevenson M, Thompson J, de Sa TH, et al. Land use, transport, and population health: estimating the health benefits of compact cities. Lancet 2016; 388(10062): 2925–35. [DOI] [PMC free article] [PubMed] [Google Scholar]
- 2.Sallis JF, Bull F, Burdett R, et al. Use of science to guide city planning policy and practice: how to achieve healthy and sustainable future cities. The lancet 2016; 388(10062): 2936–47. [DOI] [PubMed] [Google Scholar]
- 3.Gorz A The social ideology of the motorcar. Sitio Reclaim the streets Internet 1973. [Google Scholar]
- 4.Department for Transport. Transport Statistics Great Britain 2017. London, United Kingdom, 2017. [Google Scholar]
- 5.Conlon R, Perkins J. Wheels and deals: The automotive industry in twentieth-century Australia: Routledge; 2018. [Google Scholar]
- 6.Timmer MP, Dietzenbacher E, Los B, Stehrer R, Vries GJ. An Illustrated User Guide to the World Input–Output Database: the Case of Global Automotive Production. Review of International Economics 2015; 23(3): 575–605. [Google Scholar]
- 7.Frumkin H Urban sprawl and public health. Public health reports 2016. [DOI] [PMC free article] [PubMed] [Google Scholar]
- 8.Woodcock J, Edwards P, Tonne C, et al. Public health benefits of strategies to reduce greenhouse-gas emissions: urban land transport. The Lancet 2009; 374(9705): 1930–43. [DOI] [PubMed] [Google Scholar]
- 9.Shahraz S, Bartels D, Puthenpurakal JA, Motlagh ME. Adverse health outcomes of road traffic injuries in Iran after rapid motorization. Arch Iran Med 2009; 12(3): 284–94. [PubMed] [Google Scholar]
- 10.Naghavi M, Abajobir AA, Abbafati C, et al. Global, regional, and national age-sex specific mortality for 264 causes of death, 1980–2016: a systematic analysis for the Global Burden of Disease Study 2016. The Lancet 2017; 390(10100): 1151–210. [DOI] [PMC free article] [PubMed] [Google Scholar]
- 11.World Health Organization. Global status report on road safety 2018: World Health Organization; 2018. [Google Scholar]
- 12.World Health Organization. WHO Air Pollution. 2018. https://www.who.int/airpollution/en/ (accessed 24/11/18 2018).
- 13.Karagulian F, Belis CA, Dora CFC, et al. Contributions to cities’ ambient particulate matter (PM): A systematic review of local source contributions at global level. Atmospheric environment 2015; 120: 475–83. [Google Scholar]
- 14.Greenstone M, Fan CQ. Introducing the Air Quality Life Index. 2018. [Google Scholar]
- 15.Laurance WF, Clements GR, Sloan S, et al. A global strategy for road building. Nature 2014; 513(7517): 229. [DOI] [PubMed] [Google Scholar]
- 16.Laurance WF, Balmford A. Land use: a global map for road building. Nature 2013; 495(7441): 308. [DOI] [PubMed] [Google Scholar]
- 17.Risbey T, Cregan M, De Silva H. Social cost of road crashes. Proc of 33rd Australasian Transport Research Forum; 2010; 2010. p. 1–16. [Google Scholar]
- 18.World Health Organization. Post-crash response: supporting those affected by road traffic crashes. 2016. [Google Scholar]
- 19.Bureau of Infrastructure TaRE. Road Construction Cost and Infrastructure Procurement Benchmarking: 2017 update. Canberra, Australia: Department of Infrastructure, Regional Development and Cities; 2017. [Google Scholar]
- 20.Shoup D The High Cost of Free Parking: Updated Edition: Routledge; 2017. [Google Scholar]
- 21.DeAngelo G, Hansen B. Life and death in the fast lane: Police enforcement and traffic fatalities. American Economic Journal: Economic Policy 2014; 6(2): 231–57. [Google Scholar]
- 22.Salmon PM, McClure R, Stanton NA. Road transport in drift? Applying contemporary systems thinking to road safety. Safety science 2012; 50(9): 1829–38. [Google Scholar]
- 23.Davies GR, Roberts I. Is road safety being driven in the wrong direction? International journal of epidemiology 2014; 43(5): 1615–23. [DOI] [PubMed] [Google Scholar]
- 24.Ewing R, Cervero R. Travel and the Built Environment. Journal of the American Planning Association 2010; 76(3): 265–94. [Google Scholar]
- 25.Hoek G, Beelen R, De Hoogh K, et al. A review of land-use regression models to assess spatial variation of outdoor air pollution. Atmospheric environment 2008; 42(33): 7561–78. [Google Scholar]
- 26.Giles-Corti B, Vernez-Moudon A, Reis R, et al. City planning and population health: a global challenge. Lancet 2016; 388(10062): 2912–24. [DOI] [PubMed] [Google Scholar]
- 27.Pongsiri MJ, Gatzweiler FW, Bassi AM, Haines A, Demassieux F. The need for a systems approach to planetary health. The Lancet Planetary Health 2017; 1(7): e257–e9. [DOI] [PubMed] [Google Scholar]
- 28.Rutter H, Savona N, Glonti K, et al. The need for a complex systems model of evidence for public health. The Lancet 2017; 390(10112): 2602–4. [DOI] [PubMed] [Google Scholar]
- 29.Horton R, Lo S. Planetary health: a new science for exceptional action. The Lancet 2015; 386(10007): 1921–2. [DOI] [PubMed] [Google Scholar]
- 30.Roux AVD. Health in cities: is a systems approach needed? Cadernos de saude publica 2015; 31: 9–13. [DOI] [PubMed] [Google Scholar]
- 31.World Health Organization. Global status report on road safety 2015: World Health Organization; 2015. [Google Scholar]
- 32.United Nations. World Population Prospects: The 2017 Revision, Key Findings and Advance Tables, 2017. [Google Scholar]
- 33.United Nations. World urbanization prospects. 2014 revision, Highlights. New York: United Nations, 2014. [Google Scholar]
- 34.Barthelemy M The structure and dynamics of cities: Cambridge University Press; 2016. [Google Scholar]
- 35.Weiss L, Ompad D, Galea S, Vlahov D. Defining Neighborhood Boundaries for Urban Health Research. American Journal of Preventive Medicine 2007; 32(6, Supplement): S154–S9. [DOI] [PMC free article] [PubMed] [Google Scholar]
- 36.Sinnott RW. Virtues of the Haversine. Sky Telescope 1984; 68(2): 159-. [Google Scholar]
- 37.Google. n.d.
- 38.Badalge K, Fairchild C. One thing North Korea has that the South doesn’t: Google Maps. The National Interest; 2018. [Google Scholar]
- 39.Google Maps. Google Static Maps API. 2017. [Google Scholar]
- 40.Szegedy C, Vanhoucke V, Ioffe S, Shlens J, Wojna Z. Rethinking the inception architecture for computer vision. Proceedings of the IEEE conference on computer vision and pattern recognition; 2016; 2016. p. 2818–26. [Google Scholar]
- 41.Kohavi R, Provost F. Confusion matrix. Machine learning 1998; 30(2–3): 271–4. [Google Scholar]
- 42.Jacomy M, Venturini T, Heymann S, Bastian M. ForceAtlas2, a continuous graph layout algorithm for handy network visualization designed for the Gephi software. PloS one 2014; 9(6): e98679. [DOI] [PMC free article] [PubMed] [Google Scholar]
- 43.Blondel VD, Guillaume J-L, Lambiotte R, Lefebvre E. Fast unfolding of communities in large networks. Journal of statistical mechanics: theory and experiment 2008; 2008(10): P10008. [Google Scholar]
- 44.Newman ME, Girvan M. Finding and evaluating community structure in networks. Physical review E 2004; 69(2): 026113. [DOI] [PubMed] [Google Scholar]
- 45.Lambiotte R, Delvenne J-C, Barahona M. Laplacian dynamics and multiscale modular structure in networks. arXiv preprint arXiv:08121770 2008. [Google Scholar]
- 46.Abajobir AA, Abate KH, Abbafati C, et al. Global, regional, and national disability-adjusted life-years (DALYs) for 333 diseases and injuries and healthy life expectancy (HALE) for 195 countries and territories, 1990–2016: a systematic analysis for the Global Burden of Disease Study 2016. The Lancet 2017; 390(10100): 1260–344. [DOI] [PMC free article] [PubMed] [Google Scholar]
- 47.Murray CJL, Vos T, Lozano R, et al. Disability-adjusted life years (DALYs) for 291 diseases and injuries in 21 regions, 1990–2010: a systematic analysis for the Global Burden of Disease Study 2010. The Lancet 2012; 380(9859): 2197–223. [DOI] [PubMed] [Google Scholar]
- 48.Rayner PJ, Raupach MR, Paget M, Peylin P, Koffi E. A new global gridded data set of CO2 emissions from fossil fuel combustion: methodology and evaluation. 2010; 115(Journal of Geophysical Research: Atmospheres). [Google Scholar]
- 49.UN Habitat. The state of urban passenger transport Planning and Design for Sustainable Urban Mobility: UN Habitat; 2013. [Google Scholar]
- 50.Crouch DP, Mundigo AI. The City Planning Ordinances of the Laws of the Indies Revisited: Part II: Three American Cities. Town Planning Review 1977; 48(4): 397. [Google Scholar]
- 51.The World Bank. Global Road Safety Facility (GRSF) strategic plan 2013–2020 Washington, DC: World Bank Group, 2014. [Google Scholar]
- 52.Murray CJ, Frenk J. A framework for assessing the performance of health systems. Bull World Health Organ 2000; 78(6): 717–31. [PMC free article] [PubMed] [Google Scholar]
- 53.Jiang B, Liang S, Peng Z-R, et al. Transport and public health in China: the road to a healthy future. The Lancet 2017; 390(10104): 1781–91. [DOI] [PMC free article] [PubMed] [Google Scholar]
- 54.Bhalla K, Ezzati M, Mahal A, Salomon J, Reich M. A Risk-Based Method for Modeling Traffic Fatalities. Risk Analysis 2007; 27(1): 125–36. [DOI] [PubMed] [Google Scholar]
- 55.Wang S, Li Y, Chi G, et al. Injury-related fatalities in China: an under-recognised public-health problem. The Lancet 2008; 372(9651): 1765–73. [DOI] [PubMed] [Google Scholar]
- 56.Woodcock J, Franco OH, Orsini N, Roberts I. Non-vigorous physical activity and all-cause mortality: systematic review and meta-analysis of cohort studies. International journal of epidemiology 2011; 40(1): 121–38. [DOI] [PubMed] [Google Scholar]
- 57.Mueller N, Rojas-Rueda D, Cole-Hunter T, et al. Health impact assessment of active transportation: a systematic review. Preventive medicine 2015; 76: 103–14. [DOI] [PubMed] [Google Scholar]
- 58.Helsinki City Planning Department General Planning Unit. The New Helsinki City Plan Vision 2050. City of Helsinki; 2013. [Google Scholar]
- 59.Mueller N, Rojas-Rueda D, Salmon M, et al. Health impact assessment of cycling network expansions in European cities. Preventive medicine 2018; 109: 62–70. [DOI] [PubMed] [Google Scholar]
- 60.Currie G, Senbergs Z. Exploring forced car ownership in metropolitan Melbourne. 30th Australasian Transport Research Forum; 2007; 2007. [Google Scholar]
- 61.Pucher J, Buehler R, Bassett DR, Dannenberg AL. Walking and cycling to health: a comparative analysis of city, state, and international data. American Journal of Public Health 2010; 100(10): 1986–92. [DOI] [PMC free article] [PubMed] [Google Scholar]
- 62.Stevenson M, Thompson J. On the road to prevention: road injury and health promotion. Health Promot J Austr 2014; 25(1): 4–7. [DOI] [PubMed] [Google Scholar]
- 63.BITRE. Road Deaths Australia, 2017 Statistical Summary In: Transport DoIa, editor. Canberra: Commonwealth of Australia; 2018. [Google Scholar]
- 64.National Highway Traffic Safety Administration. Early estimate of motor vehicle traffic fatalities in 2018. Washington, USA, 2019. [Google Scholar]
- 65.Thompson J, Wijnands JS, Savino G, Lawrence B, Stevenson M. Estimating the safety benefit of separated cycling infrastructure adjusted for behavioral adaptation among drivers; an application of agent-based modelling. Transportation Research Part F-Traffic Psychology and Behaviour 2017; 49: 18–28. [Google Scholar]
- 66.Mundigo AI, Crouch DP. The city planning ordinances of the laws of the indies revisited: Part I: Their philosophy and implications. Town Planning Review 1977; 48(3): 247. [Google Scholar]
- 67.Aarts L, van Schagen I. Driving speed and the risk of road crashes: A review. Accident Analysis & Prevention 2006; 38(2): 215–24. [DOI] [PubMed] [Google Scholar]
- 68.State Government of Victoria. VicRoads Open Data In: VicRoads, editor. October, 2018 ed. Melbourne, Australia: State Government of Victoria; 2018. [Google Scholar]
- 69.Lin MR, Kraus JF. A review of risk factors and patterns of motorcycle injuries. Accident; analysis and prevention 2009; 41(4): 710–22. [DOI] [PubMed] [Google Scholar]
- 70.Solagberu B, Ofoegbu C, Nasir A, Ogundipe O, Adekanye A, Abdur-Rahman L. Motorcycle injuries in a developing country and the vulnerability of riders, passengers, and pedestrians. Injury prevention 2006; 12(4): 266–8. [DOI] [PMC free article] [PubMed] [Google Scholar]
- 71.Hung DV, Stevenson MR, Ivers RQ. Prevalence of helmet use among motorcycle riders in Vietnam. Injury prevention 2006; 12(6): 409–13. [DOI] [PMC free article] [PubMed] [Google Scholar]
- 72.Hung DV, Stevenson MR, Ivers RQ. Barriers to, and factors associated, with observed motorcycle helmet use in Vietnam. Accident Analysis & Prevention 2008; 40(4): 1627–33. [DOI] [PubMed] [Google Scholar]
- 73.World Health Organisation. Global status report on road safety. Luxembourg: WHO Press; 2015. [Google Scholar]
- 74.Organisation WH. Pedestrian safety: A road safety manual for decision-makers and practitioners In: FIA Foundation TWB, Global Road Safety Partnership,, editor. Italy; 2013. [Google Scholar]
- 75.Centre TR. Towards Zero. Ambitious road safety targets and the safe system approach. France: OECD, International transport Research Forum, 2008. [Google Scholar]
- 76.Muir C, Johnston IR, Howard E. Evolution of a holistic systems approach to planning and managing road safety: the Victorian case study, 1970–2015. Injury prevention 2018; 24(Suppl 1): i19–i24. [DOI] [PubMed] [Google Scholar]
- 77.Belin M-Å, Tillgren P, Vedung E. Vision Zero – a road safety policy innovation. International Journal of Injury Control and Safety Promotion 2012; 19(2): 171–9. [DOI] [PubMed] [Google Scholar]
- 78.Wu T, Zhao H, Ou X. Vehicle Ownership Analysis Based on GDP per Capita in China: 1963–2050. Sustainability 2014; 6(8): 4877–99. [Google Scholar]
- 79.Bai X, Nath I, Capon A, Hasan N, Jaron D. Health and wellbeing in the changing urban environment: complex challenges, scientific responses, and the way forward. Current Opinion in Environmental Sustainability 2012; 4(4): 465–72. [Google Scholar]
Associated Data
This section collects any data citations, data availability statements, or supplementary materials included in this article.