Abstract
Nervous systems combine lower-level sensory signals to detect higher order stimulus features critical to survival1–3, such as the visual looming motion created by an imminent collision or approaching predator4. Looming-sensitive neurons have been identified in diverse animal species5–9. Different large-scale visual features such as looming often share local cues, which means loom-detecting neurons face the challenge of rejecting confounding stimuli. Here we report the discovery of an ultra-selective looming detecting neuron, LPLC210 in Drosophila, and show how its selectivity is established by radial motion opponency. In the fly visual system, directionally-selective small-field neurons called T4 and T5 form a spatial map in the lobula plate, where they each terminate in one of four retinotopic layers, such that each layer responds to motion in a different cardinal direction11–13. Single cell anatomical analysis reveals that each arm of LPLC2’s cross-shaped primary dendrites ramifies in one of these layers and extends along that layer’s preferred motion direction. In vivo calcium imaging demonstrates that, as their shape predicts, individual LPLC2 neurons respond strongly to outward motion emanating from the center of the neuron’s receptive field. Each dendritic arm also receives local inhibitory inputs directionally selective for inward motion opposing the excitation. This radial motion opponency generates a balance of excitation and inhibition that makes LPLC2 non-responsive to related patterns of motion such as contraction, wide-field translation, or luminance change. As a population, LPLC2 neurons densely cover visual space and terminate onto the giant fiber descending neurons, which drive the jump muscle motoneuron to trigger an escape takeoff. Our findings provide a mechanistic description of the selective feature detection that flies use to discern and escape looming threats.
An approaching predator subtends an increasing visual angle on the eye, generating a complex sequence of visual features dominated by radial outward motion. In the fly visual system, directionally selective neurons encode the motion of bright (T4) and dark edges (T5)11–13. T4 and T5 are each comprised of four subtypes that are directionally selective in one of four cardinal directions11–13, and correspondingly project axon terminals to one of four distinct layers in the lobula plate (Extended Data Fig.1a). We here show that LPLC2 (lobula plate/lobula columnar, type II) cells, a class of visual projection neurons10, have the precise dendritic configuration – an outward pattern in each lobula plate layer – expected to encode local outward motion.
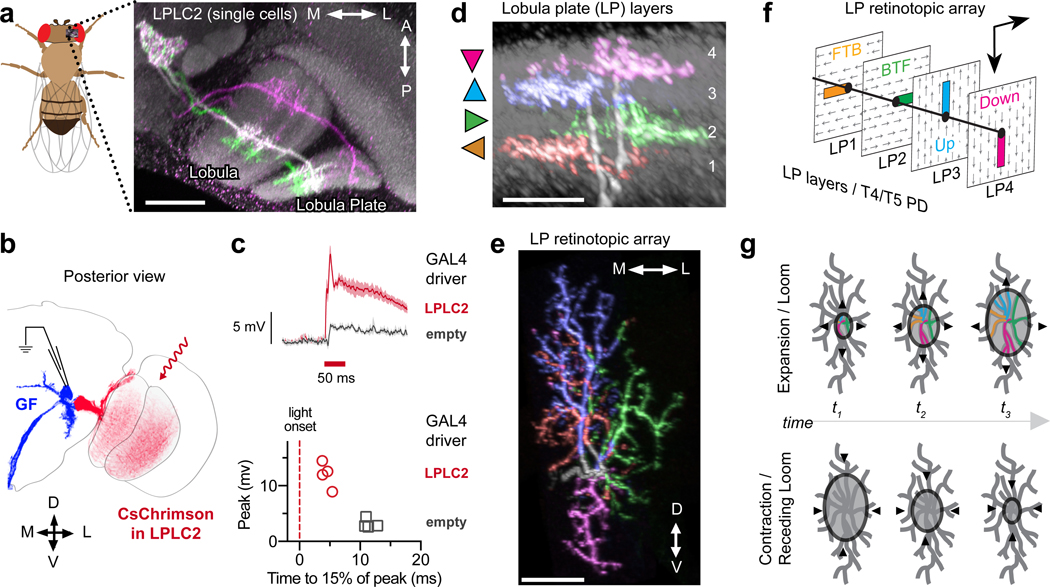
LPLC2 cells are a population of ~80 visual projection neurons10 whose dendrites cover the lobula plate (Fig. 1a and Extended Data Fig. 1b) and whose axons terminate near the lateral dendrite of the giant fiber (Fig. 1b), a large, loom-responsive descending interneuron that mediates an escape response14. To establish the connectivity of these two cell types, we expressed an optogenetic activator15 in LPLC2 neurons and conducted whole-cell recordings from the giant fiber. Upon illumination, we observed a large and rapid depolarization of the giant fiber (Fig. 1c), consistent with LPLC2s providing direct excitatory input to the giant fiber.
Figure 1: LPLC2 anatomy and connectivity.
a, Stochastically-labeled LPLC2 neurons on reference neuropil (grey). See Methods and Supplementary Table 2. Scale bar, 30 μm. b-c, Giant fiber (GF) responses to optogenetic depolarization of LPLC2, recorded with whole-cell patch-clamp. c, GF membrane potential time course (top: mean and 95% confidence interval, CI) and peak values (bottom: individual neurons). N = 4 flies for each group. d-e, Lobula plate layer pattern (d) and within-layer dendritic arbor spread (e) for a single LPLC2 neuron. Triangles in (d) indicate the preferred direction of T4/T5 neurons in that layer. Lateral (L) in the LP corresponds to frontal in the visual field, dorsal (D) to upwards. Scale bar, 10 μm. f, Schematic showing relative positions of LPLC2 dendrites (colored rectangles) in each LP layer, with each layer’s preferred direction indicated as arrows. FTB, front-to-back; BTF, back-to-front. g, Anatomy-based model of LPLC2 response to looming, where responses are driven by expansion but not contraction (color indicates excitation).
We next used multicolor stochastic labeling16 to investigate the morphology of individual LPLC2 neurons. Strikingly, we found that the dendritic arbors of each LPLC2 neuron form four distinct fields, each of which occupies a different lobula plate layer (Extended Data Fig. 1c). Furthermore, these arbors are positioned to form orthogonal axes with branches in opposing motion direction layers opposite one another (Fig. 1d, Extended Data Fig. 1d,e, Supplementary Video 1). The direction of maximum outward dendritic spread in each layer is aligned with the directional preference of the T4 and T5 cells terminating in that layer (Fig. 1e,f and Extended Data Fig. 1f). This dendritic anatomy is ideally suited for the detection of outward motion associated with a small looming object whose visual expansion is aligned with the center of an individual LPLC2 cell’s dendritic arbor (Fig 1g).
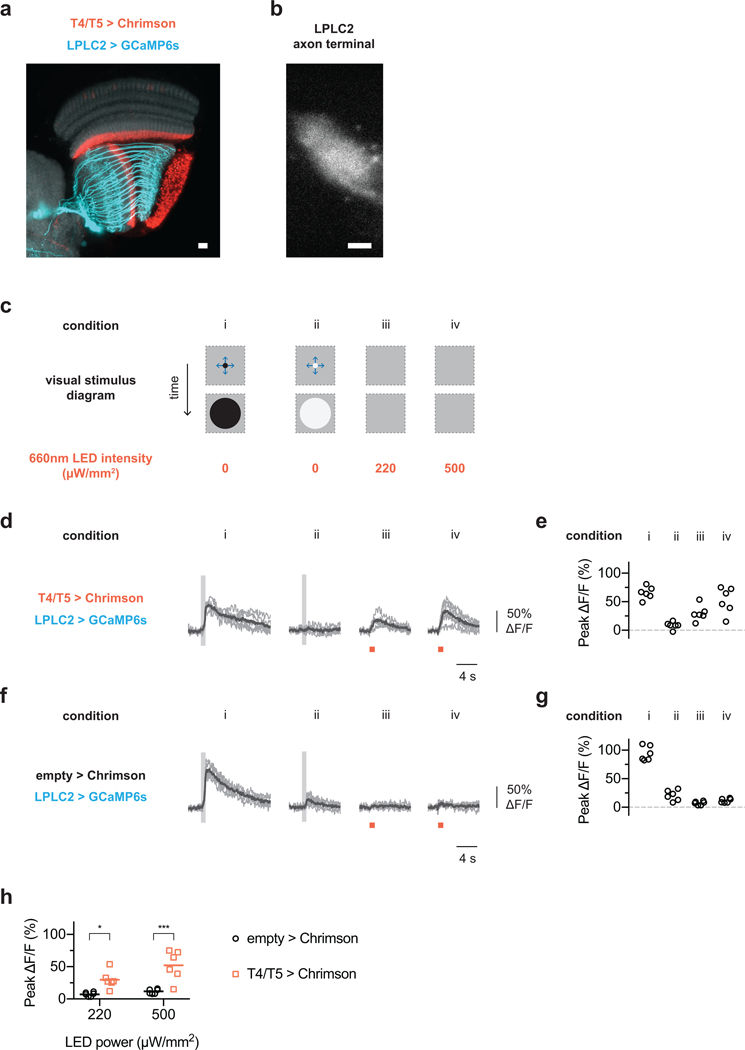
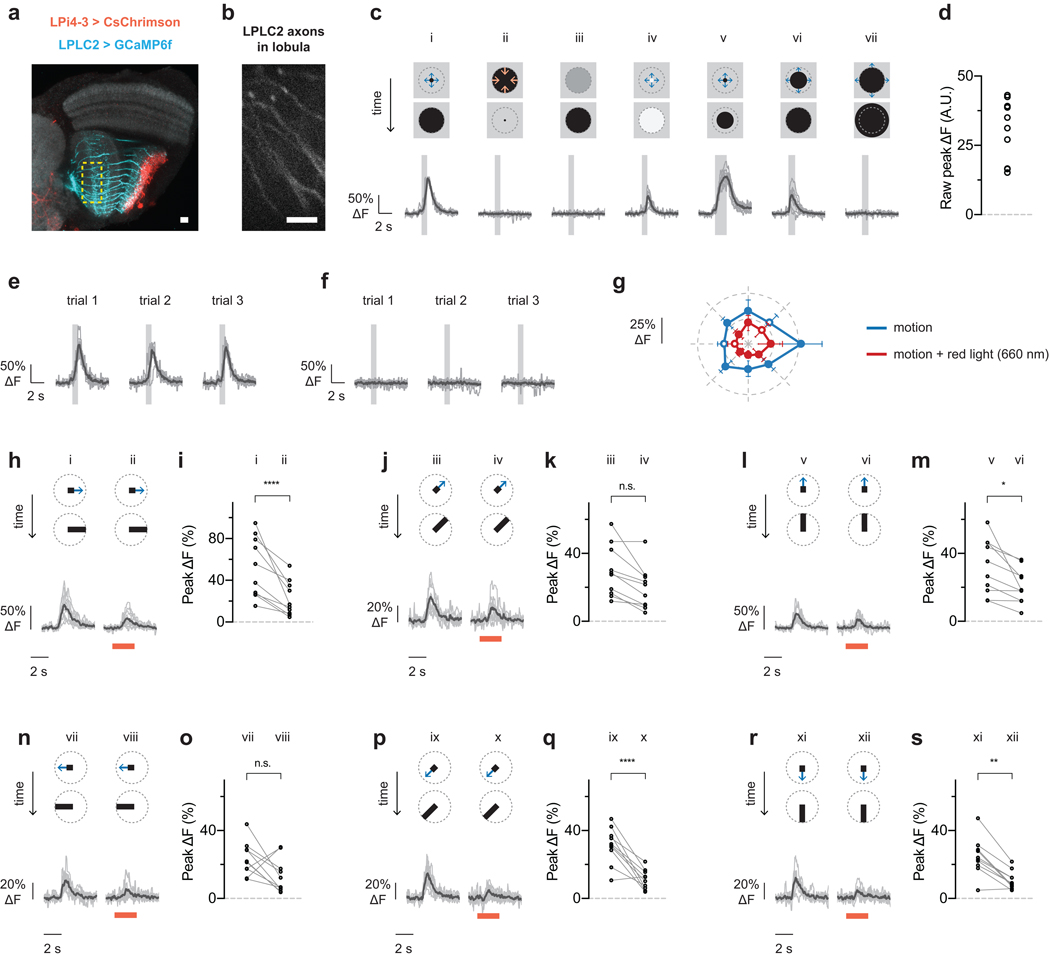
T4 and T5 cells are essential for looming behavioral responses17. To determine whether they provide direct excitatory inputs to LPLC2 neurons, we carried out in vivo two-photon calcium imaging18,19 of the LPLC2 population axon terminal bundle while driving an optogenetic activator in T4/T5 neurons (Extended Data Fig. 2a,b). Red illumination elicited an immediate calcium response in LPLC2 axons, whereas control flies exhibited no red light calcium response (Extended Data Fig. 2c–h), suggesting that T4/T5 are directly upstream of LPLC2.
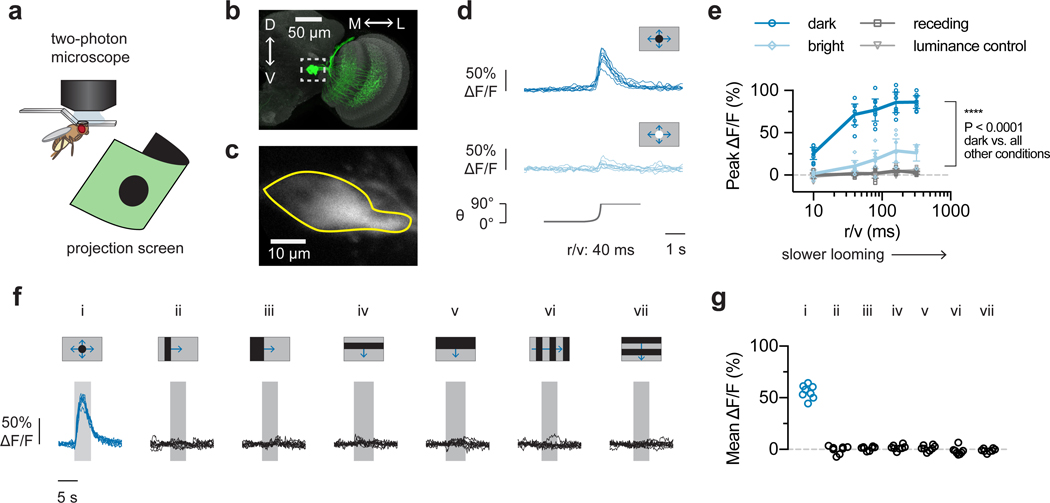
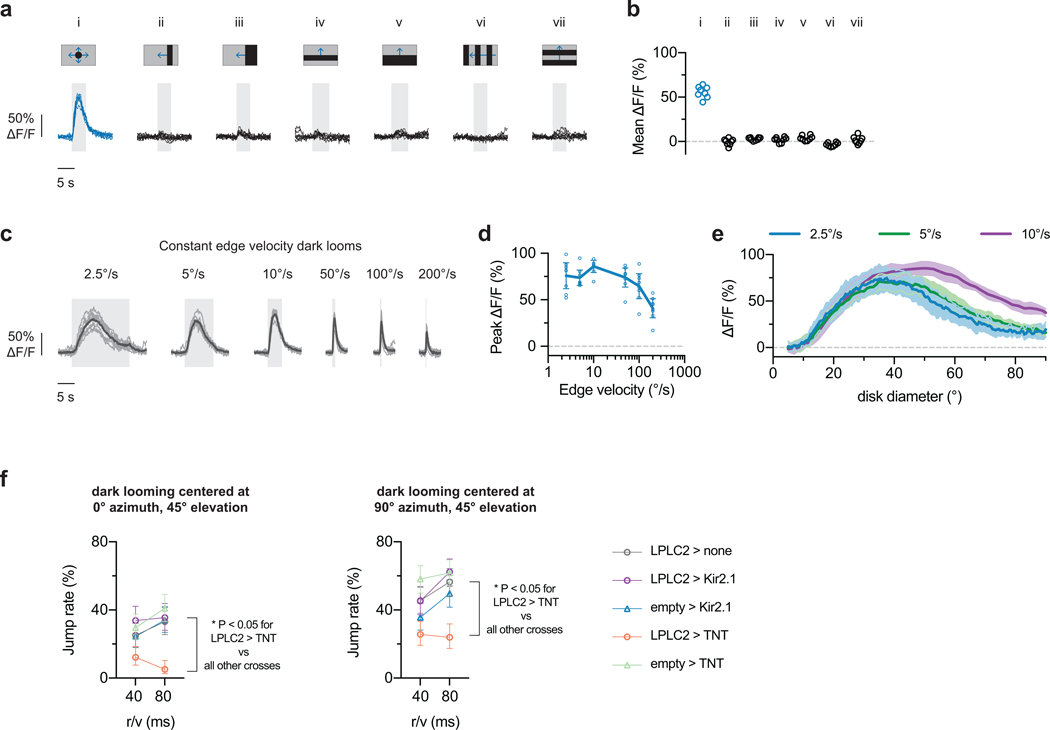
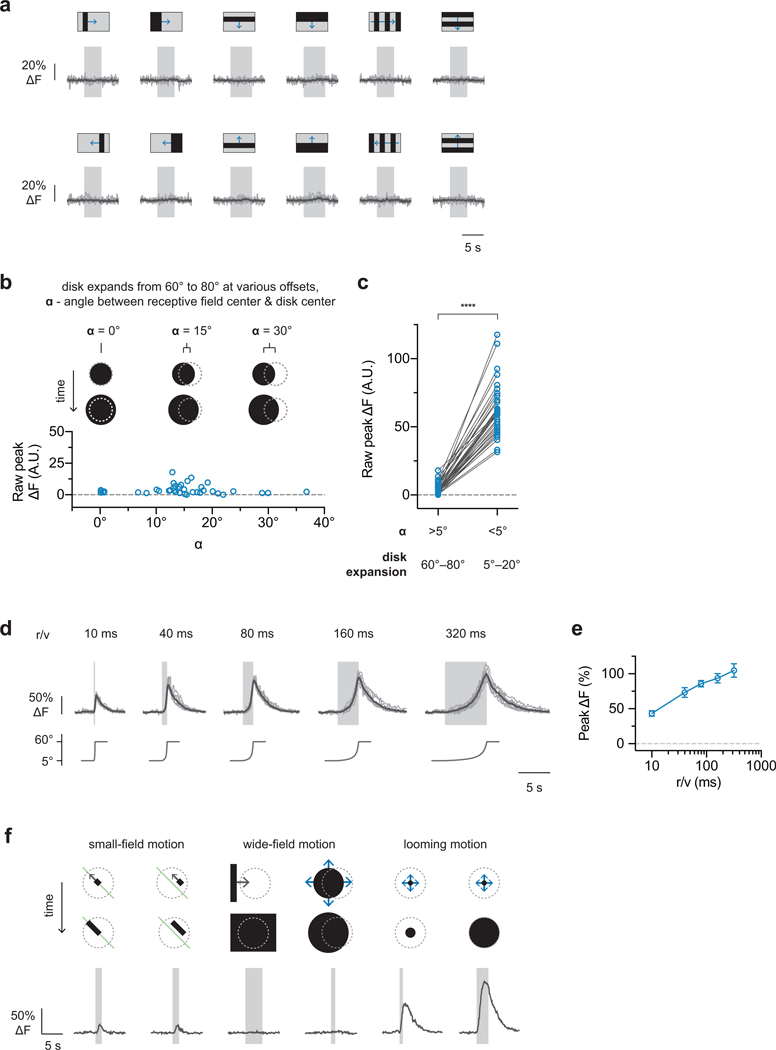
We next measured LPLC2 population responses to visual looming stimuli (Fig. 2a–c) that robustly drive giant fiber-mediated escape behavior14. LPLC2 was highly responsive to dark looming across all measured speeds and slightly responsive to bright looming (Fig. 2d,e). LPLC2 neurons did not respond to dark receding looming or to luminance-matched motion-free darkening stimulus, suggesting that coherent expanding edge motion is essential for the looming response (Fig. 2e). Surprisingly, LPLC2 did not respond to wide-field motion stimuli that drive the upstream T4/T5 neurons11,20 (Fig. 2f,g and Extended Data Fig. 3a,b), whereas looming induced detectable responses within the first 5° of expansion (Extended Data Fig. 3c–e). In comparison to either their upstream inputs11 or previously described looming sensitive neurons in insects5,7, the LPLC2 population are ultra-selective for looming motion and do not respond to stimuli lacking focal, outward movement. This selectivity for looming is consistent with a role in take-off escape behavior; optogenetic activation of LPLC2 neurons induces an immediate jumping response10, and blocking synaptic transmission of LPLC2 neurons decreases the looming jump escape response (Extended Data Fig. 3f).
Figure 2: LPLC2 population selectively encodes looming stimuli.
a, Imaging setup. b, LPLC2 neurons (green) on reference neuropil (grey); dashed box indicates axon terminal region. c, LPLC2 axon terminal calcium fluorescence; Region of interest (ROI) outlined in yellow. d-e, LPLC2 population looming responses. N = 8 flies. d, Individual fly calcium transients for dark (top) and bright (middle) looming (bottom, disk diameter). Calcium traces shown throughout paper are average of 3 trials. e, Peak responses to a range of looming speeds (mean ± 95% CI, overlay: individual flies). RM-ANOVA, Tukey’s post hoc test. f-g, Individual responses (N = 8 flies) to constant edge velocity looming (i, blue, 10°/s edge speed) and wide-field motion stimuli (ii-vii, black, 20°/s edge speed). Mean responses (g) measured during stimulus presentation (f, grey regions).
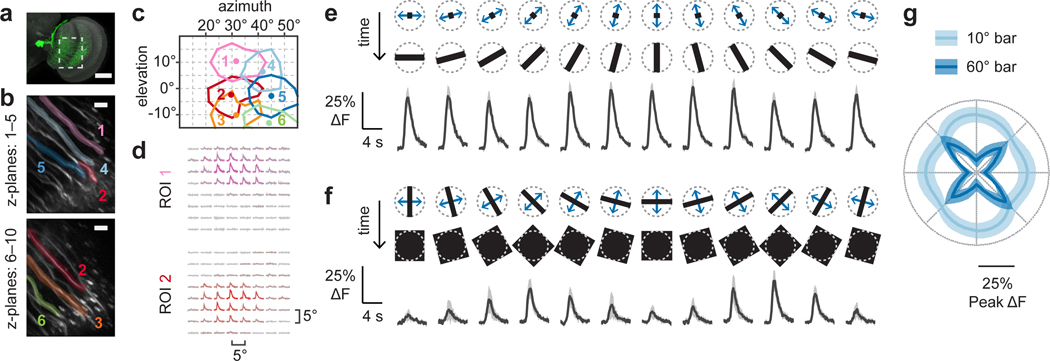
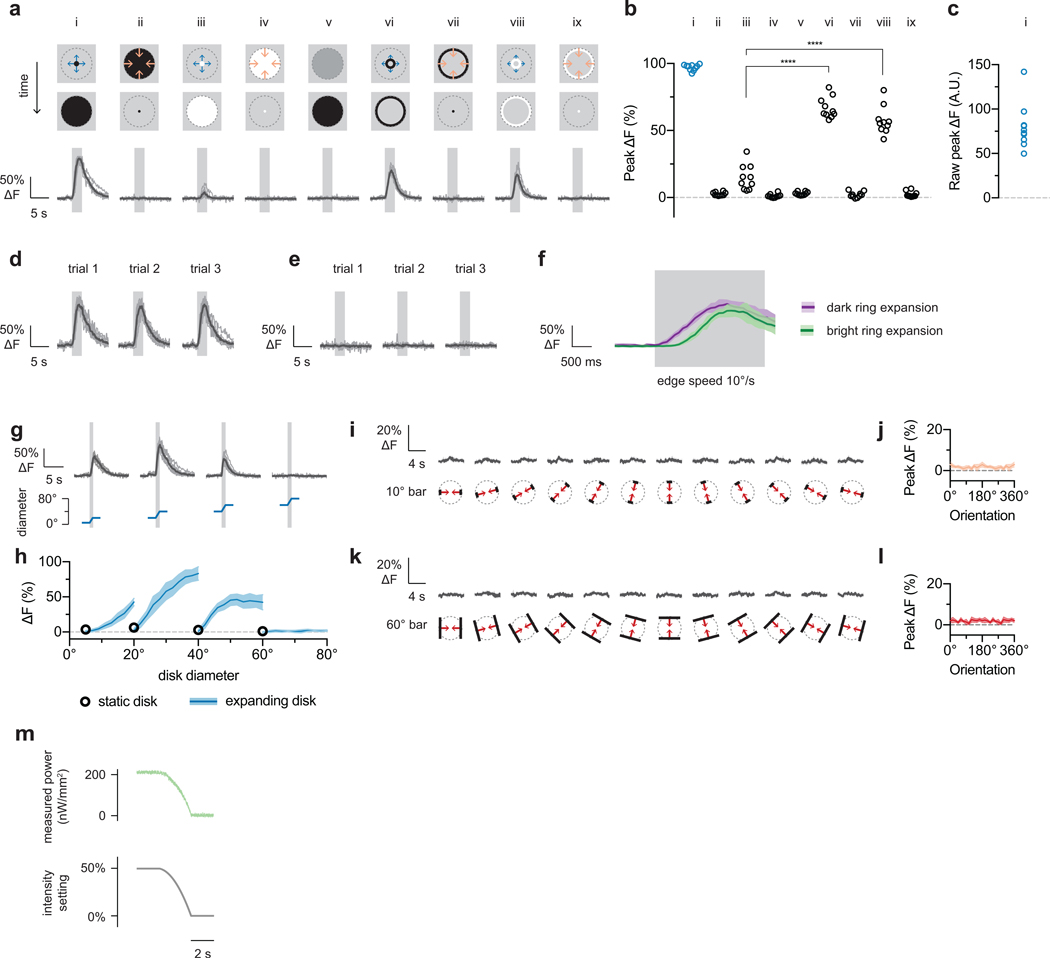
Our structure-function hypothesis predicts that individual LPLC2 neurons are local looming detectors. To resolve single neuron responses, we next examined the region between the lobula plate and lobula where individual LPLC2 axons can be isolated (Fig. 3a,b). We mapped the receptive fields of multiple neighboring neurons by measuring responses to local disk expansion stimuli from points densely selected in random order on a 5° grid (Fig. 3c,d). In all subsequent experiments, stimuli were shifted to the estimated receptive field center position of a single neuron. The receptive field structure of neighboring LPLC2 neurons shows that, as expected from the tiling pattern of the dendrites (Extended Data Fig. 1b,d), LPLC2 responses also tile visual space with overlap (Fig. 3c). We further explored single LPLC2 responses to a set of disk and ring stimuli (Extended Data Fig. 4a–h) and determined 60° as the upper bound for an individual LPLC2’s receptive field size. As expected from the population data, outward dark edge motion was most effective at eliciting calcium responses from single cells.
Figure 3: LPLC2 single-cell receptive field mapping and directional tuning.
a, LPLC2 (green) individual axon imaging region (dashed box). Scale bar, 50 μm. b-d, Single-cell receptive field (RF) mapping from a representative fly. b, Single-cell ROIs overlaid on averaged calcium images. Scale bar, 10 μm. c, RF contour plot: lines at 50% integrated ΔF, dots at fitted RF centers. Grid represents visual field as seen by fly. d, Normalized calcium traces arranged in grid corresponding to (c). e-g, Directional tuning with 10° (e) or 60° (f) 1D bar expansion. n = 10 neurons, N = 7 flies. Population responses shown as mean (line) and 95% CI (shaded). e-f, Dashed circle in stimulus diagrams represents 60° RF diameter upper limit (Extended Data Fig. 4g–h). g, Peak directional tuning responses in polar coordinates.
Since the LPLC2 dendrites are excited by T4 and T5 cells, we expect strong responses to the four cardinal directions of motion. We used a one-dimensional expanding (bar) motion to map LPLC2’s local directional preference. Expansion of a 10°-wide bar produced nearly uniform responses to outward (Fig. 3e,g), but not inward (Extended Data Fig. 4i,j) motion at all orientations. In contrast, expansion of a 60°-wide bar produced a clover-shaped orientation tuning with each “leaf” aligned to a cardinal direction (Fig. 3f,g and Extended Data Fig. 4k,l). Interestingly, the orientation tuning of the 10° and 60° bar-expansion responses are similar along the cardinal axes, but are most different in between these axes (Fig. 3g). These response profiles are consistent with LPLC2 neurons receiving inputs from the T4 and T5 neurons that are tuned to a broad (~90°) range of preferred directions11. When a narrow bar (10°) stimulus expands between the input neurons’ preferred directions, the excitation of individual LPLC2 dendritic arbors is weaker than that elicited by preferred-direction expansion, but more arbors are stimulated such that the total response is similar to the on-axis response. If the LPLC2 inputs are purely excitatory, then a wider bar (60°) should elicit greater responses. However, the prominent response reduction to off-axis motion (Fig. 3g) in conjunction with the lack of response to wide-field motion (Fig. 2f,g) suggest that LPLC2 dendrites must also receive strong visually-driven inhibitory inputs.
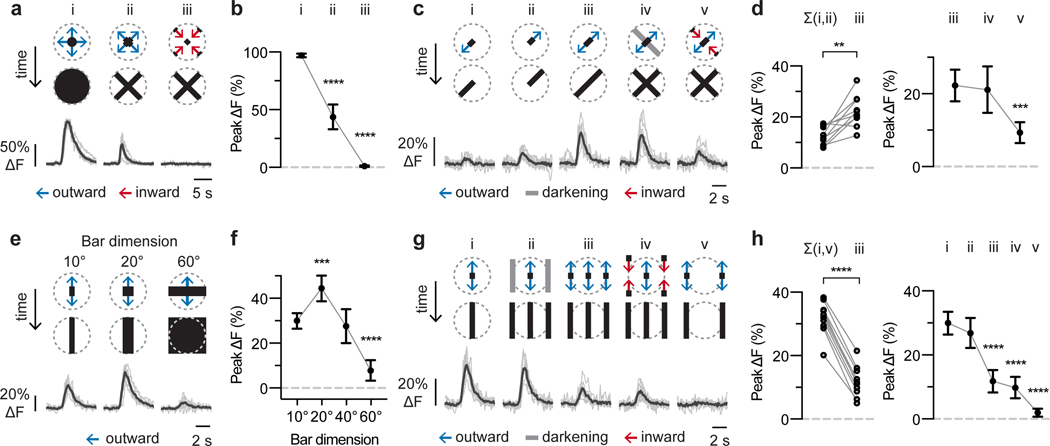
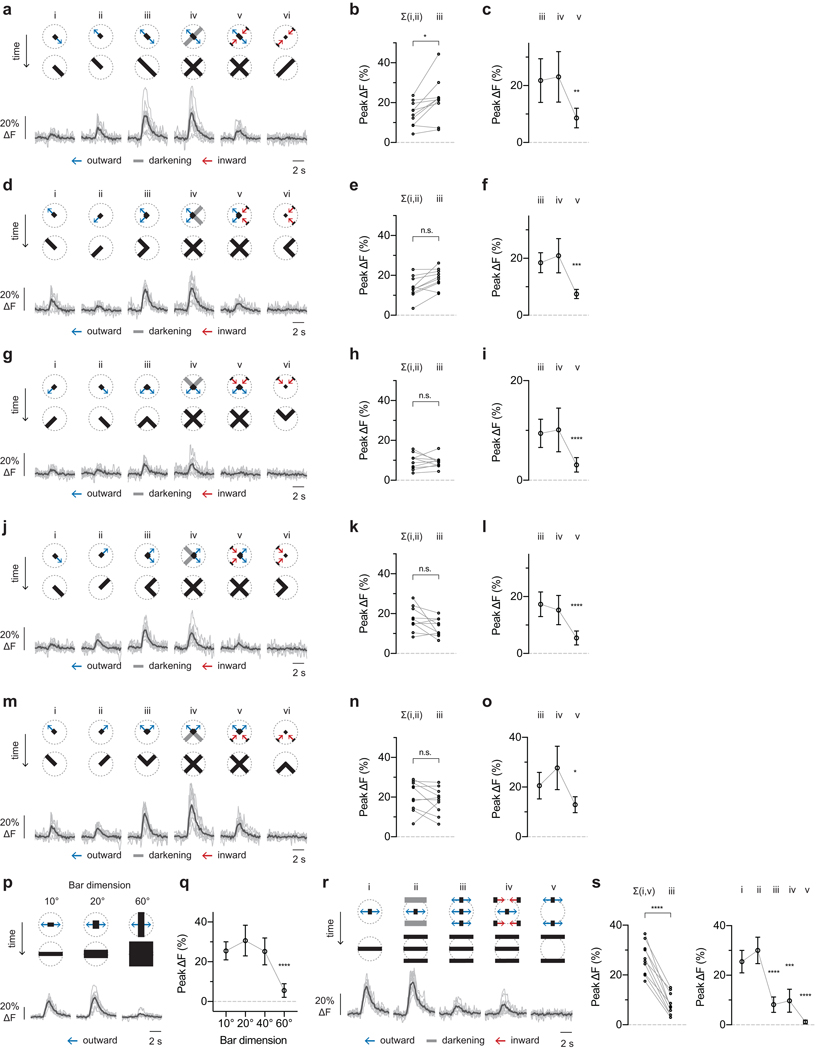
From these results, we infer that LPLC2 neurons integrate highly structured excitatory and inhibitory inputs, which may explain LPLC2’s exquisite looming selectivity. To directly interrogate the summation of excitatory inputs to different LPLC2 dendritic branches, we used narrow bar (10°) expansions to measure responses along the mapped cardinal axes. LPLC2 neurons responded to the outward motion of expanding bars in a cross formation and did not respond to inward bar motion (Fig. 4a,b). We next decomposed the expanding cross stimulus into individual arms targeted to different dendritic fields. Outward edge motion along single arms generated detectable, but small responses (Fig. 4ci,ii,d and Extended Data Fig. 5a–o), whereas expansion along two arms (Fig. 4ciii) produced responses greater than the summed responses to motion along two individual arms (Fig. 4d and Extended Data Fig. 5a,b). These results suggest that LPLC2 performs nonlinear integration of dendritic inputs from different lobula plate layers.
Figure 4: Contributions of excitatory and inhibitory inputs to LPLC2 visual responses.
Decomposition of motion along (a-d) or between (e-h) cardinal axes for individual LPLC2 cells. Stimulus diagram above calcium traces shows motion within receptive field (dashed circle). Bar stimuli have 10° fixed width and 20°/s edge speed unless otherwise specified. Traces are population average (black) and individual neurons (grey). Statistics analyzed using RM-ANOVA with specified post hoc test throughout. Population plots are mean and 95% CI. n = 10 neurons, N = 7 flies. * P < 0.05, ** P < 0.01, *** P < 0.001, **** P < 0.0001. a-b, Responses to disk expansion (i, 10°/s) and outward (ii) or inward (iii) cross motion. Dunnett’s post hoc test, reference i. c-d, Responses to outward motion along a cardinal axis (i-iii) and the effects of luminance (iv) or inward motion (v) on the orthogonal axis. d, left, Comparison of linear sum of individual responses (i,ii) to the measured combined response (iii). Circles, individual neurons. Bonferroni’s post hoc test. d, right, Effects of orthogonal axis darkening and inward motion. Dunnett’s post hoc test, reference iii. e-f, Effects of bar width on expansion between cardinal axes. Dunnett’s post hoc test, reference 10° bar response. g-h, Decomposing responses to motion between cardinal axes. h, left, Comparison of linear sum of individual responses to motion at receptive field center (i) and edges (v) to the measured response during expansion in both areas (iii). Circles, individual neurons. Bonferroni’s post hoc test. h, right, Comparison of motion at the edge versus center of the receptive field. Dunnett’s post hoc test, reference i.
LPLC2’s strong selectivity may result not only from this outwards motion sensitivity, but also from inwards motion inhibition. Since calcium imaging is not generally suited to direct measurements of inhibition, we designed visual stimuli to reveal its contribution. We combined outward motion along one cardinal axis with inward motion along the orthogonal axis. Inward motion, but not darkening, reduced LPLC2 responses when compared to outward motion alone (Fig. 4civ,v, d and Extended Data Fig. 5a–o). Since the inward motion was presented many visual columns away from the outward motion, this reduction is unlikely to result from interference with the presynaptic columnar excitatory input, and rather demonstrates direct inhibition of LPLC2 driven by non-preferred motion. In further support of this proposal, we find that LPLC2 responses to wide bars are reduced relative to narrow bar responses (Fig. 4e,f and Extended Data Fig. 5p,q), and that this size-dependent response reduction is caused by the presence of motion (in either direction) at the periphery of the LPLC2 receptive field (Fig. 4g,h and Extended Data Fig. 5r,s). In light of these results, the observed difference in the narrow and wide bar orientation tuning (Fig. 3g) suggests that off-axis motion cues at each dendritic field’s periphery, where excitatory directionally selective inputs are minimal, recruit inhibition that further shapes LPLC2’s selectivity.
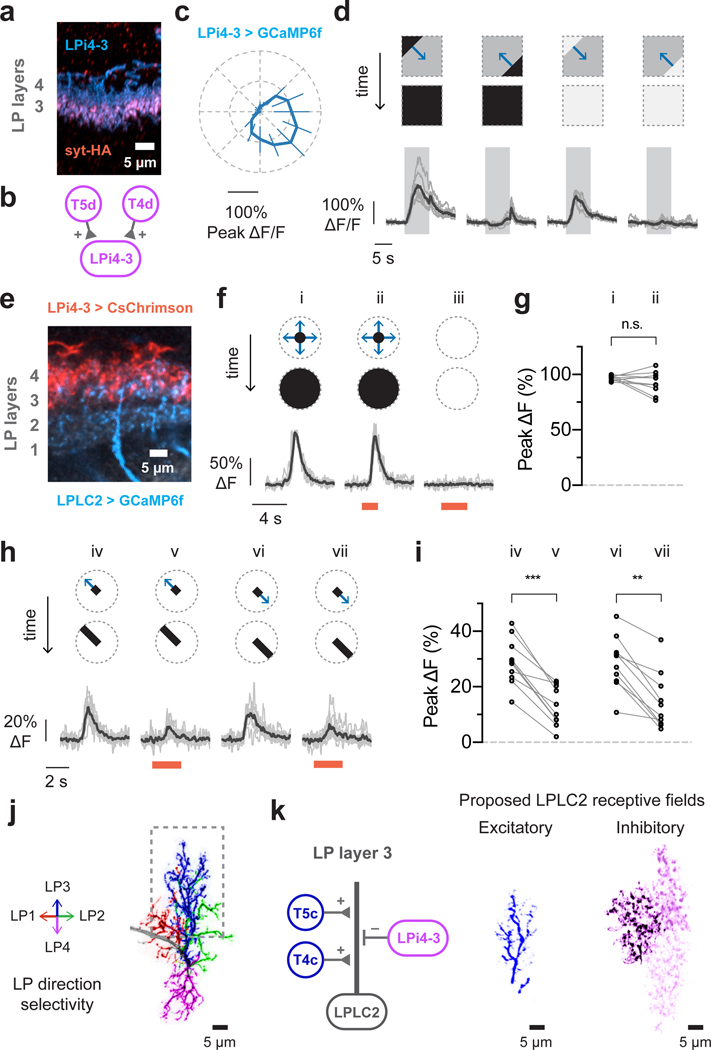
Lobula plate intrinsic (LPi) interneurons integrate directionally selective T4/T5 inputs in one lobula plate layer and project inhibitory outputs into the adjacent layer, which encodes the opposite direction of motion21. The LPi neurons are therefore ideally suited to inhibit LPLC2 in response to inward motion. We first explored this hypothesis by imaging calcium responses in LPi4-3, a neuron type with synaptic input and output sites in lobula plate layer 4 and 3 respectively21 (Fig. 5a,b). LPi4-3 responses were highly directionally selective in response to moving gratings (Fig. 5c and Extended Data Fig. 6). In addition, LPi4-3 responded to both dark and bright edge motion (Fig. 5d), indicating that LPi4-3 direction selectivity is inherited from both T4 and T5 cells in layer 4.
Figure 5: Directionally selective inhibitory inputs to LPLC2 further sculpt looming selectivity.
a-d, Lobula plate intrinsic interneuron LPi4-3 anatomy and direction selectivity. Traces are population average (black) and individual flies (grey). N = 7 flies. a, LPi4-3 neurons (cyan) with synaptogamin marker (red). b, Model of LPi4-3 inputs. c, Directional tuning response to moving square-wave gratings. d, Dark or bright edge motion along preferred and null directions. e-i, Effect of LPi4-3 activation on LPLC2. Stimulus diagram above calcium traces shows motion within receptive field (dashed circle). Traces are population average (black) and individual neurons (grey; circle in statistic plots). Red light stimulation is indicated as red bar. n = 10 neurons, N = 7 flies. e, Lobula plate view of LPLC2 (cyan) and LPi4-3 (red). f-g, Looming alone (i, r/v 40 ms) or with red light (ii), and red light stimulation alone (iii). g, Individual neuron responses. P = 0.209, paired t-test (two-sided). h-i, Red-light activation effects on responses to bar stimuli (10° width, 20°/s edge speed). RM-ANOVA with Bonferroni’s post hoc test. ** P < 0.01, *** P < 0.001. j, Single LPLC2 neuron with dendritic branches colored by lobula plate layer and direction selectivity. k, Proposed input model and receptive fields for lobula plate layer 3 (dashed box in j). The inhibitory receptive field image is composed of three neighboring LPi4-3 cells.
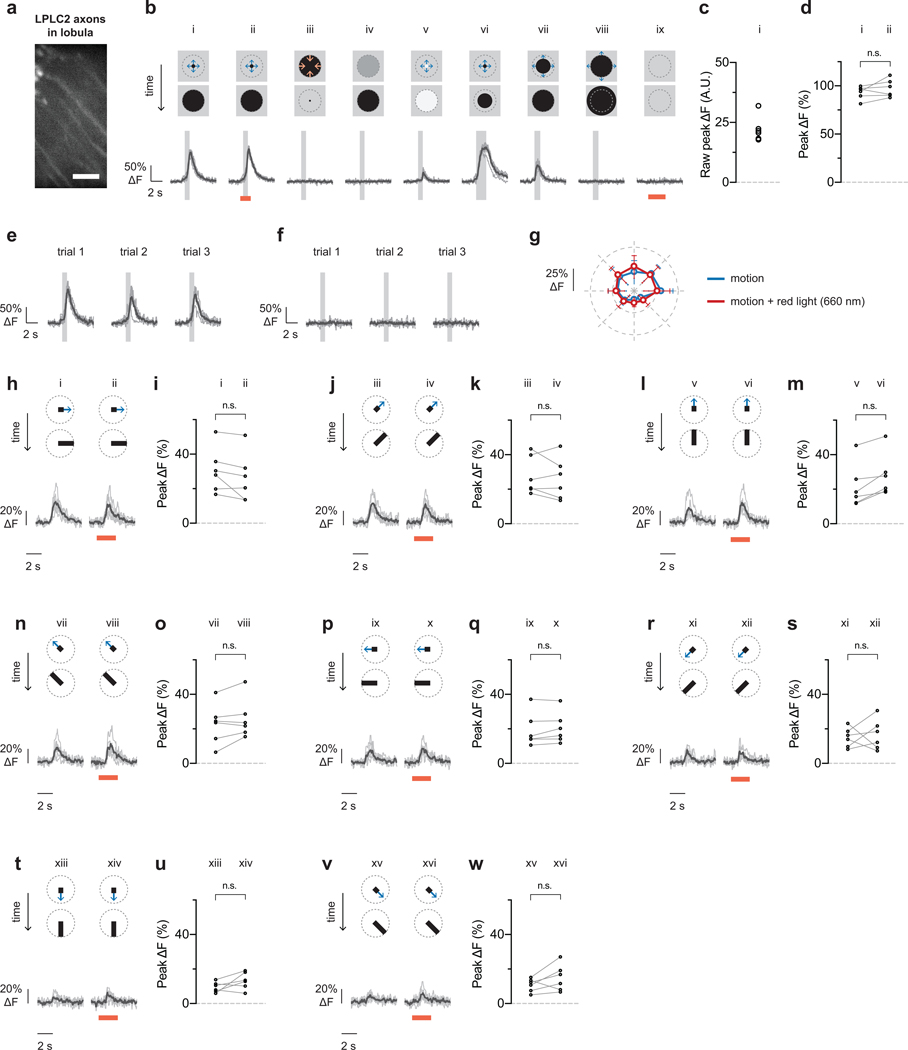
We next examined whether LPi4-3 inhibits LPLC2 by optogenetically depolarizing LPi4-3 while imaging the calcium response in individual LPLC2 axons (Fig. 5e and Extended Data Fig. 7). We analyzed the difference between visual stimulus presentation with and without LPi4-3 depolarization. Neither red light alone nor LPi4-3 depolarization significantly altered LPLC2 looming responses (Fig. 5f,g). However, LPi4-3 depolarization significantly reduced responses to weaker visual stimuli such as expansion of a 10° unidirectional bar (Fig. 5h,i and Extended Data Fig. 7h–s). Since we did not observe any red-light driven change in visually-evoked responses in control flies (Extended Data Fig. 8), we conclude that LPi4-3, and presumably other LPi types, provides directionally selective inhibition onto LPLC2 to sharpen looming selectivity.
Based on the results presented here and the known anatomy of the lobula plate, a parsimonious circuit model explains the LPLC2 looming detection mechanism (Fig. 5j,k). Excitatory inputs from presynaptic retinotopically-arranged, directionally-selective T4 and T5 neurons supply four outward-motion selective dendritic fields, making LPLC2 strongly responsive to outward motion from the receptive field center. LPLC2 respond more strongly to dark-edge looming as opposed to bright-edge looming (Fig. 2e and Extended Data Fig. 4f), indicating that T5 cells are likely the major excitatory input. Furthermore, LPi neurons provide directionally-selective inhibition and known LPis have larger receptive fields than the small-field T4 and T5 cells (Extended Data Fig. 9). The LPis are thus well positioned to also supply an inhibitory surround to LPLC2 neurons in a radially opposing manner (Fig. 5k). This inhibition further sculpts LPLC2’s response properties, suppressing responses from non-looming stimuli as well as responses to looming motion emanating from outside the neuron’s receptive field center (Extended Data Fig. 10).
The radial motion opponency exhibited by LPLC2 is distinct from other known mechanisms for looming detection22–25. For example, the lobula giant movement detector (LGMD) of locusts detects looming without the benefit of directionally selective inputs, instead integrating luminance changes temporally across a single giant dendritic arbor that spans one eye’s entire field of view5,25–27. In contrast, individual Drosophila LPLC2 neurons comprise a set of small looming detectors tiling the visual field, with each member relying on precise spatial placement of dendrites within a directionally-selective motion feature map to generate looming responses. Sensory feature maps are ubiquitous among organisms3,28, suggesting that a similar strategy may be employed in other nervous systems to compose highly-selective detectors for features such as looming.
LPLC2 are one of several looming-sensitive visual projection cell types identified in Drosophila7,10,29 and the second cell type identified as a presynaptic partner of the giant fiber. These parallel channels encode different features of a looming stimulus, such as its size or speed29. LPLC2 are also likely presynaptic to multiple central brain and descending pathways, an organization that would enable use of the same looming information to coordinate different actions. The faithful encoding of a visual feature may thus be divided into parallel channels that are integrated differently by downstream motor pathways to sculpt the spatiotemporal selectivity of behavioral responses.
METHODS
Fly stocks
Calcium imaging experiments were performed with female flies 2–5 days post-eclosion, maintained under standard conditions (21.8°C, 55% humidity, 16 h light/8 h dark, standard cornmeal/molasses food). Flies used for simultaneous optogenetics with calcium imaging were raised on 0.2 mM retinal food in foil-covered vials.
Whole-cell patch recording was performed on female flies 3–5 days post-eclosion. Flies were reared at 25˚C, 50% humidity, cornmeal/molasses food containing 0.2mM retinal and maintained on 0.4mM retinal as adults. Flies were kept in darkness by foil-covering vials.
Supplementary Table 1 lists fly genotypes used in functional characterization experiments. Supplementary Table 2 contains driver lines and reporter strains used for anatomical analyses. To generate new split-GAL4 lines (OL0047B, SS03752, SS00810), we used GAL4-line expression patterns30,31 (Barry J. Dickson, personal communication) to identify potential split-GAL4 combinations. We constructed hemidrivers32 and screened candidate combinations as previously described10. Enhancerless split-GAL4 controls used in calcium imaging optogenetic experiments are as previously described33. We additionally used a split-GAL4 combination (SS01062) lacking central nervous system expression as a control line for whole-cell recording and behavior experiments (gift from Shigehiro Namiki).
Histology and anatomical analyses
All anatomical analyses used female flies. Multicolor stochastic labeling of individual neurons used MCFO-1 or MCFO-7 as reporter16 and visualization of overall expression patterns for split-GAL4 lines and/or presynaptic marker distribution were carried out as previously described16,34, using pJFRC51–3XUAS-IVS-syt::smHA (su(Hw)attP1) and pJFRC225–5XUAS-IVS-myr::smFP-FLAG in VK00005 as reporters. Anti-Brp35 (mAB Nc82, Developmental Studies Hybridoma Bank) was used as a neuropil marker. Detailed protocols are also available online (http://www.janelia.org/project-team/flylight/protocols).
A similar protocol with a shorter antibody incubation (overnight for both primary and secondary antibodies) was used to visualize the expression patterns of flies for T4/T5 and LPi4-3 optogenetic experiments. Primary antibodies used were mouse anti-GFP (mAb 3E6, #A-11120, ThermoFisher Scientific, 1:100 dilution), rat anti-CadN (mAb DN-Ex #836, Developmental Studies Hybridoma Bank, 1:20 dilution) and rabbit anti-DsRed (#632496, Clontech, 1:1000 dilution). Secondary antibodies used were DyLight 488-AffiniPure Donkey Anti-Mouse IgG (H+L) (Jackson ImmunoResearch Laboratories, Inc. #715-485-151, 1:500 dilution), DyLight 594 AffiniPure Donkey anti Rabbit IgG (H+L) (Jackson ImmunoResearch Laboratories, Inc., #711-515-152, 1:300 dilution) and Alexa Fluor® 647 AffiniPure Donkey Anti-Rat IgG (H+L) (Jackson ImmunoResearch Laboratories, Inc., #712-605-153, 1:300 dilution). Brains were mounted in SlowFade Gold (ThermoFisher Scientific, #S36937) and imaged on a Zeiss LSM 710 confocal microscope using a 40x/NA 1.3 objective.
Additional specimen and imaging condition detail are provided in Supplementary Table 2.
General image processing for anatomical analyses was as described16,34; see also Supplementary Table 2. Most anatomy figures show reconstructions generated from image stacks via the NeuronAnnotator mode of Vaa3D37 and exported as TIFF screenshots. This export step can change pixel resolution but does not affect the comparatively large features (e.g. branching patterns) examined in this study. The scale of these exported images was determined from the dimensions and pixel resolution of the original image and the pixel resolution and zoom factor of the exported image. Brain alignment based on an anti-Brp reference stain was as previously described34. Additional image processing was done using Fiji (http://fiji.sc/) to adjust brightness and/or contrast for each imaging channel. For display purposes, some images were mirrored or rotated during figure assembly.
To characterize LPLC2 arbors in the LP, we examined high-resolution (63x) image stacks with MCFO-labeled LPLC2 cells using the NeuronAnnotator mode of Vaa3D. Because the proximity of the neuropil boundary may constrain cellular morphology at the edge of the LP retinotopic array, we focused on neurons with more central positions. In addition, we only examined cells with arbors that could be distinguished from other cells in the same stack by color and/or location. 110 cells from 20 fly brains imaged at high-resolution (63x) met these criteria. We used both new images (14 brains, driver lines OL0047B) as well as images from a previous study10 (6 brains, OL0048B) for these analyses.
To further visualize the three-dimensional distribution of LPLC2 branches in different LP layers for a given cell (Figure 1d,e, Extended Data Figure 1e,f and Supplementary Video 1), we segmented and colored the branches of six MCFO-labeled LPLC2 neurons based on their LP layer positions (estimated using anti-Brp patterns as a layer reference). Segmentations were performed on image stacks using Fluorender38. Other image processing was done with Fiji (https://fiji.sc/) and Vaa3D (for display purposes, see above). Supplementary Video 1 was generated using Fluorender.
Statistics and reproducibility
Statistical tests for calcium imaging data took multiple comparisons into account wherever possible, using the specified (two-sided) post hoc test following a repeated-measure analysis of variance (RM ANOVA). Generally, the groups compared were plotted together. However, the following datasets were plotted separately, but grouped together for statistical multiple comparisons:
Linear sum versus measured response: Fig. 4d (left), Extended Data Fig. 5b,e,h,k,n
Inhibition at RF periphery: Fig. 4h (left), Extended Data Fig. 5s (left)
LPi4-3 optogenetics: Fig. 5i, Extended Data Fig. 7g–s
LPi4-3 optogenetics controls: Extended Data Fig. 8g–w
All anatomical results were confirmed across multiple flies and cells. Specific sample numbers for each anatomy figure are included in Supplementary Table 2. The same set of image stacks was often used to examine multiple features of a given cell type (for example, layer pattern and lateral spread).
The general pattern of LPLC2 arbor distribution across LP layers (Fig. 1d,e) is similar for all 110 cells examined in the manner described above. However, details of branching pattern are variable. For example, some LPLC2 cells bifurcate within the lobula (see the 3rd and 5th cells in Extended Data Figure 1e,f) but nevertheless produce a similar overall dendritic pattern as cells with a single main neurite. Other variable features included the relative size of the branches in different layers (e.g. the spread of the layer 3 branches of some cells appeared much smaller than that of the layer 4 branches).
Whole-cell patch clamp recordings
Whole-cell patch electrophysiology was performed in tethered flies as previously described14. Here, all legs were cut at the femur and glued in place to reduce mechanosensory inputs. The posterior surface of the head capsule was dissected to gain access to the giant fiber neuron soma, which was visualized by GFP expression.
Optogenetic activation was performed with an amber light source (CoolLED pE-100, 595 nm), triggered by an isolated pulse stimulator (Model 2100, A-M Systems) to deliver a 50 ms pulse every 30 seconds, and calibrated to 1.03 mW/mm2 (using S170C Sensor, Thorlabs). Responses in the giant fiber neuron were recorded in current clamp mode (MultiClamp 700B amplifier, Molecular Devices), low-pass filtered at 10 kHz, and digitized (Digidata 1440A, Molecular Devices) at 40 kHz. Traces are not corrected for liquid junction potential (~13mV) and no current was injected. Recordings were only analyzed if a high seal resistance (~8 GΩ) was achieved before membrane rupture and the resting membrane potential remained between −55mV and −70mV throughout the experiment.
Fly preparation for imaging
Flies were prepared and mounted in a fly holder as previously described39. Notably, the most anterior legs (T1) were severed and the stumps were glued to the proboscis. The fly’s head was positioned and glued to the fly holder such that the eye’s equator was 55° ± 5° below the horizontal. Head pitch angle for each fly was established using the position of the pseudopupil40. A tungsten dissection needle (World Precision Instruments 501316) was used to remove the cuticle and to sever muscle 16.
Two-photon calcium imaging
Imaging was conducted with a two-photon microscope (Thorlabs) controlled by ScanImage 201541 and a mode-lock laser (Spectra-Physics Mai Tai eHP DS) tuned to 920 nm delivering <14 mW power at the sample. We imaged with a 16x water-immersion objective (Nikon CFI75, NA 0.8) with a bandpass filter (Semrock 503/40nm) in front of the photomultiplier tube (Hamamatsu GaAsP H10770PB-40 SEL) to reduce bleed-through from the visual stimulus projector. Volumes were acquired at 5.6 to 7.4 Hz with each frame at x-y pixel resolution ranging from 256 × 192 to 256 × 128. Calcium responses were stable throughout imaging sessions under a constant carbogen (95% O2/5% CO2) bubbled saline42 flow at 0.4 mL/min. For single axon imaging experiments where an additional 90 minutes of setup time was required to map and analyze receptive fields prior to presenting any single-cell receptive field centered visual stimuli, we included individual trial calcium traces which span a recording time duration of roughly two hours to demonstrate that responses were stable (Extended Data Fig. 4d–e, 7e–f, 8e–f).
Optogenetic stimulation during two-photon imaging was delivered through the objective using a fiber-coupled 660 nm red LED (Thorlabs M660F1) collimated with a fiberport coupler (Thorlabs PAF-X-15-PC-A). The red light was further cleaned up with a bandpass filter (Semrock FF01–661/20–25) and the beam waist was adjusted using an iris to achieve a 150 μm diameter spot at the sample plane. A custom-made alignment target was used to verify that LED illumination spot size and position matched the two-photon scanning region. The total red light power delivered at the sample plane was either 3.85 μW or 8.77 μW, which corresponds to a density of about 220 μW/mm2 and 500 μW/mm2 respectively. For all LPi4-3 optogenetic experiments, only the lowest light power (3.85 μW) was used.
Visual stimulation
Visual stimuli were displayed on a cylindrical screen (HolidayProjectors Mylar screen) with a custom projector setup39 (Texas Instruments DLP LightCrafter) using a green laser light source (Laser Quantum Tau, 532 nm). Stimuli were displayed only to the fly’s right eye at a framerate of 180 Hz and a spatial coverage of 90° (in both azimuth and elevation). Stimuli were generated with appropriate geometric corrections using custom OpenGL code written in C++.
Visual stimuli were grouped into sets such that each set encompassed a single run of all protocols, and each fly was presented with three sets (for a total of three repetitions per protocol). Protocols within each set were randomly shuffled such that each set had a different protocol order.
For axon terminal population imaging, looming stimuli were centered at a fixed position (35° azimuth, 0° elevation). For single-cell imaging, we first ran protocols to map the receptive field center and directional tuning, which we then used as parameters for subsequent visual stimulus code.
Constant approach velocity looming stimuli were generated with r/v parameterization as previously described43. Luminance-matched controls for looming stimulus were generated frame-by-frame with the following equation:
where D is the estimated receptive field diameter (fixed at 60°), d is looming stimulus disk diameter, and I is the intensity (0 to 100%). The intensity of background (Ibg) is always set to 50%, whereas intensity of foreground (Ifg) is either bright (100%) or dark (0%). The measured 532 nm intensity at projector screen surface is about 1.4, 212, and 378 nW/mm2 for 0%, 50%, and 100% intensity respectively (see Extended Data Fig. 4m for darkening stimulus power measurement).
Single-cell cross stimuli contained a static 10° square at the receptive field center throughout the entire stimulus duration (including the pre-motion holding period).
All stimuli included a 2 second pre- and post-motion holding window to decouple the visual response from the appearance of a new visual stimulus versus the motion of that stimulus. For simultaneous visual and optogenetic stimulation experiments, the pre- and post-motion holding window was shortened to 500 ms. We waited at least 8 seconds between stimuli to allow both visual and calcium responses to return to baseline. The projector background intensity was held at 50% throughout inter-stimulus intervals.
We aligned visual stimulus onset times to specific imaging frames by using a photodiode (Luna Optoelectronics SD112–45-11–221) to monitor visual stimulus frames.
Data analysis
We used custom MATLAB (MathWorks) scripts to parse fluorescence and temporally align imaging frames with the visual stimulus. No motion correction was used on any images. Statistics were computed using Prism7 (GraphPad Software) and MATLAB (MathWorks).
Calculation of fluorescence
We recorded 10 to 12 z-planes in each imaging volume, but also saved the flyback frames between each volume acquisition when the excitation light source is completely attenuated by the pockel cell. The flyback frames therefore recorded photomultiplier baseline values along with any bleed through light from visual stimuli and optogenetic modulation. We subtracted the average value of flyback frames in a volume from the images in that volume.
For LPLC2 axon terminal imaging, we calculated ΔF/F by using the 2 seconds before visual stimulus onset as the baseline fluorescence. For LPLC2 single axon imaging, there was no detectable basal (baseline) fluorescence so we measured ΔF by normalizing the raw fluorescence by the peak response of the axon to a dark disc expansion (receptive field centered 5° to 60° looming at either 10°/s edge speed for visual stimulus alone or r/v = 40 ms looming for optogenetic experiments).
For LPi4-3 imaging, we measured fluorescence from all visible boutons but excluded all somas. Due to the fly brain orientation used for imaging, it was not possible to distinguish between lobula plate layers 3 and 4. We assume the measured fluorescence can come from either or both layers. We calculated ΔF/F by using the 2 seconds before visual stimulus onset as the baseline fluorescence.
Peak fluorescence responses for a given stimulus were found by averaging a 300 ms window around the maximum fluorescence response found between motion onset and 500 ms after motion has ended. The mean fluorescence response for a given stimulus was found by averaging the response through the entire motion interval.
Region of interest selection
We time-averaged all frames in an experiment trial to generate a template image for ROI selection. All regions of interests were selected manually in 3D using Fluorender38 and further curated in ImageJ44. We visually inspected and excluded any pixels where two axons crossed between imaging planes. Representative time-averaged maximum intensity projection calcium images are shown for LPLC2 axon terminals (Fig. 2c, Extended Data Fig. 2b), individual LPLC2 axons (Fig. 3b, Extended Data Fig. 7b, 8a), and LPi4-3 population (Extended Data Fig. 6b). The axon terminal image in Fig. 2c was rotated and corners were filled with black background.
Receptive field mapping
We computed integrated responses from looming presented on a dense 5° spaced grid where each position corresponds to a looming center. The looming stimulus expanded from 5° to 20° at a constant 10°/s edge speed. The associated grid position and integrated fluorescence response were fitted with a 2D Gaussian:
with the peak position (x0, y0) as the estimated receptive field center position (azimuth, elevation). The angle (ɑ) between receptive field center and disk stimulus center , is calculated assuming the center positions are on a unit sphere:
Directional tuning
For individual LPLC2 neurons, we performed a series of symmetric bar expansions (edge speed 20°/s) centered on each neuron’s receptive field, rotating the axis in 15° increments. The measured cardinal axis directions (consistently at 45° offset from the horizontal) were used to orient single-cell visual stimuli. The directional tuning curve was generated using Origin (OriginLab) by interpolating with a Bezier curve.
For the LPi4-3 population, we displayed a 1 Hz temporal frequency square-wave grating (20° spatial period) motion for two seconds inside a 50° square aperture (centered at 35° azimuth, 0° elevation). The grating motion direction was shifted every 22.5° to sample directional preference. To assess edge selectivity along the measured preferred (315°) and null (135°) directions, we showed a dark or bright edge sweeping across the screen at 20°/s edge speed.
Behavior assay
We tested fly responses to looming stimuli using a custom built, semi-automated apparatus to gate individual flies onto a platform, where they stood at the center of a 6” sphere and were subjected to a dark looming circle (10°−90°) that expanded frontally with r/v ratio of either 40 ms or 80 ms14. High speed videos (6000 frames per second) of fly responses were manually scored for whether or not the fly took off from the ground and initiated flight. The results are modeled as a binomial distribution with flies that jumped out of flies for each genotype and looming condition tested. The confidence interval is calculated using the following Wilson score interval (WSI):
where , and is the critical value at .
Data and code availability
All imaging data and analysis code are available upon reasonable request from the authors. Representative image stacks used for anatomical analyses are available from http://splitgal4.janelia.org/cgi-bin/splitgal4.cgi
Extended Data
Extended data figure 1: Additional LPLC2 anatomy.
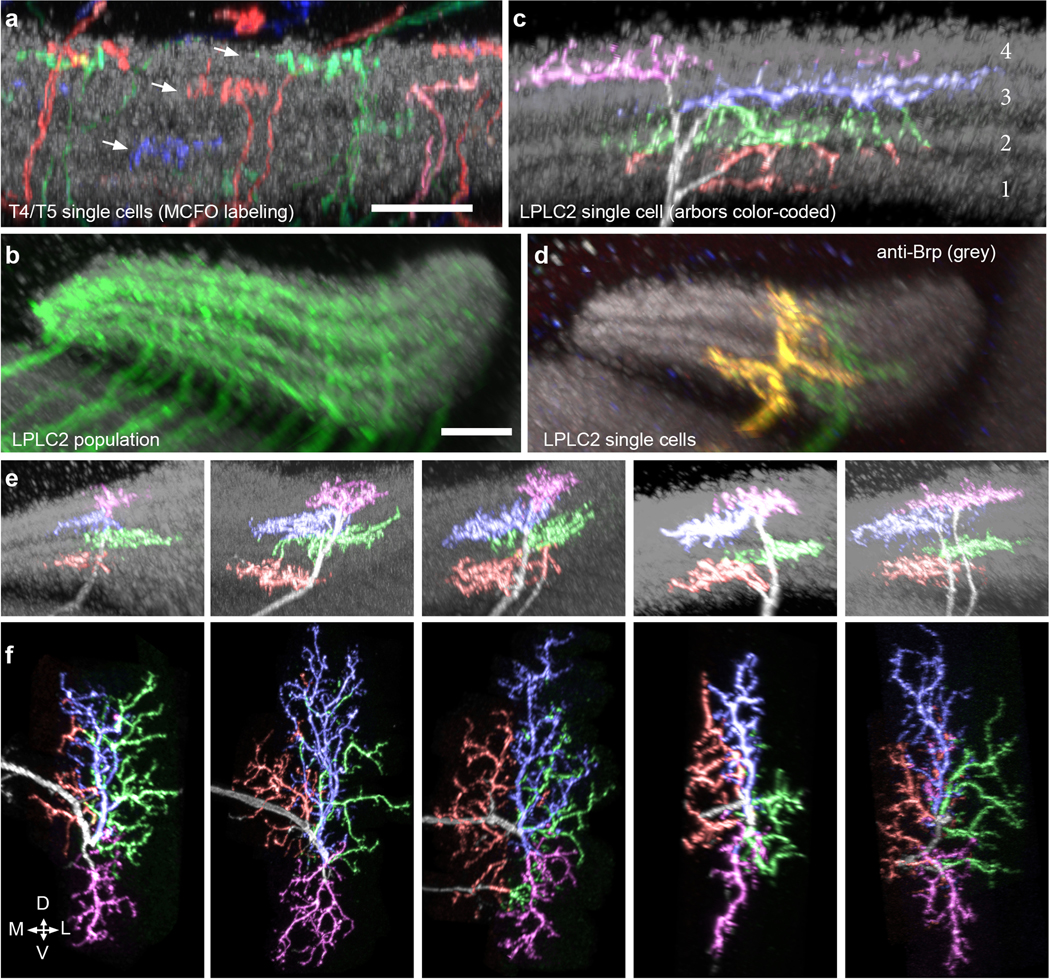
a, Layer pattern of MCFO-labeled T4 and T5 neurons in the lobula plate (LP). Individual cells arborize in one of the four LP layers (arrows). A neuropil marker (anti-Brp) is shown in grey. The presynaptic terminals of T4/T5 in the LP are mainly located in one of four Brp-rich strata. Scale bar, 10 μm. b-d, LPLC2 cells cover the LP in overlapping patterns. b, As a population, LPLC2 dendrites (green) cover all LP layers. Scale bar, 10 μm. c, Layer pattern for the LPLC2 cell shown in Fig. 1e,g on reference neuropil (grey, anti-Brp). LPLC2 arbors are mainly located in the Brp-rich layers that also contain the bulk of the presynaptic terminals of T4/T5 in the LP (see a). Branches were manually colored based on layer position. d, MCFO-labeling of two LPLC2 cells in the LP. Note the different positions of the layer 1 and layer 2 branches of the two cells. e-f, Additional examples of images of LPLC2 cells; images processed and displayed as in Fig. 1d,e. Although details of the branching patterns vary, the general pattern of layer specific arbor spread appears stereotyped.
Extended data figure 2: Functional connectivity between T4/T5 and LPLC2.
a-b, Anatomy of fly transgenic used for functional connectivity experiments. Scale bar, 10 μm. a, Representative confocal image of Chrimson-expressing T4/T5 cells (red) and GCaMP6s-expressing LPLC2 cells (cyan) overlaid on neuropil marker (N-Cadherin stain, grey). b, Two-photon averaged calcium image showing LPLC2 axon terminal imaging region. c, Experimental conditions for visual stimulus and optogenetic stimulation. Conditions i and ii are looming at r/v = 40 ms, whereas conditions iii and iv have a static background intensity. d-e, Fly (N = 6) responses to visual and optogenetic stimuli. Individual fly responses are in grey and population average in black. Grey box indicates looming motion period. Red bar indicates red light stimulation period. e, Peak calcium response plotted for individual flies (circles) corresponding to measurements in (d). f-g, Enhancerless GAL4 control fly (N = 6) responses to visual and optogenetic stimuli. h, Comparison of peak calcium responses to red light between empty (f-g) and T4/T5 (d-e) GAL4 driver lines. Individual fly responses (symbols) overlaid on population mean (line). Two-way ANOVA with Bonferroni’s post hoc test. * P < 0.05, *** P < 0.001.
Extended data figure 3: Population LPLC2 looming selectivity and speed tuning.
a-e, LPLC2 axon terminal population calcium responses to dark looming and wide-field motion stimuli (N = 8 flies). Grey box on traces indicates stimulus motion period. a-b, Constant edge velocity looming (condition i, blue traces, 5°−60° expansion, 10°/s edge speed) and wide-field motion stimuli (condition ii-vii, black traces, 20°/s edge speed, 10° bar size in all applicable conditions). c-e, Constant edge velocity looming responses at the indicated speeds. Response during stimulus presentation is plotted either as peak fluorescence (d) or as instantaneous fluorescence as a function of disk diameter (e). d, Population mean ± 95% CI, with overlaid individual fly responses. e, Mean response (line) and 95% CI (shaded region). f, Looming-evoked escape rate under different effectors modulating LPLC2 activity or transmission. A total of 2811 flies were assayed, with N > 130 flies in each condition shown (see Supplementary Table 3 for detailed statistics). Circle is jump rate; error bars are 95% CI. * P < 0.05 Tukey’s HSD test.
Extended data figure 4: Single-cell LPLC2 receptive-field-centered responses.
a-l, LPLC2 single axon responses to various dark/bright disk or ring stimuli (n = 10 neurons, N = 7 flies). All calcium traces shown depict individual neurons in grey and population average in black unless otherwise specified. Dashed grey circle in visual stimulus diagrams represents the measured 60° diameter upper limit of the LPLC2 receptive field. Overlaid grey box on calcium traces indicates motion stimulus period. Each neuron’s response is normalized to its dark looming response (i, 5° to 60° expansion). All dark and bright motion stimuli used constant edge velocity (10°/s). Ring stimuli have fixed width of 5° (the difference between inner and outer radius). b-c, Individual neuron responses shown as circles. RM-ANOVA with Bonferroni’s post hoc test. **** P < 0.0001. d-e, Individual trial traces in response to expansion stimulus (ai) are shown in (d), and in response to contraction stimulus (aii) are shown in (e). f, Dark versus bright ring expansion traces (population mean and 95% CI). g-h, Receptive field size mapping. g, Calcium responses (top) to various size disk expansions (bottom). h, Calcium transients during pre-expansion static disk display (circle) and during-expansion responses plotted as a function of disk diameter (population mean ± 95% CI). i-l, One-dimensional inward bar motion responses for 10° (i,j) and 60° bars (k,l). Traces shown in (i,k) and plotted data in (j,l) are population average (dark) and 95% CI (light). m, Power measured at projection screen surface for darkening stimulus (av). Each data point is averaged over a 5.55 ms bin, corresponding to a single projector frame time.
Extended data figure 5: Further decomposition of excitatory and inhibitory inputs to LPLC2.
Decomposition of motion along cardinal axes (a-o) or between cardinal axes (p-s) from the same neurons as Fig. 4 (n = 10 neurons, N = 7 flies). Calcium traces are population average (black) and individual neurons (grey). Statistics analyzed using RM-ANOVA with specified post hoc test throughout. Population plots are mean and 95% CI. * P < 0.05, ** P < 0.01, *** P < 0.001, **** P < 0.0001. a-j, Calcium traces and statistics are matched across each row (i.e. a-c, d-f, etc.). Statistics plots on the left (b,e,h,k,n) compare the linear sum of individual responses (i,ii) to the measured combined response (iii), with individual neurons shown as circles and Bonferroni’s post hoc test. Statistics plots on the right (c,f,i,l,o) show the effect of orthogonal axis darkening and inward motion, Dunnett’s post hoc test using reference iii. p-q, Effects of bar width on expansion between cardinal axes. Dunnett’s post hoc test, reference 10° bar response. r-s, Decomposing responses to motion between cardinal axes. s, left, Comparison of the linear sum of individual responses at the receptive field center (i) and edges (v) versus the measured response to expansion in both areas (iii). Individual neurons shown as circles. Bonferroni’s post hoc test. s, right, Comparison of motion at the edge versus center of the receptive field. Dunnett’s post hoc test, reference i.
Extended data figure 6: LPi4-3 directional tuning.
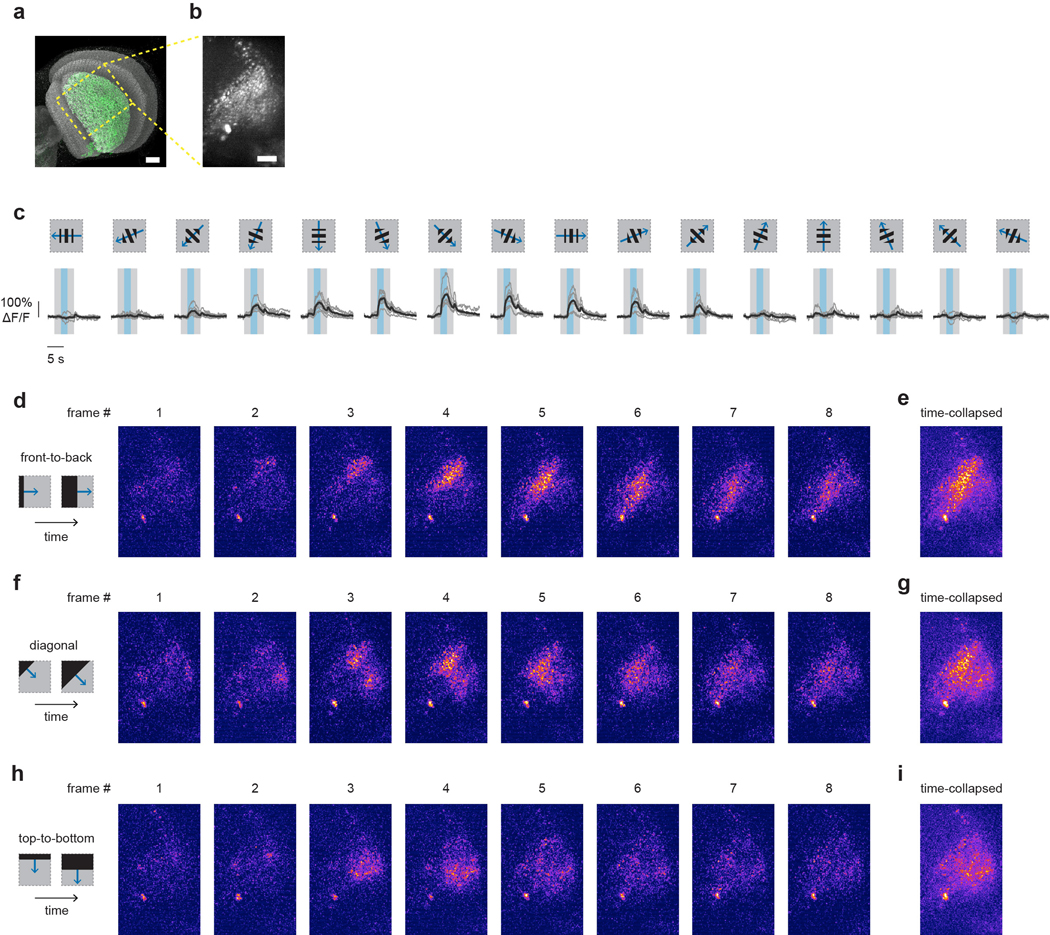
a, LPi4-3 (green) expression pattern in the LP and the approximate region imaged with two-photon (yellow box). Scale bar, 20 μm. b, Two-photon maximum z-projection (60 μm depth). Scale bar, 20 μm. c, Directional tuning with 1 Hz temporal frequency square-wave grating displayed within a 50° square aperture. Overlaid bars represent stimulus onset (grey) and period of motion (blue). Individual fly responses shown in dark grey and population average shown in black (N = 6 flies). d-i, Spatially and temporally filtered calcium images (median filtered and temporally binned by 4 volumes) in response to dark edge motion along the directions indicated from one representative fly. Five other flies showed a similar response. All images are shown on the same intensity scale. Each frame (d,f,h) spans approximately 700 ms. The time-collapsed maximum projection images (e,g,i) show that different LPi4-3 boutons respond to front-to-back (e) versus top-to-bottom (i) edge motion, indicating a difference in directional preference.
Extended data figure 7: Effect of LPi4-3 depolarization on LPLC2 visual response properties.
LPLC2 single-cell visual responses in transgenic flies expressing CsChrimson in LPi4-3 cells and GCaMP6f in LPLC2 cells (n = 10 neurons, N = 7 flies). Calcium traces shown for individual neurons (grey) and population average (black) throughout. Each neuron’s response is normalized to its dark looming response (ci, 5° to 60° expansion at r/v = 40 ms) throughout the figure. Overlaid light grey bar on calcium traces indicates motion stimulus period. Red bar indicates red light stimulation period. a, Maximum intensity projection image of CsChrimson-expressing LPi4-3 cells (red) and GCaMP6f-expressing LPLC2 cells (cyan) overlaid on neuropil marker (grey, N-Cadherin stain). Scale bar, 10 μm. b, Two-photon imaging region is restricted to LPLC2 axons in the lobula. Scale bar, 10 μm. c-s, Visual responses to receptive-field-centered stimuli. c, Stimulus diagram (top) and calcium response (bottom) for constant approach velocity looming (i-iv, r/v = 40 ms) and constant edge expansion (v-vii, 10°/s edge speed). d, Raw peak calcium responses to stimulus (ci) used for normalization are shown for each neuron. e, Individual trial responses to stimulus (ci). f, Individual trial responses to stimulus (cii). g-s, Comparison of visual responses with or without red light (660 nm) stimulation (see Methods). Directional tuning with a 10° bar expanding outward at 20°/s along the indicated directions. RM-ANOVA with Bonferroni’s post hoc test. * P < 0.05, ** P < 0.01, **** P < 0.0001. g, Polar plot summary (means ± 95% CI). Statistically significant data points (P < 0.05) are drawn as closed circles, insignificant data points are drawn as open circles. h-s, Detailed single cell traces and comparisons. Individual neurons depicted as circles in statistical comparisons.
Extended data figure 8: Controls for LPi4-3 optogenetic modulation experiments.
Single-cell visual responses from control flies with an LPLC2-driven GCaMP6f and an enhancerless GAL4-driven CsChrimson (n = 6 neurons, N = 6 flies). Calcium traces shown for individual neurons (grey) and population average (black) throughout. Each neuron’s response is normalized to its dark looming response (bi, 5° to 60° expansion at r/v = 40 ms) throughout the figure. Overlaid light grey bar indicates motion stimulus period. Red bar indicates red light stimulation period. a, Representative calcium image from LPLC2 axons in the lobula. Scale bar, 10 μm. b-f, Visual responses to receptive-field-centered stimuli. b, Stimulus diagram (top) and calcium response trace (bottom) for constant approach velocity looming (i-v, r/v = 40 ms) and constant edge expansion (vi-viii, 10°/s edge speed). c, Raw peak calcium responses to stimulus used for normalization (bi) are shown for individual neurons. d, Effect of red light on looming responses (P = 0.2237, paired t-test, two-sided). e, Individual trial responses to stimulus (bi). f, Individual trial responses to stimulus (biii). g-w, Comparison of visual responses with or without red light (660 nm) stimulation. Directional tuning with a 10° bar expanding outward at 20°/s along the indicated directions. RM-ANOVA with Bonferroni’s post hoc test, * P < 0.05. g, Polar plot summary (means ± 95% CI). Statistically significant data points (P < 0.05) are drawn as closed circles, insignificant data points are drawn as open circles. h-w, Detailed single cell traces and comparisons. Individual neurons depicted as circles in statistical comparisons.
Extended data figure 9: Size and layer pattern of LPLC2 cells and putative inputs to LPLC2 dendrites.
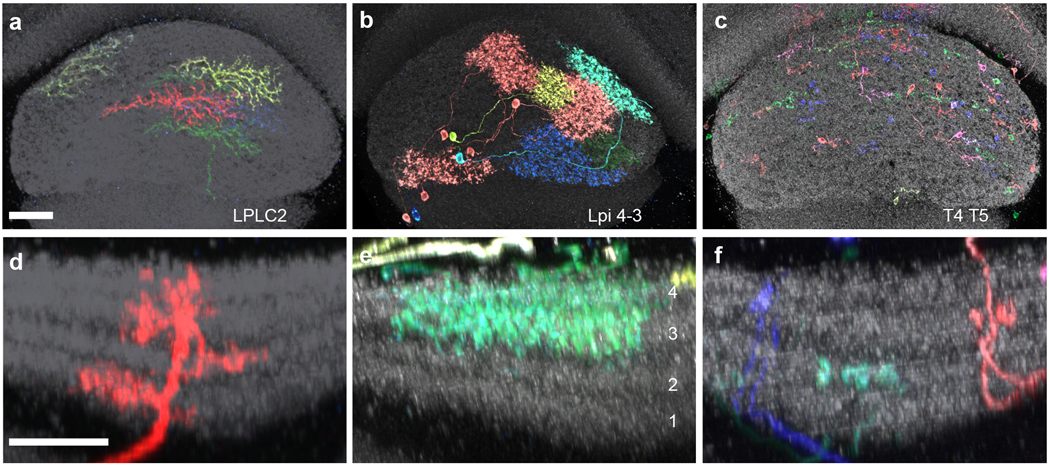
a-c, En face views of the LP from posterior show the spread of MCFO-labeled LPLC2 (a), LPi 4–3 (b), and T4/T5 (c) cells. Note the much larger spread of LPi cells compared to T4/T5 cells. Scale bars, 20 μm. d-f, LP layer pattern of LPLC2 (d), LPi4-3 (e), and T4/T5 cells (f). As previously described21, LPi cells project between layers with opposing T4/T5 preferred direction. Scale bar in d, 10 μm. Since LP depth is not uniform, images in d-f are shown at similar but slightly different scale to facilitate comparison of layer patterns between images. Anti-Brp is shown in grey.
Extended data figure 10: LPLC2 single-cell responses to null stimuli and looming motion.
a, Wide-field translational motion stimuli (20°/s edge speed, 10° bar size in all conditions except pure edge motion). Individual neuron in grey, population average in black. n = 10 neurons from 7 flies. b, Constant edge velocity (10°/s) disk expansion (60° to 80°) at various distances between disk center and receptive field center (each blue circle represents a different neuron, n = 40 neurons, N = 7 flies). c, Paired comparison for off-centered disk expansion (ɑ > 5°, 60° to 80° disk diameter) versus on-centered disk expansion (ɑ < 5°, 5° to 20° disk diameter). The off-centered disk expansion is from b; the on-centered disk expansion is the peak response from receptive field center mapping (as depicted in Fig. 3b–d). Paired t-test two-sided. **** P < 0.0001. d-e, Constant approach-velocity looming. Individual neurons in grey, population average in black. Tuning curve is population mean and 95% CI. n = 10 neurons, N = 7 flies. f, Representative traces from a single LPLC2 neuron in response to different types of dark edge motion. Left panel: outward edge motion along a single cardinal direction (left) or 15° offset from the cardinal axis (right). Cardinal axis denoted with a single green line. Middle panel: dark edge motion (left) and off-center disk expansion (right) on the order of receptive field size. Right panel: receptive-field-centered disk expansions from an initial diameter of 5° to a final diameter of 20° (left) or 60° (right).
Supplementary Material
ACKNOWLEDGEMENTS
We thank the Janelia FlyLight Project Team for help with brain dissections, histology and confocal imaging, Janelia Scientific Computing for image processing and data analysis tools, the Janelia FlyLight Project Team, Ming Wu and Teri Ngo for help with split-GAL4 screening, Heather Dionne for split-GAL4 molecular biology, and Eyal Gruntman for feedback on stimulus design. We thank Janelia Instrument Design and Fabrication and Vidrio Technologies for advice and help with the two-photon microscope setup. We thank Shigehiro Namiki and the Janelia Descending Interneuron Project for the empty split-GAL4 line. We also thank Karel Svoboda, Amy Chuong, and members of the Card and Reiser laboratories for helpful discussions and comments on the manuscript. This work was supported by the Howard Hughes Medical Institute.
Footnotes
The authors declare no competing financial interests.
REFERENCES
- 1.Barlow HB Summation and inhibition in the frog’s retina. The Journal of physiology 119, 69–88 (1953). [DOI] [PMC free article] [PubMed] [Google Scholar]
- 2.Lettvin JY, Maturana HR, McCulloch WS & Pitts WH What the frog’s eye tells the frog’s brain. Proceedings of the IRE 47, 1940–1951 (1959). [Google Scholar]
- 3.Hubel DH & Wiesel TN Receptive fields, binocular interaction and functional architecture in the cat’s visual cortex. The Journal of physiology 160, 106–154 (1962). [DOI] [PMC free article] [PubMed] [Google Scholar]
- 4.Gibson JJ Visually controlled locomotion and visual orientation in animals. British journal of psychology 49, 182–194 (1958). [DOI] [PubMed] [Google Scholar]
- 5.O’Shea M & Williams J The anatomy and output connection of a locust visual interneurone; the lobular giant movement detector (LGMD) neurone. Journal of Comparative Physiology A: Neuroethology, Sensory, Neural, and Behavioral Physiology 91, 257–266 (1974). [Google Scholar]
- 6.Wang Y & Frost BJ Time to collision is signalled by neurons in the nucleus rotundus of pigeons. Nature 356, 236–238, doi: 10.1038/356236a0 (1992). [DOI] [PubMed] [Google Scholar]
- 7.de Vries SE & Clandinin TR Loom-sensitive neurons link computation to action in the Drosophila visual system. Current biology : CB 22, 353–362, doi: 10.1016/j.cub.2012.01.007 (2012). [DOI] [PMC free article] [PubMed] [Google Scholar]
- 8.Dunn TW et al. Neural Circuits Underlying Visually Evoked Escapes in Larval Zebrafish. Neuron 89, 613–628, doi: 10.1016/j.neuron.2015.12.021 (2016). [DOI] [PMC free article] [PubMed] [Google Scholar]
- 9.Peek MY & Card GM Comparative approaches to escape. Current opinion in neurobiology 41, 167–173, doi: 10.1016/j.conb.2016.09.012 (2016). [DOI] [PubMed] [Google Scholar]
- 10.Wu M et al. Visual projection neurons in the Drosophila lobula link feature detection to distinct behavioral programs. eLife 5, doi: 10.7554/eLife.21022 (2016). [DOI] [PMC free article] [PubMed] [Google Scholar]
- 11.Maisak MS et al. A directional tuning map of Drosophila elementary motion detectors. Nature 500, 212–216, doi: 10.1038/nature12320 (2013). [DOI] [PubMed] [Google Scholar]
- 12.Takemura SY et al. A visual motion detection circuit suggested by Drosophila connectomics. Nature 500, 175–181, doi: 10.1038/nature12450 (2013). [DOI] [PMC free article] [PubMed] [Google Scholar]
- 13.Fischbach K-F & Dittrich A The optic lobe of Drosophila melanogaster. I. A Golgi analysis of wild-type structure. Cell and tissue research 258, 441–475 (1989). [Google Scholar]
- 14.von Reyn CR et al. A spike-timing mechanism for action selection. Nature neuroscience 17, 962–970, doi: 10.1038/nn.3741 (2014). [DOI] [PubMed] [Google Scholar]
- 15.Klapoetke NC et al. Independent optical excitation of distinct neural populations. Nature methods 11, 338–346, doi: 10.1038/nmeth.2836 (2014). [DOI] [PMC free article] [PubMed] [Google Scholar]
- 16.Nern A, Pfeiffer BD & Rubin GM Optimized tools for multicolor stochastic labeling reveal diverse stereotyped cell arrangements in the fly visual system. Proceedings of the National Academy of Sciences of the United States of America 112, E2967–2976, doi: 10.1073/pnas.1506763112 (2015). [DOI] [PMC free article] [PubMed] [Google Scholar]
- 17.Schilling T & Borst A Local motion detectors are required for the computation of expansion flow-fields. Biology open 4, 1105–1108, doi: 10.1242/bio.012690 (2015). [DOI] [PMC free article] [PubMed] [Google Scholar]
- 18.Seelig JD et al. Two-photon calcium imaging from head-fixed Drosophila during optomotor walking behavior. Nature methods 7, 535–540, doi: 10.1038/nmeth.1468 (2010). [DOI] [PMC free article] [PubMed] [Google Scholar]
- 19.Chen TW et al. Ultrasensitive fluorescent proteins for imaging neuronal activity. Nature 499, 295–300, doi: 10.1038/nature12354 (2013). [DOI] [PMC free article] [PubMed] [Google Scholar]
- 20.Strother JA et al. The Emergence of Directional Selectivity in the Visual Motion Pathway of Drosophila. Neuron 94, 168–182 e110, doi: 10.1016/j.neuron.2017.03.010 (2017). [DOI] [PubMed] [Google Scholar]
- 21.Mauss AS et al. Neural Circuit to Integrate Opposing Motions in the Visual Field. Cell 162, 351–362, doi: 10.1016/j.cell.2015.06.035 (2015). [DOI] [PubMed] [Google Scholar]
- 22.Fraser Rowell CH, O’Shea M & Williams JL The neuronal basis of a sensory analyser, the acridid movement detector system. IV. The preference for small field stimuli. The Journal of experimental biology 68, 157–185 (1977). [DOI] [PubMed] [Google Scholar]
- 23.Ishikane H, Kawana A & Tachibana M Short- and long-range synchronous activities in dimming detectors of the frog retina. Visual neuroscience 16, 1001–1014 (1999). [DOI] [PubMed] [Google Scholar]
- 24.Munch TA et al. Approach sensitivity in the retina processed by a multifunctional neural circuit. Nature neuroscience 12, 1308–1316, doi: 10.1038/nn.2389 (2009). [DOI] [PubMed] [Google Scholar]
- 25.Gabbiani F, Krapp HG, Koch C & Laurent G Multiplicative computation in a visual neuron sensitive to looming. Nature 420, 320–324, doi: 10.1038/nature01190 (2002). [DOI] [PubMed] [Google Scholar]
- 26.Peron S & Gabbiani F Spike frequency adaptation mediates looming stimulus selectivity in a collision-detecting neuron. Nature neuroscience 12, 318–326, doi: 10.1038/nn.2259 (2009). [DOI] [PMC free article] [PubMed] [Google Scholar]
- 27.Jones PW & Gabbiani F Synchronized neural input shapes stimulus selectivity in a collision-detecting neuron. Current biology : CB 20, 2052–2057, doi: 10.1016/j.cub.2010.10.025 (2010). [DOI] [PMC free article] [PubMed] [Google Scholar]
- 28.Woolsey TA & Van der Loos H The structural organization of layer IV in the somatosensory region (SI) of mouse cerebral cortex. The description of a cortical field composed of discrete cytoarchitectonic units. Brain research 17, 205–242 (1970). [DOI] [PubMed] [Google Scholar]
- 29.von Reyn CR et al. Feature Integration Drives Probabilistic Behavior in the Drosophila Escape Response. Neuron 94, 1190–1204 e1196, doi: 10.1016/j.neuron.2017.05.036 (2017). [DOI] [PubMed] [Google Scholar]
- 30.Jenett A et al. A GAL4-driver line resource for Drosophila neurobiology. Cell reports 2, 991–1001, doi: 10.1016/j.celrep.2012.09.011 (2012). [DOI] [PMC free article] [PubMed] [Google Scholar]
- 31.Kvon EZ et al. Genome-scale functional characterization of Drosophila developmental enhancers in vivo. Nature 512, 91–95, doi: 10.1038/nature13395 (2014). [DOI] [PubMed] [Google Scholar]
- 32.Pfeiffer BD et al. Refinement of tools for targeted gene expression in Drosophila. Genetics 186, 735–755, doi: 10.1534/genetics.110.119917 (2010). [DOI] [PMC free article] [PubMed] [Google Scholar]
- 33.Hampel S, Franconville R, Simpson JH & Seeds AM A neural command circuit for grooming movement control. eLife 4, e08758, doi: 10.7554/eLife.08758 (2015). [DOI] [PMC free article] [PubMed] [Google Scholar]
- 34.Aso Y et al. The neuronal architecture of the mushroom body provides a logic for associative learning. eLife 3, e04577, doi: 10.7554/eLife.04577 (2014). [DOI] [PMC free article] [PubMed] [Google Scholar]
- 35.Wagh DA et al. Bruchpilot, a protein with homology to ELKS/CAST, is required for structural integrity and function of synaptic active zones in Drosophila. Neuron 49, 833–844, doi: 10.1016/j.neuron.2006.02.008 (2006). [DOI] [PubMed] [Google Scholar]
- 36.Iwai Y et al. Axon patterning requires DN-cadherin, a novel neuronal adhesion receptor, in the Drosophila embryonic CNS. Neuron 19, 77–89 (1997). [DOI] [PubMed] [Google Scholar]
- 37.Peng H, Ruan Z, Long F, Simpson JH & Myers EW V3D enables real-time 3D visualization and quantitative analysis of large-scale biological image data sets. Nature biotechnology 28, 348–353, doi: 10.1038/nbt.1612 (2010). [DOI] [PMC free article] [PubMed] [Google Scholar]
- 38.Wan Y, Otsuna H, Chien CB & Hansen C FluoRender: An Application of 2D Image Space Methods for 3D and 4D Confocal Microscopy Data Visualization in Neurobiology Research. IEEE Pacific Visualization Symposium : [proceedings]. IEEE Pacific Visualisation Symposium, 201–208 (2012). [DOI] [PMC free article] [PubMed] [Google Scholar]
- 39.Strother JA, Nern A & Reiser MB Direct observation of ON and OFF pathways in the Drosophila visual system. Current biology : CB 24, 976–983, doi: 10.1016/j.cub.2014.03.017 (2014). [DOI] [PubMed] [Google Scholar]
- 40.Franceschini N & Kirschfeld K Les phénomènes de pseudopupille dans l’oeil composé deDrosophila. Kybernetik 9, 159–182 (1971). [DOI] [PubMed] [Google Scholar]
- 41.Pologruto TA, Sabatini BL & Svoboda K ScanImage: flexible software for operating laser scanning microscopes. Biomedical engineering online 2, 13, doi: 10.1186/1475-925X-2-13 (2003). [DOI] [PMC free article] [PubMed] [Google Scholar]
- 42.Wilson RI, Turner GC & Laurent G Transformation of olfactory representations in the Drosophila antennal lobe. Science 303, 366–370, doi: 10.1126/science.1090782 (2004). [DOI] [PubMed] [Google Scholar]
- 43.Gabbiani F, Krapp HG & Laurent G Computation of object approach by a wide-field, motion-sensitive neuron. The Journal of neuroscience : the official journal of the Society for Neuroscience 19, 1122–1141 (1999). [DOI] [PMC free article] [PubMed] [Google Scholar]
- 44.Schneider CA, Rasband WS & Eliceiri KW NIH Image to ImageJ: 25 years of image analysis. Nature methods 9, 671–675 (2012). [DOI] [PMC free article] [PubMed] [Google Scholar]
Associated Data
This section collects any data citations, data availability statements, or supplementary materials included in this article.
Supplementary Materials
Data Availability Statement
All imaging data and analysis code are available upon reasonable request from the authors. Representative image stacks used for anatomical analyses are available from http://splitgal4.janelia.org/cgi-bin/splitgal4.cgi


