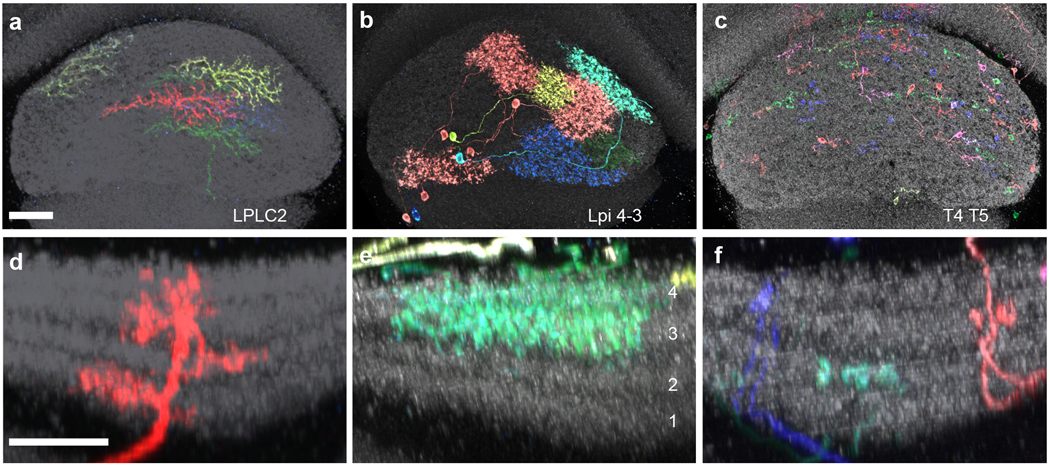
Extended data figure 9: Size and layer pattern of LPLC2 cells and putative inputs to LPLC2 dendrites.

a-c, En face views of the LP from posterior show the spread of MCFO-labeled LPLC2 (a), LPi 4–3 (b), and T4/T5 (c) cells. Note the much larger spread of LPi cells compared to T4/T5 cells. Scale bars, 20 μm. d-f, LP layer pattern of LPLC2 (d), LPi4-3 (e), and T4/T5 cells (f). As previously described21, LPi cells project between layers with opposing T4/T5 preferred direction. Scale bar in d, 10 μm. Since LP depth is not uniform, images in d-f are shown at similar but slightly different scale to facilitate comparison of layer patterns between images. Anti-Brp is shown in grey.
