Summary
Adverse events (AEs) from chronically administered oral agents treating hematologic malignancies may affect patients’ ability to tolerate treatment over time. Conventional toxicity tables emphasizing incidence of high grade AEs do not provide information on AE time profile or reflect continuous lower grade symptomatic toxicities that are particularly relevant to treatment tolerability for patients living with indolent disease. Modernized approaches to toxicity evaluation and reporting that capture tolerability of treatment to the patient are imperative. We performed a focused, pilot longitudinal Toxicity over Time (ToxT) analysis of AEs from lenalidomide and lenalidomide with rituximab in CALGB 50401 (Alliance) (NCT 00238238) to define AE trajectory and quantify burden of continuous low grade events in patients with follicular lymphoma. ToxT analyses provided clinically relevant descriptions of neutropenia and fatigue trajectory from lenalidomide that were not identified by standard maximum grade CTCAE analysis. Evaluation of tolerability is increasingly relevant for hematologic malignancies treated with chronically administered therapies.
Introduction
Chronically administered oral targeted agents or immunomodulatory drugs are increasingly incorporated in the treatment of hematologic malignancies.(1) The toxicity profile of these agents is starkly different than that of conventional intravenous cytotoxic chemotherapies.(2) Tables of high grade adverse events (AEs) according to the National Cancer Institute Common Terminology Criteria for Adverse Events (NCI CTCAE)(3) report the most severe grades and are important for safety assessment. A multi-stakeholder group of patients, clinicians, clinical investigators, regulators and industry collaborators recently proposed a comprehensive consensus definition of tolerability as “the degree to which symptomatic and non-symptomatic adverse events associated with a product’s administration affect the ability or desire of a patient to adhere to the dose or intensity of therapy.”(4) Due to advances in clinical and translational research across the spectrum of hematologic malignancies, there has been a remarkable proliferation of novel agents used to treat these diseases. Many newer treatments, such as targeted agents and immunotherapies, are chronically administered, and demonstrate unprecedented improvements in response rate and disease outcomes in clinical trials across a variety of hematologic malignancies. However, if a real world patient is not able or willing to take the drug because it is intolerable, the benefit to that patient is zero.
Tolerability is a patient-centered, multidimensional, messy construct that integrates information about drug or regimen safety, but is distinct from safety, and is not intended to replace it.(1) By necessity, understanding tolerability requires the patient’s perspective (subjective information) along with information about dose reductions or delays (objective information). Tolerability can vary given a clinical context (frontline curative intent aggressive therapy, versus 6th line palliative therapy, for example). Lastly, tolerability is related to therapy duration and time profile of AEs and, thus, time-dependent metrics are necessary to understand it.(5) Despite inherent challenges in measurement and lack of consensus approaches, tolerability is essential to assess in modern hematology trials.
What is the main problem?
The current standard for reporting adverse events in clinical trials of novel agents or combinations used to treat cancer is a table that depicts the incidence of severe or life-threatening events. While vital to the assessment of safety, the static “maximum grade” conventional toxicity table does not reflect treatment tolerability. It provides little information on AE trajectory or burden of continuous low grade events (defined as grade 1 [mild] or grade 2 [moderate]) toxicity), which are highly relevant to patients with indolent disease who may receive newer treatments for months to years at a time.(5) For example, grade 2 fatigue is not relieved by rest and limits instrumental activities of daily living. Grade 2 diarrhea signifies an increase of 4–6 bowel movements over baseline. Chronic or continuous occurrence of such AEs may be limiting to a patient over time, and may affect their willingness or ability to receive ongoing treatment. There is typically no information about trajectory, differences between arms, the number of patients providing assessments at each time point, or burden of lower grade events. Reductive language in publications and presentations which display only maximum grade toxicity tables and describe novel agents or combinations as “generally well tolerated” is ambiguous and often misleading.(6) Novel metrics that comprehensively depict a drug’s toxicity profile over time and its tolerability are relevant to patients and providers, clinical investigators and industry stakeholders involved in drug development, and regulatory agencies involved in approval of new drugs.(1) Depicting AE time profile and reflecting the impact of chronic low grade AEs is a vital aspect of tolerability assessment.
Statistical complexity, heterogeneity, and challenges of clinical interpretability have limited broad application of existing longitudinal techniques for AE summarization.(7–9) Simpler methods reducing AE data to a single score have been developed, some with the goal of weighting toxicity in value frameworks or providing summary metrics, lack valuable information about tolerability and time profile(10). There is a dearth of data on longitudinal toxicity analysis and its potential relevance to the evaluation of treatment tolerability. We developed a clinically focused approach to AE analysis, the Toxicity over Time (ToxT), a standardized package of graphical and analytical assessments that depicts AEs over time to complement standard CTCAE maximum grade reporting. We previously applied ToxT to trials in gastrointestinal cancer and symptom control.(11) The novelty of the approach is viewing CTCAE information graphically and longitudinally, providing number of patients with assessments at each time point, capturing the impact of chronic low grade toxicity and highlighting differences between arms or trajectory, all with the goal of displaying interpretable AE data that is relevant to tolerability. This is the first application of ToxT to a randomized, multicenter National Cancer Institute (NCI) National Clinical Trials Network (NCTN) clinical trial of a chronically-administered oral agent for the treatment of a hematologic malignancy. This trial was selected because patients in both arms were treated with the chronically administered immunonmodular lenalidomide, and agent used to treat lymphoma and myeloma, sometimes for months to years at a time, for which we lack systematically presented information about AEs over time. In this case study, we investigated whether longitudinal AE analysis could provide important, distinct information on the adverse effect profile and tolerability of lenalidomide and characterize the trajectory and burden of neutropenia and fatigue on this drug.
Case study of Alliance (CALGB) 50401: Tolerability of lenalidomide
Methods
Cancer and Leukemia Group B (CALGB) 50401 is a randomized phase II trial for patients with recurrent follicular lymphoma.(12) CALGB is now part of the Alliance for Clinical Trials in Oncology (Alliance). The toxicity analysis sub-study reported here is Alliance A151617. Each participant signed and IRB-approved, protocol-specific informed consent document in accordance with federal and institutional guidelines. Patients aged ≥ 18 years, with follicular lymphoma grade 1, 2 or 3a, Eastern Cooperative Oncology Group Performance Status 0–2 and prior treatment with rituximab either alone or in combination with chemotherapy were eligible. Patients were randomized 2:1:1 to rituximab (R; n=3), lenalidomide (L; n=48 [n=45 initiated treatment]) or the combination (LR; n=46). Rituximab was given at standard doses weekly for four weeks in the first cycle only in the R and LR arms, which is standard practice when treating an indolent lymphoma. The rituximab only arm closed early due to poor accrual with only 3 patients, and is not included in this analysis. Lenalidomide in the L and LR arms was administered at a dose of 15 mg (cycle 1) or 20 mg (cycle 2 and beyond) per day on days 1–21 of a 28-day cycle, for a total of 12 cycles. One hematologic (neutropenia) and one symptomatic (fatigue) AE were selected for this pilot analysis due their high incidence and their clinical relevance. Thrombocytopenia also demonstrated high incidence, but almost all events were low grade and as a laboratory AE, this was not of clinical significance. As such, neutropenia, with high incidence overall as well as several grade 3–4 events, was preferred for analysis. Growth factor support with G-CSF, GM-CSF or peg-filgrastim was recommended only for patients with febrile neutropenia per protocol.
In this clinical trial, AE data were collected on case report forms during treatment. Statistical analysis incorporated all reported AE data during treatment as the reported grade. If no event was reported, a grade of 0 was assumed to have occurred per standard AE analytic approaches. The maximum observed grade per AE per patient is calculated and summarized using a frequency and proportion per group (e.g., per arm).
ToxT is a collection of statistical codes in SAS software (Cary, NC)(13) that generates plots depicting summary statistics or individual patient data over discrete time points combined with longitudinal statistical analyses (repeated measures modeling, time-to-event and area-under-curve [AUC] analyses). Bar charts depict the frequency and proportion of each grade level for a given AE across patients by cycle (one bar per cycle per group; if multiple grades were reported for a given patient for a cycle, the maximum grade was used for the cycle). Stream plots depict the mean grade level for a given AE across patients by cycle (one line per AE per group; if multiple grades were reported for a given patient for a cycle, the maximum grade was used for the cycle). A patient was included in the denominator of all cycles for the purpose of calculating proportions until discontinuing all treatment, at which point the patient would no longer be included in the denominator. Time-to-event bar charts computed time to onset and time to worst grade as medians over observed event times among patients who had the event without censoring. In other words, time to onset was computed as the median of the onset times across all patients who experienced the given AE. Time to worst grade was computed as the median of the times to worst grade across all patients who experienced the given AE. If a patient’s worst grade occurred multiple times, the earliest occurrence was used in calculating the median. To estimate the proportion with grade 2 or higher AEs incorporating censoring, a Kaplan-Meier approach was also used for each AE and time was computed as time to the earliest cycle that the patient reported experiencing a grade 2 event. AUC is a summary measure that can be calculated at a group level or at a patient level. At a group level, the AUC is calculated using the trapezoidal rule as the area under the line when connecting the group level mean AE grades at each cycle (i.e., area under the stream plot). At the individual level, the AUC can also be calculated for each individual patient as the area under the line when connecting the AE grades while the patient was on treatment and prorated for number of cycles, producing a single number that captures burden of chronic low grade events. We compared individual level AUCs (a single number computed for each patient) between arms using box plots to assess whether the distribution of AUCs differed between arms. Details of the statistical and further graphical approaches of ToxT are described elsewhere.(11) ToxT analyses and the resultant graphical representations reflect the first 9 cycles on this study, due to limitations of sample size (15 or less) in each arm thereafter. The ToxT macros are publically available to academic collaborators by contacting the corresponding author.
Results
Standard CTCAE analysis identified neutropenia and fatigue as the most common AEs >grade 3 on L and LR (16% v 20% for fatigue, and 9% v 13% for neutropenia, respectively, Table 1). By ToxT, bar charts of incidence and grade per cycle to define the AE trajectory demonstrated a steady rise in neutropenia incidence and grade in both arms as treatment continued indicating that neutropenia is cumulative. Among patients who received LR (Figure 1 Panel A), only grade 1 neutropenia was reported in the first cycle (4/43 [9.3%]), whereas grade 2 and 3 were reported in later cycles (at cycle 9, 11/31[35.4%] with grade 1–3 neutropenia). Of note, only 1 patient (on L) received growth factor while on study treatment. In contrast, fatigue decreased in incidence and grade for patients in both arms over time (Figure 1 Panel B, 20/43[46.5%] grade 1–3 fatigue at cycle 1 versus 11/31[35.5%] grade 1 only at cycle 9 on LR). The stream plot of fatigue (Figure 2 Panel A) depicts decreasing mean grade of fatigue over time for both arms (mean across all grades including grade 0 was 0.8 and 0.7 on L and LR, respectively, at cycle 1 and drops to 0.4 and 0.4 by cycle 9). Conversely, the stream plot of neutropenia represents increasing mean grade over time for both arms (mean grades of 0.3 and 0.1 at cycle 1 and 0.9 and 0.5 by cycle 9 for L and LR, respectively). The time-to-event bar chart (Figure 3 Panel A) indicates that on LR, the onset and worst grade fatigue (median 8 days for both) among those reporting fatigue occurs early. In contrast, onset (median 57 days) and time to worst grade of neutropenia (median 86 days) occurs with prolonged therapy, affirming that neutropenia is a delayed onset AE that worsens over time. The time-to-grade 2+ fatigue analysis depicts time-to-grade 2+ fatigue with rates at cycle 2 (day 56) of 27% and 34% [p=0.32] for L vs LR, respectively. AUC analysis identified a similar burden of chronic low grade fatigue in both arms over time as can be visualized at the group level in Figure 4A, which is a representation of the fatigue stream plot with shading under the curve. When calculated at the group level in this manner, mean group AUC as computed as the shaded area in Figure 4A through cycle 9 was 4.8 and 4.6 on L and LR, respectively. AUC was also calculated on an individual patient basis. Mean individual AUC for fatigue was 5.3 and 4.9 [p=0.39] on L and LR, respectively, and is shown in the box plot in Figure 4B.
Table 1. Standard Maximum Grade Toxicity Table for CALGB 50401 (Alliance).
This table represents the standard approach to toxicity reporting, focusing strictly on the incidence of high grade adverse events occurring in > 1 patient.
| Adverse Event | Lenalidomide (n=45) | Lenalidomide + Rituximab (n=46) | ||
|---|---|---|---|---|
| Grade 3 | Grade 4 | Grade 3 | Grade 4 | |
| Lymphopenia | 1(2%) | 0 (0%) | 3 (7%) | 0 (0%) |
| Neutropenia | 7 (16%) | 0 (0%) | 7 (16%) | 2 (4%) |
| Thrombocytopenia | 0 (0%) | 0 (0%) | 2 (4%) | 0 (0%) |
| AST elevation | 2 (4%) | 0 (0%) | 0 (0%) | 0 (0%) |
| Fatigue | 4 (9%) | 0 (0%) | 5 (11%) | 1 (2%) |
| Thrombosis | 4 (9%) | 3 (7%) | 1 (2%) | 1 (2%) |
Figure 1. AE incidence and grade over time (bar charts).
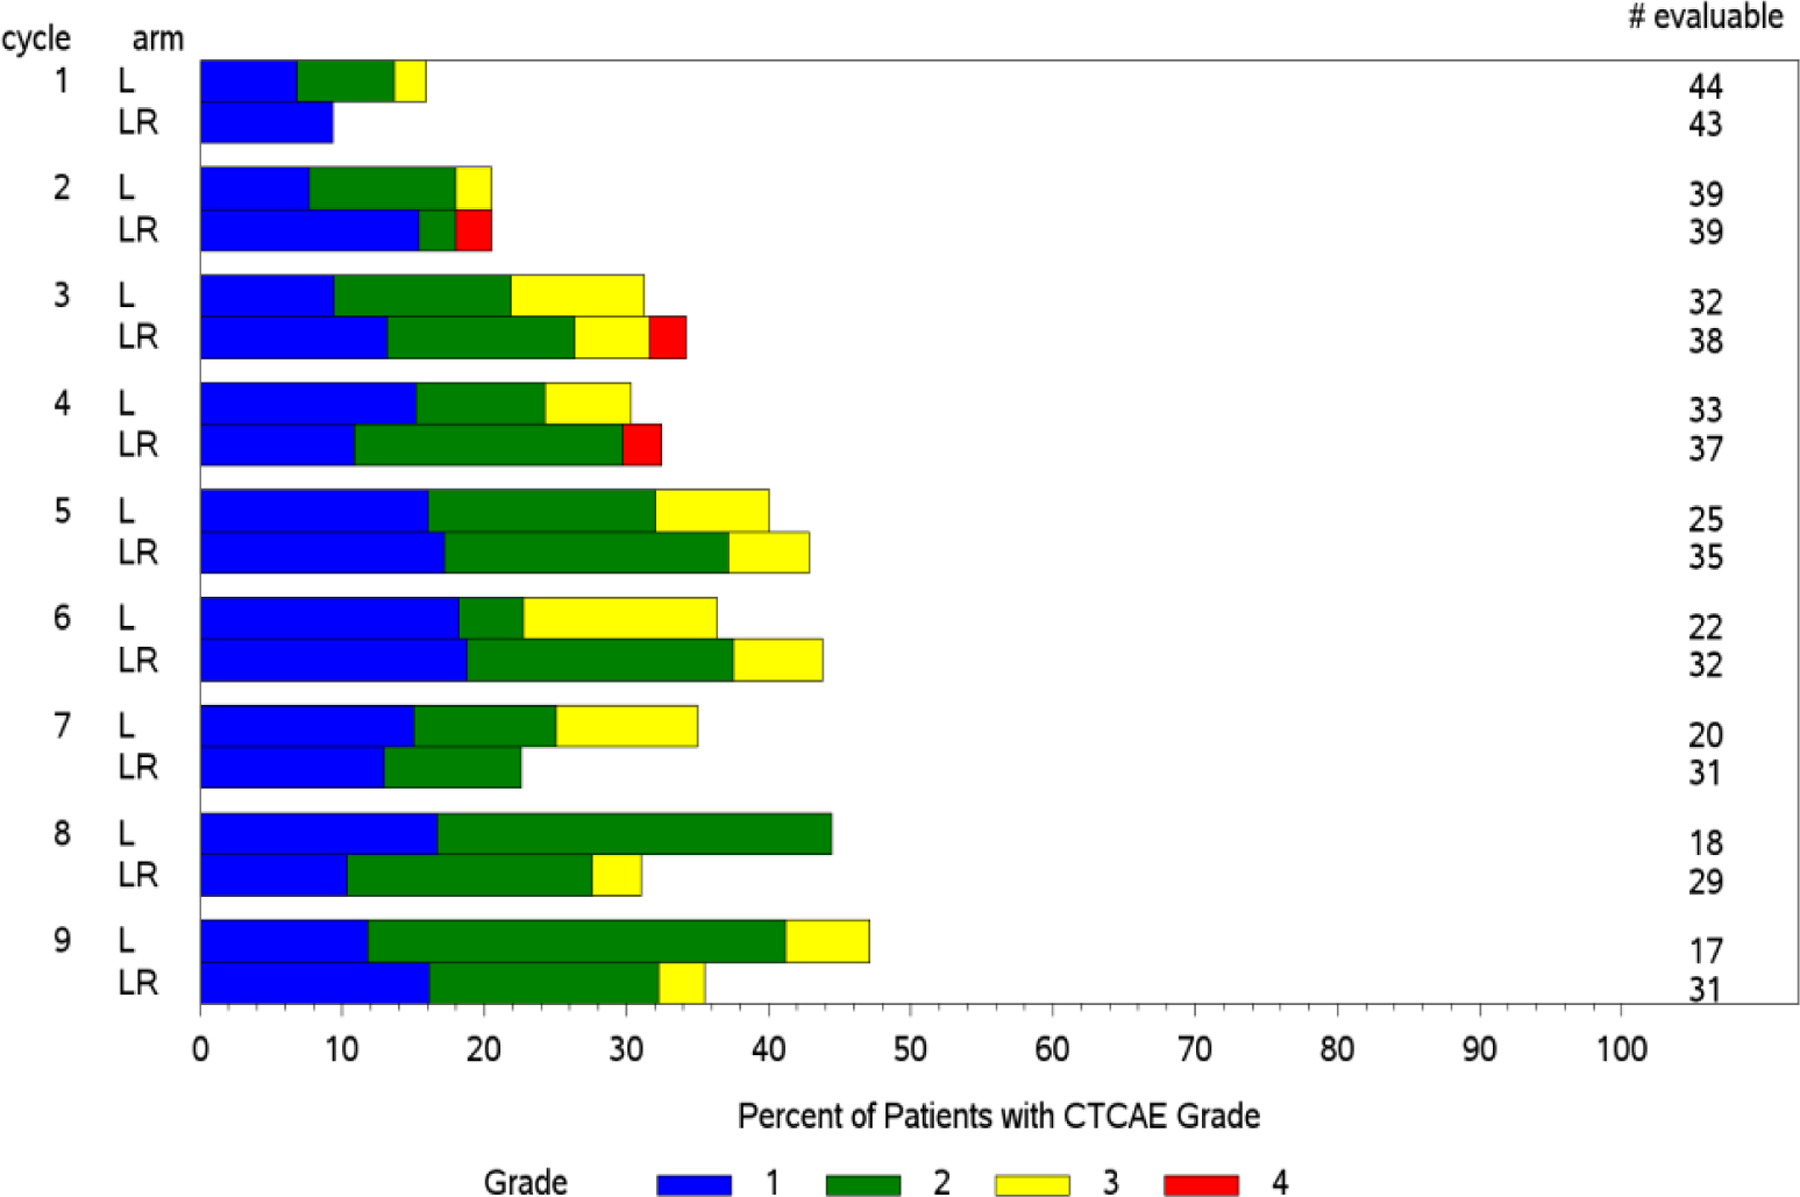
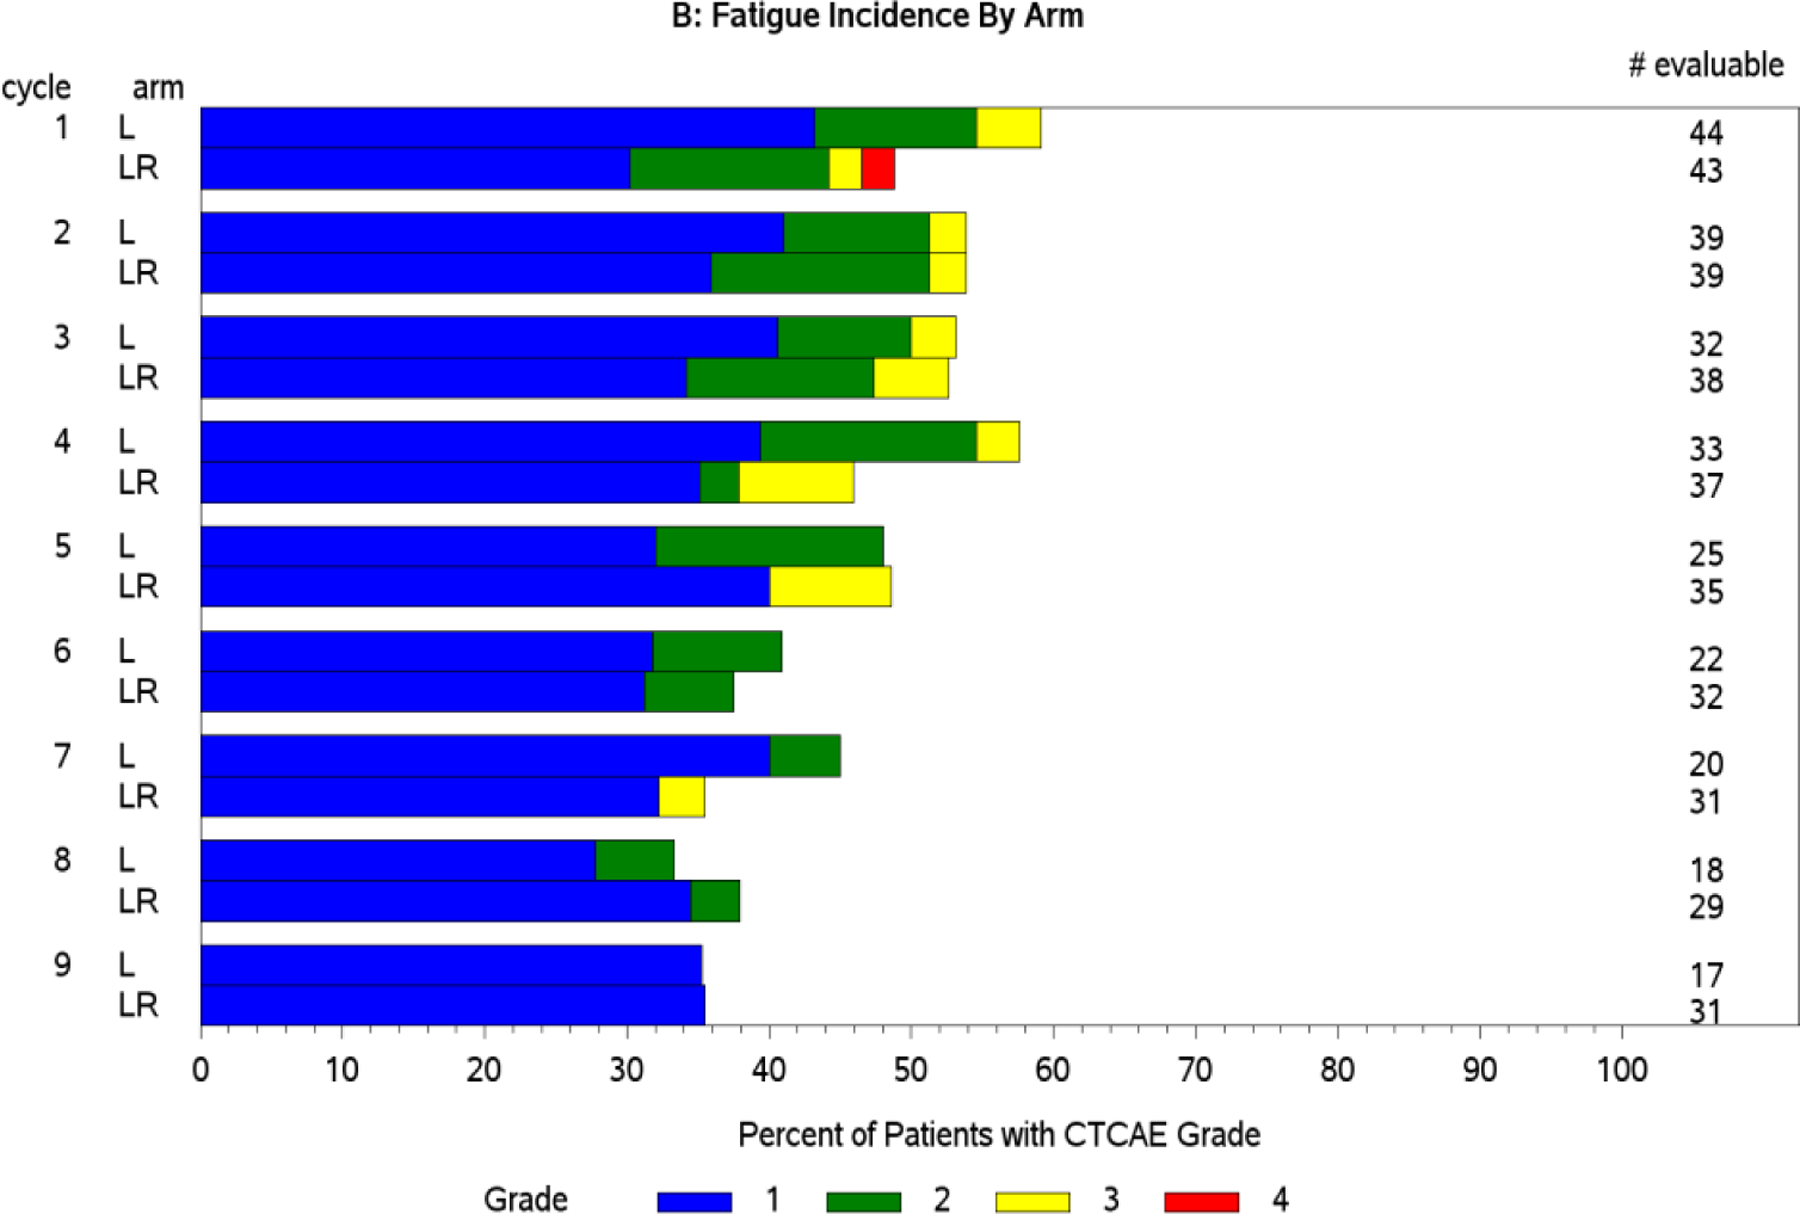
Panel A: Neutropenia worsens in incidence and grade over 9 cycles. Panel B: Conversely, fatigue improves in both incidence and grade over 9 cycles.
Figure 2. Mean AE grade trajectory (stream plots).
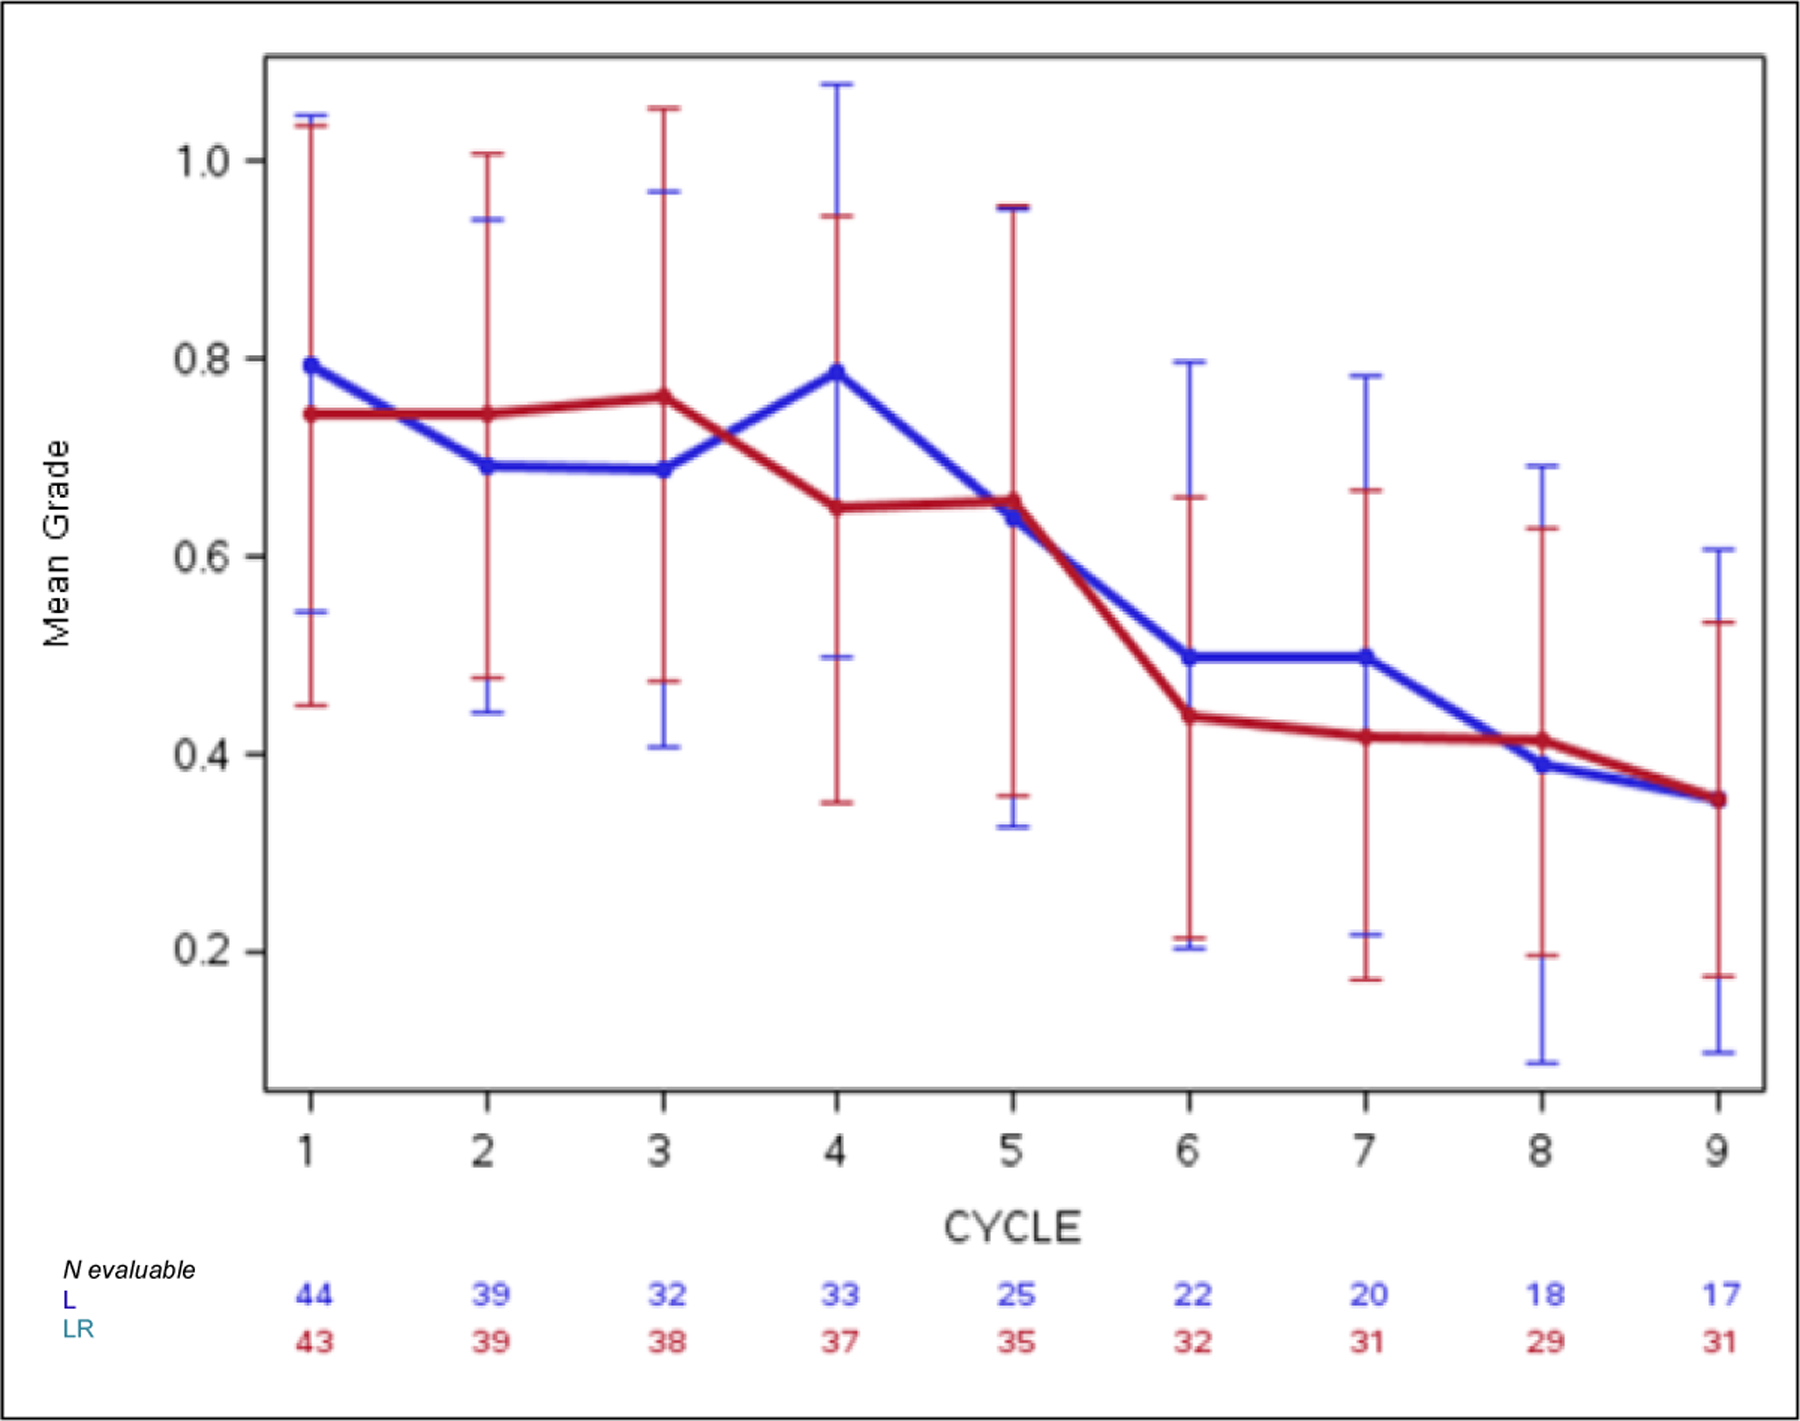
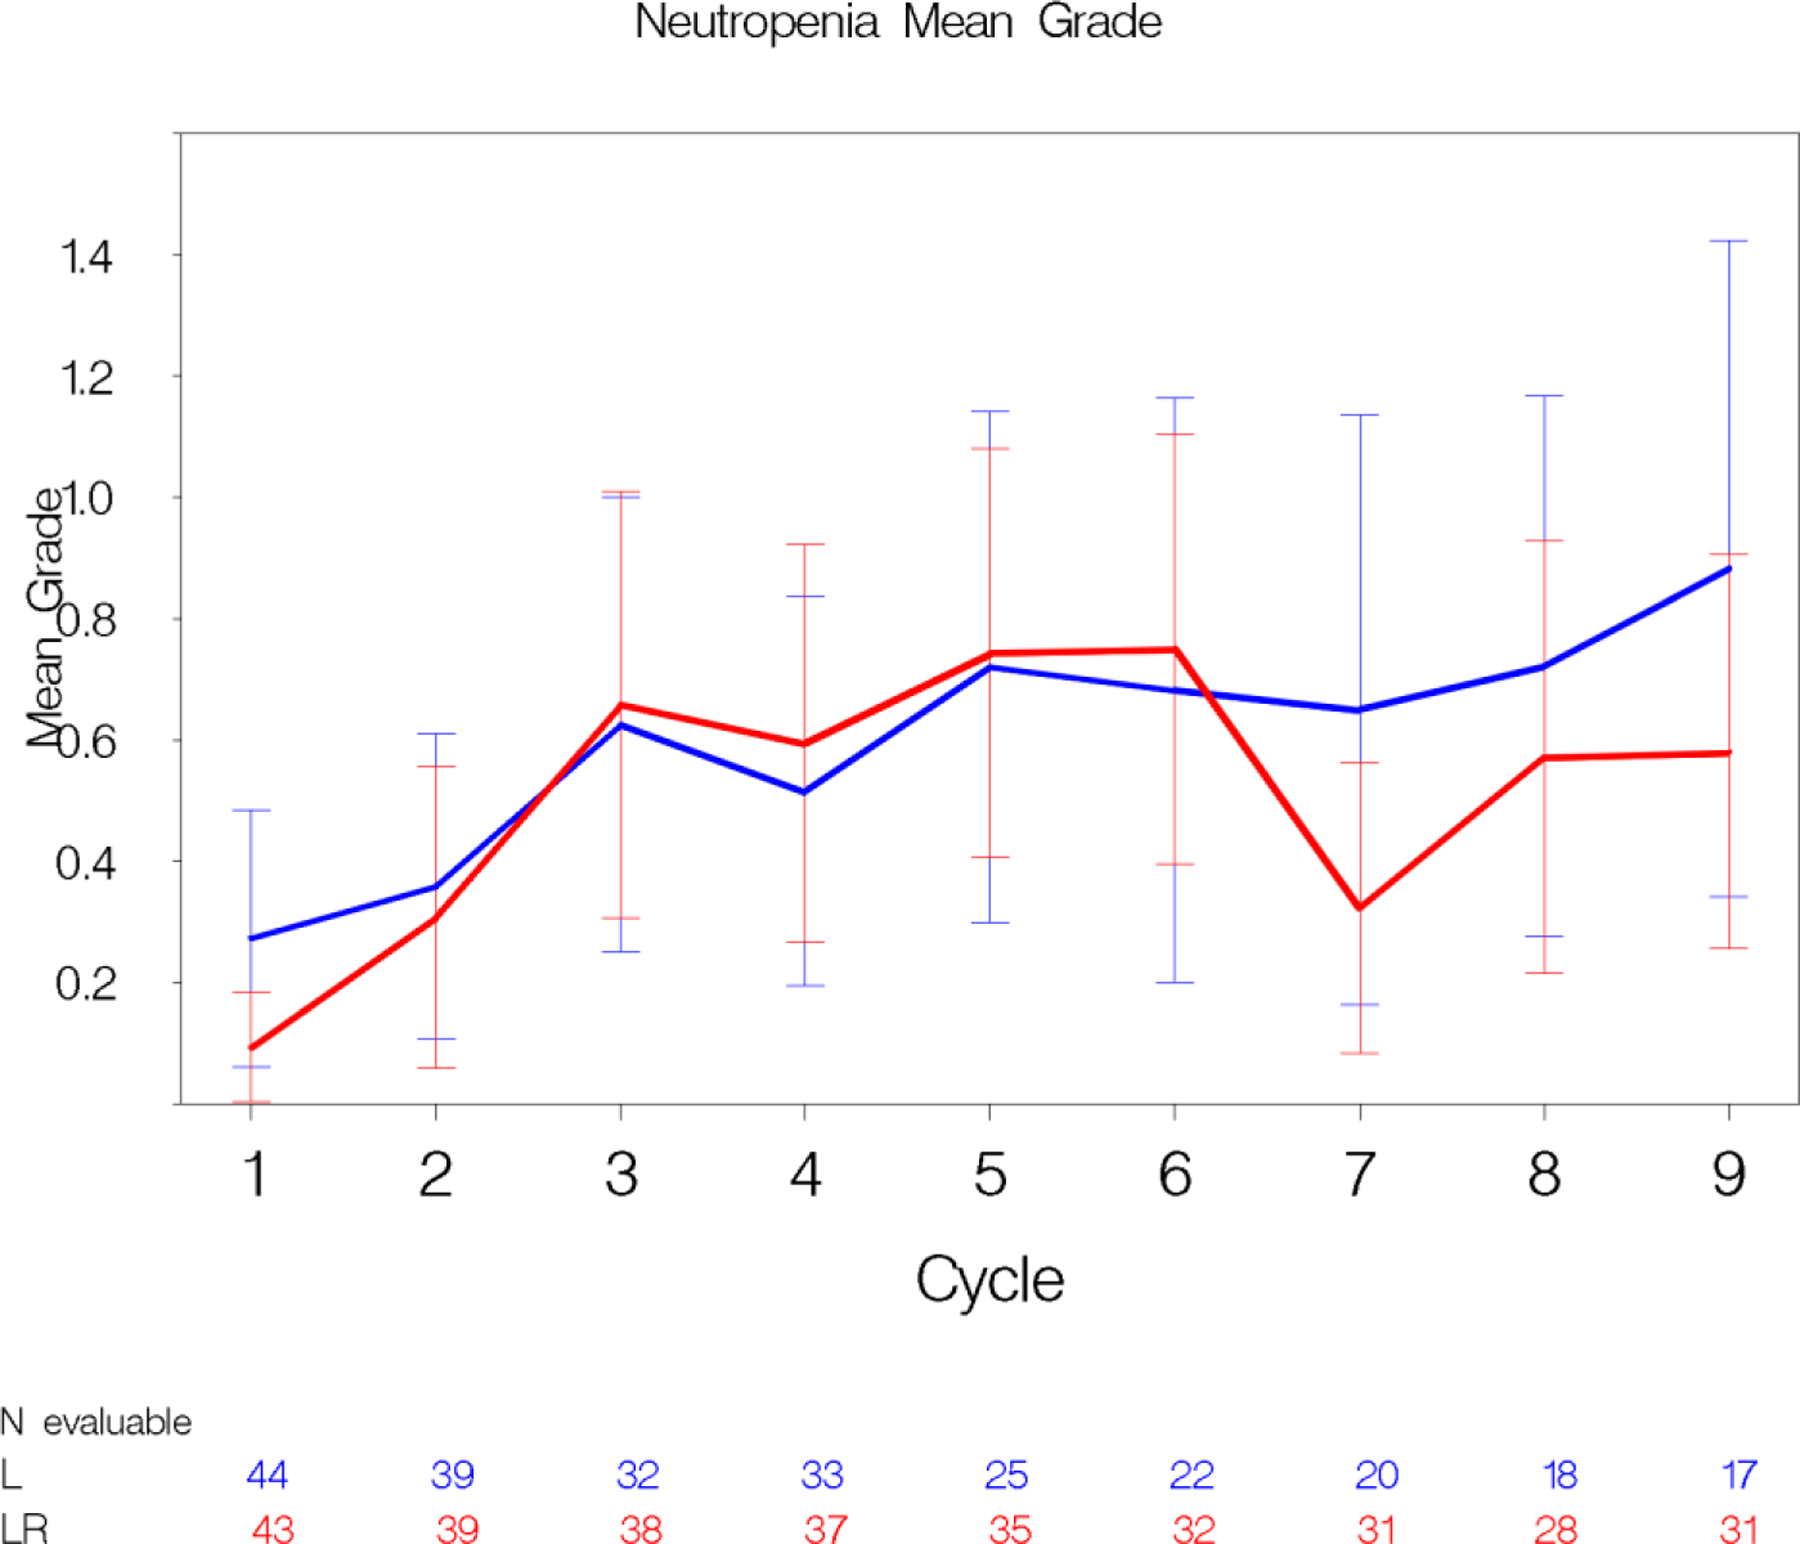
Panel A: This plot depicts the decreasing mean grade of fatigue over multiple cycles in both treatment arms. The whiskers represent the 95% confidence intervals for the means. 2 Panel B: Conversely, mean grade of neutropenia increases over multiple cycles in both treatment arms.
Figure 3. Time-to-AE analyses.

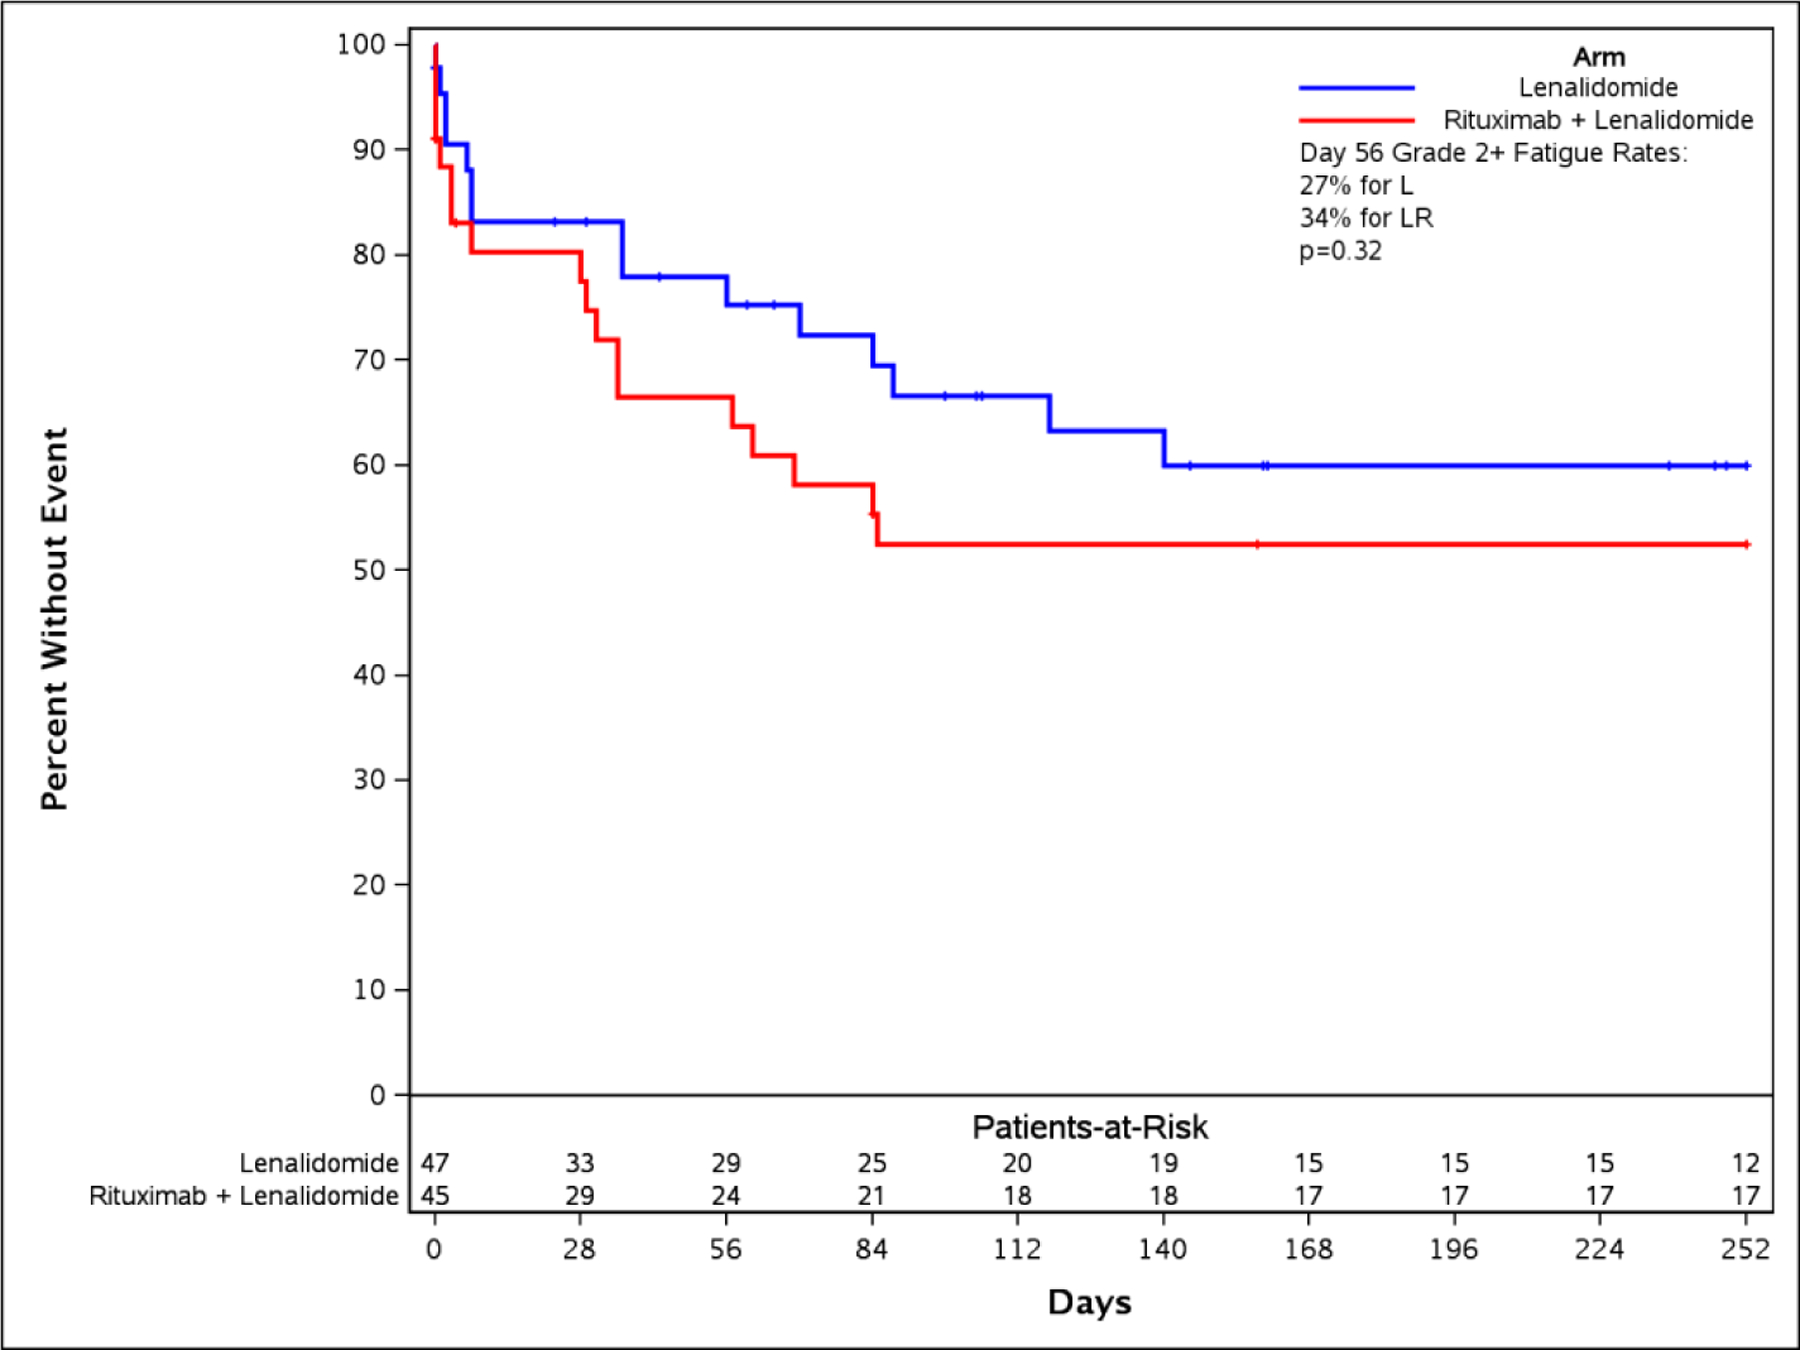
Panel A: The time to event bar chart depicts that first onset and worst grade of fatigue occur in under 10 days (early event). Neutropenia occurs late and worsens over time on drug. Panel B: A time-to-fatigue curve demonstrates patients on both arms had similar time to onset of grade 2+ fatigue
Figure 4. Capturing the burden of chronic symptomatic AEs: Alternate approaches to AUC calculation and visualization.
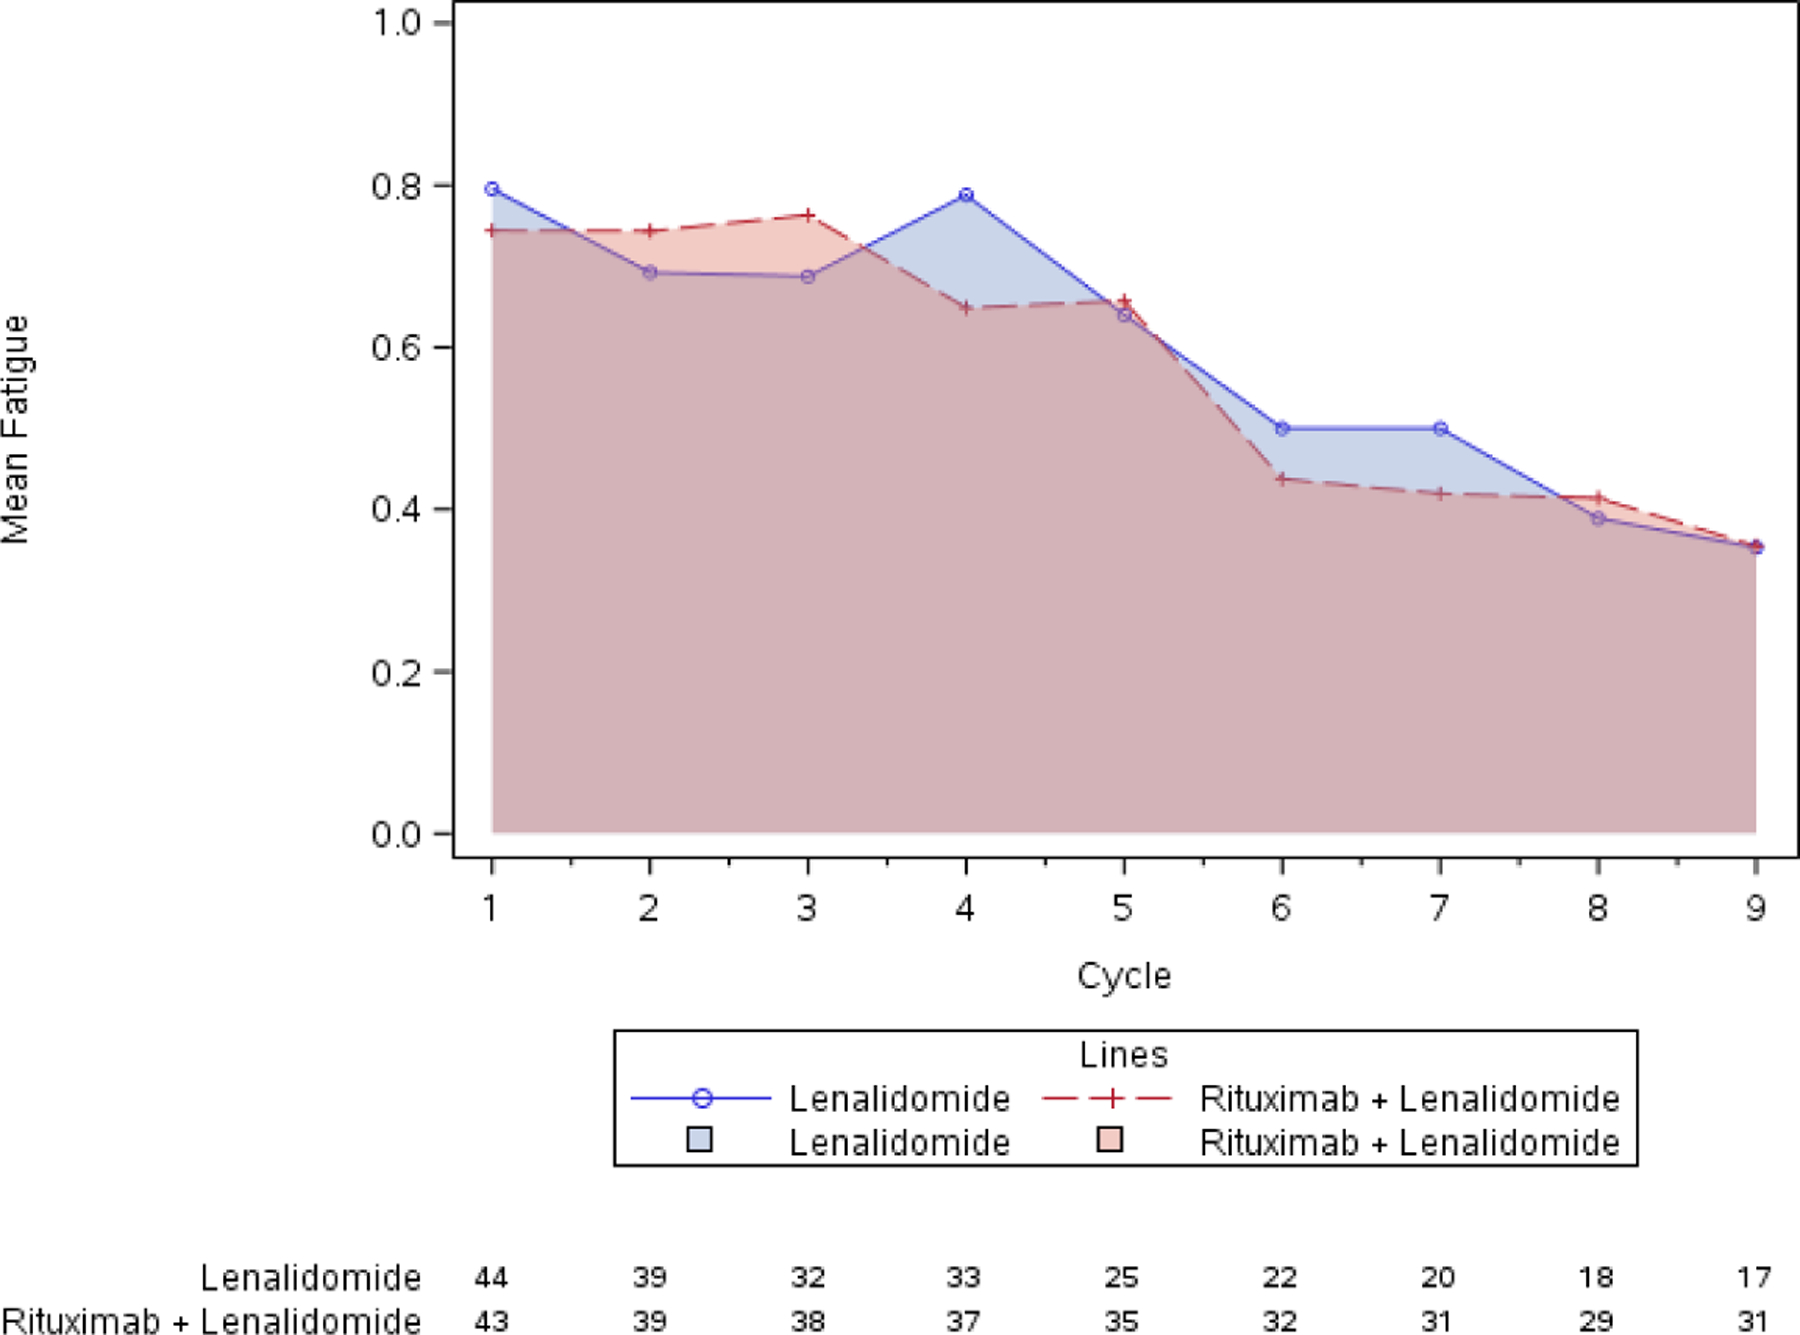
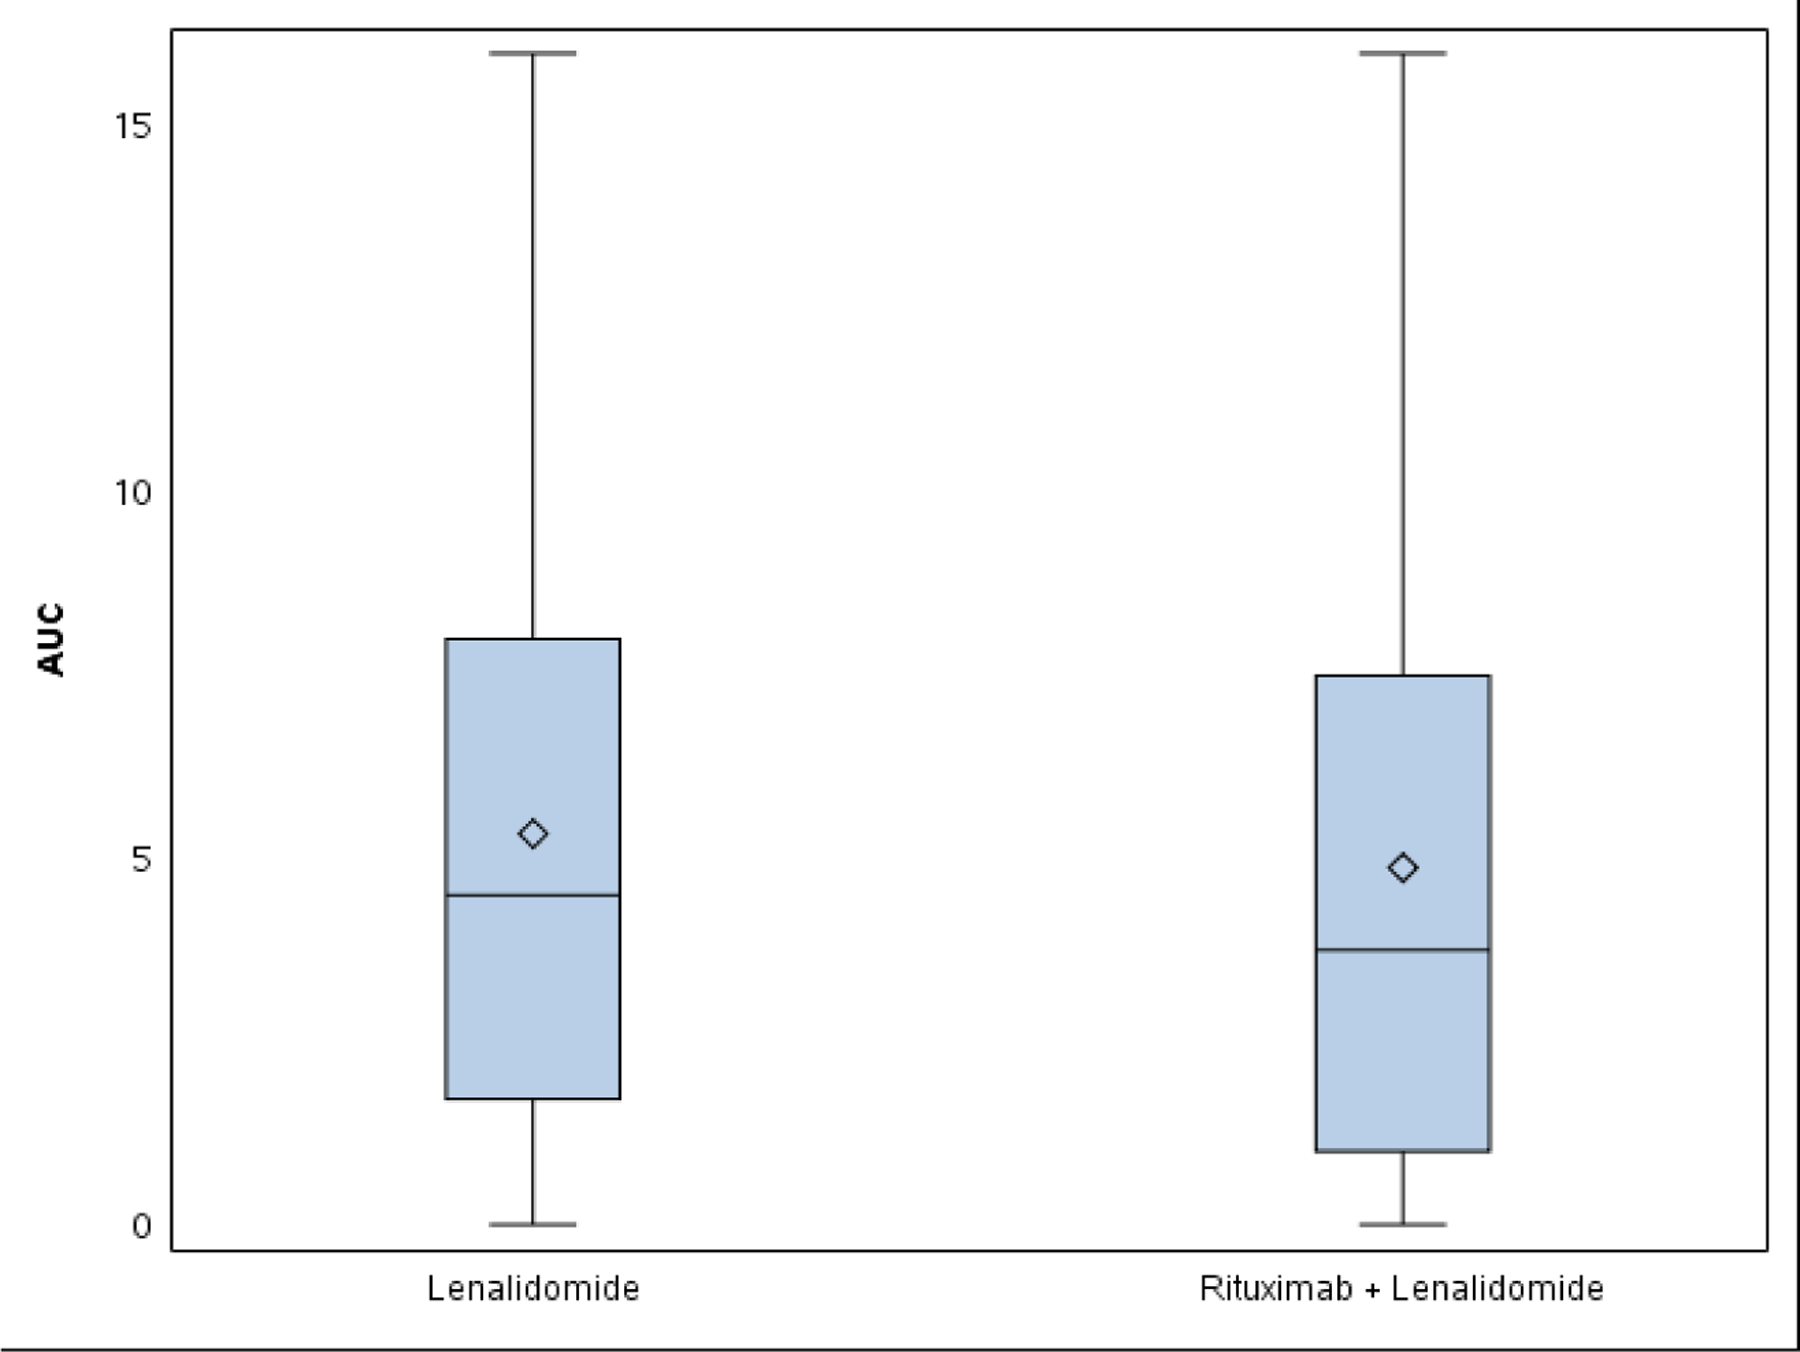
Panel A: Graphical visualization of group AUC for fatigue shows no clear difference between arms. AUC was 4.8 on lenalidomide (L) and 4.6 on lenalidomide plus rituximab (LR). Panel B: Mean individual AUC box-and-whisker plot. AUC was 5.3 on L and 4.9 on LR (p=0.39).
Discussion
This case study, a focused pilot longitudinal analysis of fatigue and neutropenia in CALGB 50401, demonstrates that longitudinal AE analysis with ToxT provides important, distinct information on the time profile of laboratory and symptomatic AEs of lenalidomide used to treat recurrent follicular lymphoma which is not captured in the standard toxicity table. Reporting the incidence of high grade events is necessary to establish safety of new treatments. However, novel metrics are needed to complement drug safety information and describe tolerability. AE trajectory, differences between arms, chronic low grade symptomatic AEs over time or number of patients providing assessments over time are crucial components of the comprehensive assessment of treatment tolerability. ToxT analysis in this study characterized the trajectory of neutropenia and fatigue on lenalidomide and captured the burden of chronic low grade fatigue, which may inform tolerability of this drug and others over time for patients with indolent disease on chronic therapy.
ToxT identified neutropenia as a cumulative AE, which worsens over time, implying that patients may not tolerate full dose over time due to neutrophil count, could be at increased risk for infections later on treatment, and may need growth factor support after months on therapy, rather than early on. Conversely, fatigue decreases over time, perhaps a reflection of patients’ improving tolerance of the AE over time. This information could reassure patients, and in the case of symptoms where a supportive care measure is available, it could guide timing of the symptom control intervention. An AUC summary measure can capture in a single number the impact of a low grade symptomatic toxicity that occurs for weeks, months or longer. Since lenalidomide was chronically administered in both arms over multiple cycles, AUC analyses were similar for both arms. However, this metric may be useful for discriminating among arms where burden is expected to differ.
In this study, multiple graphical approaches provided distinct but complementary information. Bar charts of incidence and grade over time can provide more comprehensive information on both laboratory and symptomatic toxicity over time. In the ToxT, these visualizations are shown with cycle on the y-axis to facilitate inclusion of multiple cycles. In some circumstances it may be preferred to have cycle on the x-axis showing passing of time from left to right, though space is often a limitation in journal publications.(14) We are currently modifying the ToxT macros to provide the option for either visualization approach, and future avenues for research include qualitative studies establishing the optimal representations for patients, clinicians, regulators and other stakeholders.
The stream plot demonstrates mean grade AE trajectories that provide straightforward visual comparison of arms. However, mean grade numbers are challenging to interpret clinically. For example, consider a scenario in which 20% of patients have a grade 4 event and the remainder having a grade 0 resulting in the mean grade of 0.8. This value cannot be directly interpreted relative to the discrete CTCAE scale(3). Means are intuitive for continuous measures such as qualify of life scores.(15) Displaying median grade over time may seem more intuitive when considering ordinal CTCAE grades. However, the median grade is the grade at which half the patients experienced a higher grade (and half experienced a lower grade). Thus, for even an AE (grade 1 or higher) occurring in at least 40% of patients (arguably a common side effect), the median grade would be a grade of 0. Stream plots of mean AE grade over time (as shown in Figure 2A for fatigue), on the other hand, do elucidate subtle trajectories over time that may be valuable to patients and clinicians even if mean AE grades potentially suffer from aforementioned issues. As each CTCAE grade level represents a different clinical scenario, the percentage of patients experiencing each CTCAE grade level may be clearer to interpret. The ToxT includes percentage of patients with a given grade to complement stream plots.
The ToxT provides an approach to capturing the burden of chronic low grade symptomatic AEs by using various AUC calculations. Our results demonstrate that, as expected, AUCs computed at the group and patient level for fatigue were similar across both arms, as the chronically administered agent (lenalidomide) was the same in both arms. However, the analysis and graphics shown here illustrate two potential approaches to AUC calculation that could be applied to studies where a difference may be anticipated or observed. An AUC can be calculated at the group level by computing a value for the shading under the mean AE trajectory. The accompanying graphical representation (Figure 4A) is intuitive, but is somewhat misleading, as this approach does not capture when individual patients went off study. In the presence of missing data and/or varying treatment durations, group level, mixed model based methods may be a more appropriate and accurate strategy.(16, 17) As such, we also presented a mean individual AUC, which is calculated for each individual patient and compared between arms via a box-and-whisker plot. This is a more granular approach, although the graphical representation may be less intuitive to clinicians and patients. Nonetheless, either approach captures in a single number the burden of a continuous symptomatic low grade AE over time which can be used to counsel patients. The impact of a persistent low grade symptomatic toxicity over time is highly relevant to tolerability of therapy for patients with indolent disease on chronic therapy.
Limitations of this case study include that CALGB 50401 was a randomized phase two study with 45 and 46 patients per arm, so sample size is a recognized limitation for this initial pilot analysis. Analysis was also limited to two AEs, and the small sample size in the latter cycles limits definitive statements. Lenalidomide was administered at the same dose and schedule in both arms and rituximab was only administered during the first cycle. Therefore, toxicity differences were expected to be minimal. It is reassuring that no differences were identified in comprehensive toxicity analysis when none were expected. The goal of this analysis was to pilot novel metrics for evaluating the longitudinal toxicity of profile of a chronically administered agent used to treat a hematologic malignancy, and not to identify differences between the treatment arms or explore all AEs in detail. Given the pilot data reported here, we are currently applying ToxT to evaluate of multiple AEs longitudinally in larger hematology trials comparing two (or more) distinct chronically administered agents in our forthcoming work.
A noteworthy limitation common to most clinical trials including this one is that CALGB 50401 (Alliance) assessed toxicity using CTCAE only, a grading system for adverse events by clinical providers. The patient perspective is a critical component of the tolerability assessment and by definition tolerability cannot be fully understood without patient reported outcome (PRO) toxicity data on symptomatic AEs.(4, 18–21) Multiple international groups are working toward establishing standards for reporting and analyzing PRO AE data(22–24). The US National Cancer Institute has established a U01 Consortium with the sole charge of exploring the best metrics of tolerability and includes multi-stakeholder input from patients, clinicians, investigators, regulators and industry. We are currently applying ToxT to both CTCAE and PRO toxicity data, including from the Patient-Reported Outcomes version of the CTCAE (PRO-CTCAE)(14, 25, 26). Systematic, rigorous incorporation of PRO in clinical trials in hematologic malignancies will be vital to our understanding of tolerability of treatment for patients. Longitudinal analysis of PRO data with ToxT is currently ongoing. Lastly, a limitation of this pilot study and many clinical trials in hematology, is lack of mid cycle toxicity data and granular data on treatment discontinuation to evaluate. To fully understand AE trajectory, additional time points would be valuable along with precise information about drug dosage and specific timing and reason for treatment discontinuation due to AE in a format that lends itself to analysis along with AE data. We are currently expanding the capability of ToxT to reflect dosage information graphically in concert with toxicity, which is forthcoming. In this study, it would have been helpful to know if ANC or fatigue improved during days 21 through 28, when patients were off lenalidomide. Blood counts and symptom assessment was not conducted on this protocol during that timeframe. The burden of additional AE data collection (both for laboratory and symptomatic AEs) must be balanced against the importance and relevance of this information. Along with the need for formalized evaluation of AEs mid cycle, more detailed and accurate reporting of reasons for treatment discontinuation are also necessary to understand tolerability. In this study it was recorded that 19 patients went off for AEs, 12 for progression and 11 for other reasons. Granular data about which AE(s) a patient went off for was not recorded, as it is not currently standard, and is often challenging for data abstractors to define. With several currently ongoing and numerous NCTN studies in development, patients are now reporting a variety of symptomatic AEs from home between study visits using the PRO-CTCAE, which will hopefully allow enable more granular trajectories of symptomatic AEs over time. Ideally more stringent documentation of reason for treatment discontinuation in non-progressing patients, in addition to PRO evaluation of symptomatic AEs at the end of treatment visit, will shed light on which AE(s) may be driving therapy discontinuation.
Tolerability of treatment is a complex construct with inherent challenges in definition, capture and analysis. Tolerability is informed by safety data, the patient experience, information about dose intensity and schedule, as well as AE temporal profile and burden over time. In the case study presented here, we applied the longitudinal ToxT approach to better characterize the latter element of tolerability of lenalidomide. ToxT analyses provided precise descriptions of neutropenia and fatigue trajectory from lenalidomide that were not identified by standard maximum grade CTCAE analysis or reflected in the conventional maximum CTCAE grade toxicity table. Developing approaches to longitudinal CTCAE analysis represents an initial step in understanding tolerability. The next steps are to systematically collect clinician- and patient-reported toxicity data in prospective trials, and to perform longitudinal toxicity analyses with integration of data about dose reductions, delays and supportive care measures that characterize safety and tolerability from the patient perspective. Longitudinal AE analysis offers a more complete, patient-centered toxicity assessment of the tolerability of chronically administered therapy for hematologic malignancies.
Role of the funding source
Support: Research reported in this publication was supported by the National Cancer Institute of the National Institutes of Health under Award Numbers U10CA180821, U10CA180882, and UG1CA189823 (to the Alliance for Clinical Trials in Oncology), U10CA180790, UG1CA233339, Mayo Clinic Center for Clinical and Translational Science, KL2 Mentored Career Development Award, Funded by National Center for Advancing Translational Sciences (KL2 TR002379), Mayo Clinic Lymphoma SPORE (P50 CA97274–14) Career Development Award, and the Lymphoma Research Foundation Mentoring Program. The content is solely the responsibility of the authors and does not necessarily represent the official views of the National Institutes of Health or the Lymphoma Research Foundation. The corresponding author had full access to all the data in the study and had final responsibility for the decision to submit for publication.
Footnotes
Disclosures of Conflicts of Interest
Dr. Thanarajasingam and Dr. Dueck disclose research funding from the US National Institutes of Health (National Cancer Institute). Dr. Witzig reports non-financial support from Celgene provided to his institution, outside the submitted work. Dr. Habermann has served on the scientific advisory board of Celgene and of Kite Pharmaceuticals, for which he has received no renumeration. Dr. Flowers reports grants from V Foundation, grants from National Cancer Institute, during the conduct of the study; other from Spectrum, BeiGene, Celgene, Optum Rx, Seattle Genetics, GIlead, Bayer, Karyopharm, MEI Pharmaceuticals, other from Genentech/Biogen-Idec/Roche (unpaid), Millennium/Takeda(unpaid), from Research Funding:Abbvie, Acerta, Celgene, Gilead Sciences, Infinity Pharmaceuticals, Janssen Pharmaceutical, Millennium/Takeda, Spectrum, Onyx Pharmaceuticals, Phamacyclics, NIH, outside the submitted work. Dr. Leonard reports personal fees from Celgene, personal fees from Gilead/Kite, personal fees from Teva, personal fees from ADC Therapeutics, personal fees from Abbvie, personal fees from Genmab, personal fees from Biotest, personal fees from Regeneron, personal fees from Roche/Genentech, personal fees from Sutro, personal fees from Sunesis, personal fees from BMS, personal fees from Epizyme, personal fees from Pfizer, personal fees from Bayer, personal fees from United Therapeutics, personal fees from MEI Pharma, personal fees from Novartis, personal fees from Merck, personal fees from Morphosys, personal fees from Beigene, personal fees from AstraZeneca, personal fees from Nordic Nanovector, personal fees from Karyopharm, personal fees from Sandoz, personal fees from Miltenyi, outside the submitted work.
ClinicalTrials.gov Identifier: NCT00238238 (CALGB 50401)
References
- 1.Thanarajasingam G, Minasian LM, Baron F, Cavalli F, De Claro RA, Dueck AC, et al. Beyond maximum grade: modernising the assessment and reporting of adverse events in haematological malignancies. Lancet Haematol 2018. [DOI] [PMC free article] [PubMed] [Google Scholar]
- 2.Thanarajasingam G, Hubbard JM, Sloan JA, Grothey A. The Imperative for a New Approach to Toxicity Analysis in Oncology Clinical Trials. Journal of the National Cancer Institute 2015;107(10). [DOI] [PubMed] [Google Scholar]
- 3.National Cancer Institute. Common Terminology Criteria for Adverse Events (CTCAE) Version 5.0 Bethesda, MD: U.S. Department of Health and Human Services; 2017. 2017. [Google Scholar]
- 4.Basch E, Campbell A, Hudgens S, Jones L, King-Kallimanis B, Kluetz P, et al. Broadening the definition of tolerability in cancer clinical trials to better measure the patient experience (Friends of Cancer Research White Paper) 2018. [Google Scholar]
- 5.Kluetz PG, Kanapuru B, Lemery S, Johnson LL, Fiero MH, Arscott K, et al. Informing the Tolerability of Cancer Treatments Using Patient-Reported Outcome Measures: Summary of an FDA and Critical Path Institute Workshop. Value Health 2018;21(6):742–7. [DOI] [PubMed] [Google Scholar]
- 6.Sacks CA, Miller PW, Longo DL. Talking about Toxicity — “What We’ve Got Here Is a Failure to Communicate”. New England Journal of Medicine 2019;381(15):1406–8. [DOI] [PubMed] [Google Scholar]
- 7.Tabernero J, Van Cutsem E, Ohtsu A, Amellal N, Cadour S, Fougeray R, et al. QTWiST analysis of the RECOURSE trial of trifluridine/tipiracil in metastatic colorectal cancer. ESMO Open 2017;2(5):e000284. [DOI] [PMC free article] [PubMed] [Google Scholar]
- 8.Lee SM, Hershman DL, Martin P, Leonard JP, Cheung YK. Toxicity burden score: a novel approach to summarize multiple toxic effects. Annals of Oncology 2012;23(2):537–41. [DOI] [PMC free article] [PubMed] [Google Scholar]
- 9.Cabarrou B, Boher JM, Bogart E, Tresch-Bruneel E, Penel N, Ravaud A, et al. How to report toxicity associated with targeted therapies? Annals of Oncology 2016. [DOI] [PubMed] [Google Scholar]
- 10.Carbini M, Suárez-Fariñas M, Maki RG. A Method to Summarize Toxicity in Cancer Randomized Clinical Trials. Clinical Cancer Research 2018;24(20):4968. [DOI] [PubMed] [Google Scholar]
- 11.Thanarajasingam G, Atherton PJ, Novotny PJ, Loprinzi CL, Sloan JA, Grothey A. Longitudinal adverse event assessment in oncology clinical trials: the Toxicity over Time (ToxT) analysis of Alliance trials NCCTG N9741 and 979254. The Lancet Oncology 2016;17(5):663–70. [DOI] [PMC free article] [PubMed] [Google Scholar]
- 12.Leonard JP, Jung S-H, Johnson J, Pitcher BN, Bartlett NL, Blum KA, et al. Randomized Trial of Lenalidomide Alone Versus Lenalidomide Plus Rituximab in Patients With Recurrent Follicular Lymphoma: CALGB 50401 (Alliance). Journal of Clinical Oncology 2015. [DOI] [PMC free article] [PubMed] [Google Scholar]
- 13.SII. SAS 9.4. Cary, North Carolina p. Copyright, SAS Institute Inc. SAS and all other SAS Institute Inc. product or service names are registered trademarks or trademarks of SAS Institute Inc., Cary, NC, USA.. [Google Scholar]
- 14.Dueck AC, Scher HI, Bennett AV, Mazza GL, Thanarajasingam G, Schwab G, et al. Assessment of Adverse Events From the Patient Perspective in a Phase 3 Metastatic Castration-Resistant Prostate Cancer Clinical Trial. JAMA Oncology 2019. [DOI] [PMC free article] [PubMed] [Google Scholar]
- 15.Brundage MD, Smith KC, Little EA, Bantug ET, Snyder CF, Board PRODPSA. Communicating patient-reported outcome scores using graphic formats: results from a mixed-methods evaluation. Qual Life Res 2015;24(10):2457–72. [DOI] [PMC free article] [PubMed] [Google Scholar]
- 16.Bell ML, King MT, Fairclough DL. Bias in Area Under the Curve for Longitudinal Clinical Trials With Missing Patient Reported Outcome Data: Summary Measures Versus Summary Statistics. SAGE Open 2014:1–12. [Google Scholar]
- 17.Dueck AC, Cappelleri JC. Patient-Reported Outcomes. Encyclopedia of Biopharmaceutical Statistics 3rd Edition: Taylor & Francis; 2017. p. 1–9. [Google Scholar]
- 18.Basch E Patient-Reported Outcomes - Harnessing Patients’ Voices to Improve Clinical Care. N Engl J Med 2017;376(2):105–8. [DOI] [PubMed] [Google Scholar]
- 19.Basch E, Bennett A, Pietanza MC. Use of Patient-Reported Outcomes to Improve the Predictive Accuracy of Clinician-Reported Adverse Events. Journal of the National Cancer Institute 2011;103(24):1808–10. [DOI] [PubMed] [Google Scholar]
- 20.Efficace F, Gaidano G, Lo-Coco F. Patient-Reported Outcomes in Hematology: Is It Time to Focus More on Them in Clinical Trials and Hematology Practice? Blood 2017. [DOI] [PubMed] [Google Scholar]
- 21.Kim J, Singh H, Ayalew K, Borror K, Campbell M, Johnson LL, et al. Use of PRO Measures to Inform Tolerability in Oncology Trials: Implications for Clinical Review, IND Safety Reporting, and Clinical Site Inspections. Clin Cancer Res 2018;24(8):1780–4. [DOI] [PubMed] [Google Scholar]
- 22.Bottomley A, Pe M, Sloan J, Basch E, Bonnetain F, Calvert M, et al. Analysing data from patient-reported outcome and quality of life endpoints for cancer clinical trials: a start in setting international standards. The Lancet Oncology 2016;17(11):e510–e4. [DOI] [PubMed] [Google Scholar]
- 23.Calvert M, Kyte D, Mercieca-Bebber R, Slade A, Chan A-W, King MT, et al. Guidelines for Inclusion of Patient-Reported Outcomes in Clinical Trial Protocols: The SPIRIT-PRO Extension. JAMA 2018;319(5):483–94. [DOI] [PubMed] [Google Scholar]
- 24.Coens C, Pe M, Dueck AC, Sloan J, Basch E, Calvert M, et al. International standards for the analysis of quality-of-life and patient-reported outcome endpoints in cancer randomised controlled trials: recommendations of the SISAQOL Consortium. The Lancet Oncology 2020;21(2):e83–e96. [DOI] [PubMed] [Google Scholar]
- 25.Dueck AC, Mendoza TR, Mitchell SA, et al. Validity and reliability of the us national cancer institute’s patient-reported outcomes version of the common terminology criteria for adverse events (pro-ctcae). JAMA Oncology 2015;1(8):1051–9. [DOI] [PMC free article] [PubMed] [Google Scholar]
- 26.Kluetz PG, Chingos DT, Basch EM, Mitchell SA. Patient-Reported Outcomes in Cancer Clinical Trials: Measuring Symptomatic Adverse Events With the National Cancer Institute’s Patient-Reported Outcomes Version of the Common Terminology Criteria for Adverse Events (PRO-CTCAE). Am Soc Clin Oncol Educ Book 2016;35:67–73. [DOI] [PubMed] [Google Scholar]


