

Abstract
Over the past few decades, the advent and development of genomic assessment methods and computational approaches have raised the hopes for identifying therapeutic targets that may aid in the treatment of glioblastoma. However, the targeted therapies have barely been successful in their effort to cure glioblastoma patients, leaving them with a grim prognosis. Glioblastoma exhibits high heterogeneity, both spatially and temporally. Existence of different genetic sub-populations in glioblastoma allows this tumor to adapt itself to the environmental forces. Therefore, patients with glioblastoma respond poorly to the prescribed therapies, as treatments are directed towards the whole tumor and not to the specific genetic sub-regions. Genomic alterations within the tumor develop distinct radiographic phenotypes. In this regard, magnetic resonance imaging plays a key role in characterizing molecular signatures of glioblastoma, based on regional variations and phenotypic presentation of the tumor. Radiogenomics has emerged as a (relatively) new field of research to explore the connections between genetic alterations and imaging features. Radiogenomics proffers numerous advantages, including non-invasive and global assessment of the tumor and its response to the therapies. In this review, we have summarized the potential role of radiogenomic techniques to stratify patients according to their specific tumor characteristics with the goal of designing patient-specific therapies.
Keywords: Radiogenomics, Glioblastoma, Magnetic Resonance Imaging, Molecular Signatures, Machine Learning, Radiomics
INTRODUCTION
Glioblastoma is the most frequently occurring primary malignant brain tumor in adults, with a median patient survival of 12–15 months (1), which has moderately improved lately due to the emergence of tumor treatment fields (2). Only about 5% of patients survive past 5 years from the time of diagnosis (3). Glioblastoma is identified with distinctive features of local invasion and diffuse infiltration into the surrounding brain tissue (4), significant genomic instability, cellular proliferation, robust angiogenesis, resistance to apoptosis, and tendency for necrogenesis (5,6). This leads to high likelihood of recurrence, poor response to treatment, and morbidity.
Surgical resection is not curative for glioblastoma, and even after gross total resection of the apparent tumor followed by radiotherapy with concurrent and adjuvant chemotherapy, tumor progression occurs (7). One of the main reasons for treatment failure in glioblastoma lies in notable cytological and genetic intra-tumor heterogeneity (8). It has been indicated that various genetic sub-populations co-habit within glioblastoma (i.e., there exists spatial genetic heterogeneity), which trigger different radiographic appearances and hinder therapies that do not account for the whole cohabiting tumor sub-populations in a tumor (9,10).
Over the past decade, the advent of gene expression profiling has provided new insights about the molecular and mutational profile of glioblastoma (11). Accordingly, a growing body of evidence has shown that “integrated” histological and molecular (phenotypic and genotypic) features are required for diagnosis of diffuse gliomas, which led to the 2016 CNS WHO consensus for more accurate diagnosis and reduced inter-observer variability (12). This is useful for improved tumor classification and better harmonization of patient cohorts for identification of patients most likely to respond to targeted therapies.
For gene expression profiling of the tumors, biopsy or surgical resection is required. Biopsies are usually prone to sampling errors and cannot provide a comprehensive molecular characterization within the tumor (13). Radiogenomics is a relatively new paradigm formed to non-invasively obtain tumor molecular characteristics (e.g., gene expression profiles or mutations) by virtue of the tumor’s radio-phenotypical signature (14,15). In addition to pre-operative assessments, radiogenomics can be immensely helpful in monitoring longitudinal changes of the tumor in response to treatments and adaptation of treatment strategies (16). MRI, as an indispensable diagnostic tool for neuro-oncology, has provided a platform for genomics studies through radiogenomics.
This review discusses the role and potential of MRI in radiogenomic studies for analysis of patients diagnosed with glioblastoma. We first start with a brief introduction of genomics of glioblastoma and the principle of radiogenomics, followed by an overview of findings of radiogenomic studies. Consequently, the considerations and challenges of current radiogenomic studies, as well as future directions, are discussed.
GENOMICS OF GLIOBLASTOMA
Genomics has the potential to contribute in the management of glioblastoma in several ways, including aiding in precise diagnosis, identification of targetable driver mutations, clinical trial design, and subtyping (11). The use of molecular information led to the genetic and clinical distinction of primary (or de novo) from secondary glioblastoma, which arise from lower grades. Specific genetic alterations are different in primary and secondary glioblastoma: the IDH1 mutation is particularly frequent in secondary glioblastoma and young patients. It is therefore used as a diagnostic marker of secondary glioblastoma, and provides superior information to clinical and/or pathological data (17). Furthermore, TP53 mutations are highly common in secondary glioblastoma, while EGFR overexpression is frequent in primary ones. Additionally, EGFR amplification, PTEN mutation, and loss of chromosome 10 are predominant in primary glioblastoma (18,19). Genomic profiling further facilitates the diagnosis by rectifying pathological findings and prognosis (20) through DNA methylation stratification, both of which can immensely affect the treatment plan, e.g., by avoiding chemotherapy (21).
Genomic information can also be helpful in the identification of mutations favorable for targeted, personalized therapies, and in homogenizing patient populations in clinical trials. Although there have been rare encouraging cases, most of the designed targeted therapies have failed to make improvements in the management of glioblastoma (11,22). Molecular biomarkers could aid the oncologists in prescribing chemotherapy regimens that are most effective according to the given mutations or to enroll patients in relevant clinical trials.
The advent of technologies that can measure genomic information in cancer has raised the hopes for finding biomarkers that predict resistance to traditional therapies (23). While molecular analyses are worthwhile for the stratification of glioblastoma patients, there are challenges in their application when put into practice. The analysis is dependent on the tissue samples obtained by surgical resection or biopsy procedure and therefore limited by the time at which the tissue is collected and the spatial location of the sampled tissue within the heterogeneous tumor. Furthermore, sub-optimal genomic analysis techniques, the type, cost and depth of coverage of the assay, can impose challenges in multi-institutional clinical trials (24). MRI is a versatile tool that can aid in non-invasive uncovering of genomic alterations before biopsy or surgery and guiding targeted biopsies. It can be further incorporated in the whole management spectrum from detecting patient-specific therapeutic targets, monitoring treatment response, and prognosis.
RADIOGENOMICS OF GLIOBLASTOMA
Imaging genomics (or radiogenomics) can be performed to either understand any possible molecular associate of a specific radiographic phenotype, or indicate how a particular genomic variation might impact the imaging traits of the tumors (15,16,25). Radiogenomic studies are either exploratory or hypothesis-driven (16). In exploratory studies, a variety of imaging features are tested against several genomic alterations. On the other hand, in hypothesis-driven studies, for a specific genetic variation (gene mutation or pathway alteration), relevant radio-phenotypes are evaluated.
A radiogenomic study should ideally be designed based on a systematic approach comprising of several steps: 1) image acquisition, 2) image post-processing, including noise/artifact reduction, intensity and/or orientation standardization, co-registration of the multi-parametric MRI scans, 3) region-of-interest definition using manual annotation or (semi-)automatic segmentation, 4) feature extraction based on human-engineered (conventional radiomics) or deep learning approaches, and 5) data analysis for prediction of tumor genomics, involving machine/deep learning methods for feature selection, classification, and cross-validation. There are numerous leading review papers with detailed descriptions of these steps (8,26,27). A schematic flow-graph of a radiomics study is illustrated in Fig. 1 and the radiogenomic studies designed according to this workflow are summarized in Table 1.
Fig. 1.
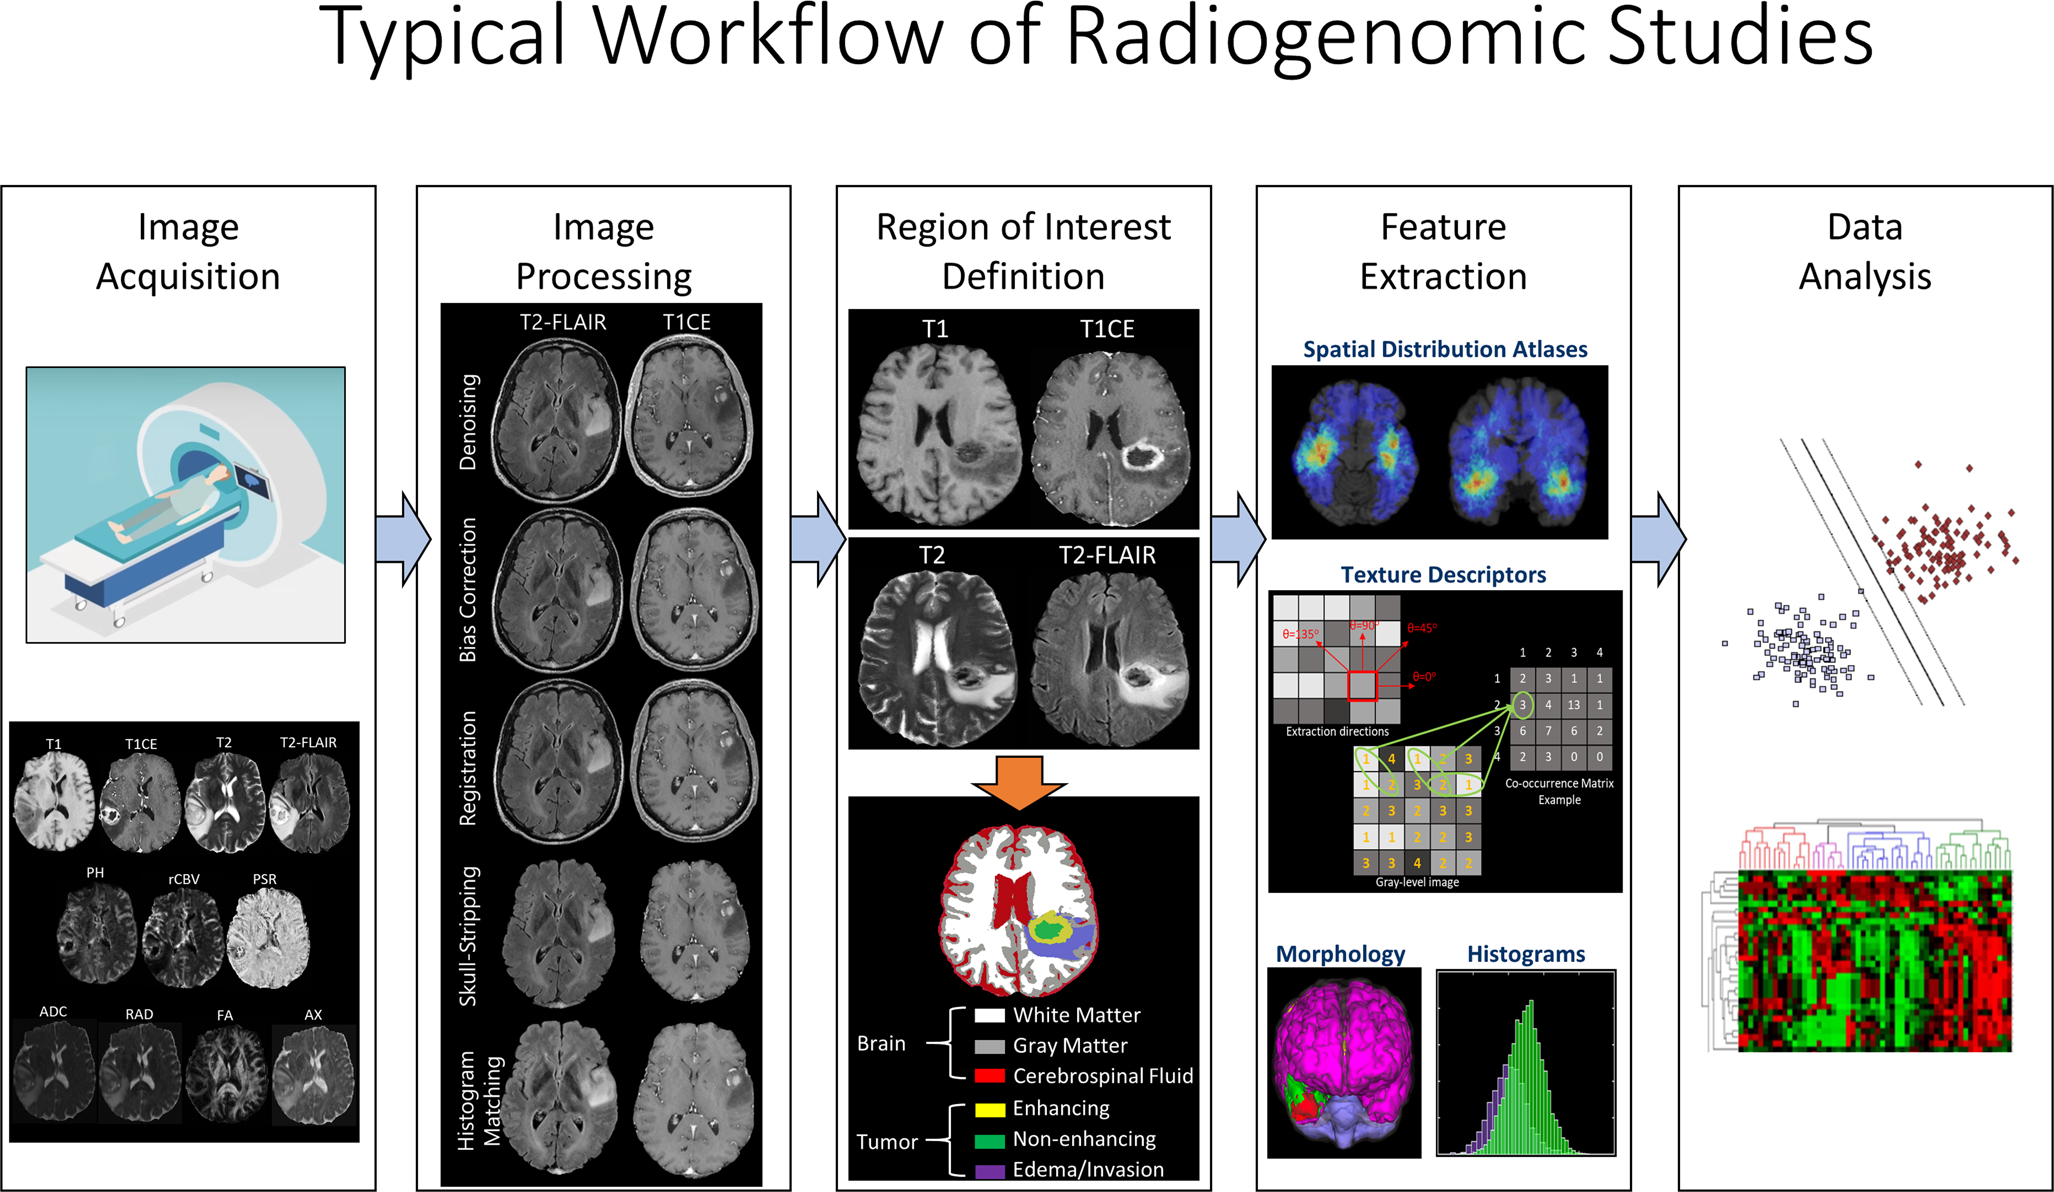
A representation of the proper workflow of a radiomic study, which includes the following steps: 1) image acquisition, 2) image processing, including noise/artifact reduction, intensity and/or orientation standardization, co-registration of the multi-parametric MRI scans, 3) region-of-interest definition using manual annotation or (semi-)automatic segmentation, 4) feature extraction based on human-engineered (conventional radiomics) or deep learning approaches, and 5) data analysis, involving machine/deep learning methods for feature selection, classification, and cross-validation. Radiogenomics studies should ideally follow the same workflow, with genomics of glioblastoma as their endpoint.
Table 1.
A summary of radiogenomic studies that have undertaken the systematic workflow (according to Fig.1)
| Study | MRI Techniques | Molecular Characteristic(s) | The number of Patients in the Cohort |
|---|---|---|---|
| Itakura et al, 2015 (33) | T1CE | Multiple signaling pathways | n=265 (development cohort (n=121), validation cohort (n=144)) |
| Kickingereder et al, 2016 (112) | T1w, T1CE, T2w, T2-FLAIR, DWI, DSC-MRI | Molecular subtypes (mesenchymal, RTK 1 “PDGFRA”, RTK II “classic”, IDH1, G34) and multiple genes (MGMT, EGFR, PDGFRA, MDM4, CDK4, PTEN, CDKN2A, NF1, Rb1) | n=152 |
| Korfiatis et al, 2016 (72) | T1w, T1CE, T2w | MGMT methylation | n=155 |
| Macyszyn et al, 2016 (118) | T1w, T1CE, T2w, T2-FLAIR, DTI, DSC-MRI | Verhaak’s Molecular Subtypes | n=99 |
| Kickingereder et al, 2017 (74) | T1w, T1CE, T2-FLAIR | MGMT methylation | n=181 (discovery set (n=120), validation set (n = 61)) |
| Li et al, 2018 (73) | T1w, T1CE, T2w, T2-FLAIR | MGMT methylation | n=193 (primary cohort (n=133), validation cohort (n=60)) |
| Beig et al, 2017 (87) | T1CE, T2w, T2-FLAIR | Hypoxia pathways | n=115 (training set (n=85), independent validation set (n=30)) |
| Bakas et al, 2018 (103) | DSC-MRI | EGFRvIII | n=142 (discovery cohort (n=64) and replication cohort (n=78)) |
| Akbari et al, 2018 (104) | T1w, T1CE, T2w, T2-FLAIR, DTI, DSC-MRI | EGFRvIII | n=129 (discovery cohort (n=75) and replication cohort (n=54)) |
| Rathore et al, 2018 (34) | T1w, T1CE, T2w, T2-FLAIR, DTI, DSC-MRI | Verhaak’s Molecular Subtypes | n=261 (discovery cohort (n=208), validation cohort (n=53)) |
| Chang et al, 2018 (52) | T1w, T1CE, T2w, T2-FLAIR | IDH1, MGMT, 1p/19q co-deletion | n=259 |
While the mentioned analytical strategy should preferably be undertaken, there are only a few radiogenomics studies that have been carried out with this design. Here, we provide an overview of the radiogenomics studies according to their exploratory or hypothesis-based design, and their molecular characteristic of interest.
Exploratory Studies
Most of the existing radiogenomic studies are intended to establish relationships between the tumor radiographic characteristics (e.g., tumor enhancement volume, necrotic extent) and gene expression profiles or pathways. These exploratory studies aimed to build foundations for the best research design, data collection, and analysis to help in developing relevant hypotheses for future studies. As exploratory studies seek to find relevant mutations that may produce distinctive radiographic phenotypes, we have summarized the overview of these studies based on their investigated radio-phenotypical characteristics.
Tumor Core
Van Meter et al (28) explored intra-tumor genetic variations in regions located in the periphery of enhancing mass on T1CE and poorly-enhancing central tumor core. Using microarray technology, RNA sequencing was performed for specimens collected intra-operatively from the tumor periphery and the necrotic or pre-necrotic regions, via image-guided stereotactic biopsies. Significant differences were found for therapeutic targets like EGFR and VEGF. The results were suggestive of the existence of spatial variations in intra-tumor glioblastoma regions, with the enhancing tumor periphery having an increased expression of genes involved in proliferation and invasion events, and the poorly enhancing and low perfused core having an elevated rate of expression for hypoxia-induced genes.
In a study by Diehn et al (29) on 22 patients who underwent stereotactic localized biopsy sampling, the gene-expression profiles were shown to be discriminant between contrast enhancing and non-enhancing tissues. Furthermore, an infiltrative subtype of glioblastoma, which was specified by the presence of an infiltrative pattern in the edematous region, was significantly associated with the genes involved in CNS development and gliogenesis. This finding suggested a possibility of shared gene-expression programs between infiltrative glioblastoma subtype and glial progenitors or CNS stem cells. The tumor’s mass effect was shown to be correlated with the genes associated with proliferation, and contrast enhancement on T1CE images was shown to be related to the genes involved in hypoxic processes.
Pope et al (30) compared gene expressions based on DNA microarrays between incompletely-enhancing (IE) and contrast-enhancing (CE) tumors in newly diagnosed glioblastoma. 71 genes, including proangiogenic and edema-related genes including VEGF, showed overexpression in CE compared to IE glioblastoma. Several genes related to primary glioblastoma were expressed in CE, while a few genes related to secondary glioblastoma showed expression in IE glioblastoma, with the latter event being associated with longer survival.
Analysis of copy number variation in multicentric glioblastoma (defined by the presence of multiple foci of contrast enhancement on T1w images or multiple isolated lesions with high signal intensity on T2-FLAIR images) has revealed dissimilar gene expression profiling and signaling pathways in different foci of multicentric glioblastoma, which is suggestive of high intra-patient heterogeneity of molecular characteristics (31).
The volume of CE tumor on MRI, in addition to clinical and genomics factors (HRAS copy number variation) has also been reported to provide an accurate prognosis of survival in a cohort of 102 glioblastoma tumors (32).
Most of the radiogenomic studies have been carried out using correlation and/or statistical significance assessment. The first group to explore the relationship of radio-phenotypes with molecular pathways using a machine learning approach was Itakura et al (33). They included a multi-institutional cohort of 265 GBM patients (development cohort (n=121), validation cohort (n=144)), and calculated 388 image features from T1CE images. Three imaging phenotypes were identified using a clustering algorithm: pre-multifocal, spherical, and rim-enhancing. The pre-multifocal imaging phenotype with the worse survival was significantly associated with the c-Kit stem cell factor receptor pathway. The spherical phenotype with intermediate survival was linked to down-regulation of 21 pathways, including VEGFR and PDGFR-α signaling. The rim-enhancing phenotype with the favorable survival was differentiated by the up-regulation of 31 pathways, including PDGFR-β signaling and many of the down-regulated pathways in spherical phenotype, such as VEGFR signaling. This was further evaluated by Rathore et al (34), who found a relationship between these imaging subtypes with Verhaak’s molecular subtypes of glioblastoma tumors (35).
Peritumoral Edematous/Tumor-Infiltrated Tissue
The high amount of non-enhancing peritumoral edematous/tumor-infiltrated tissue (appeared as hyperintense region on T2-FLAIR images) was used as the imaging characteristic in exploration of gene associations in a study by Zinn et al (36). They suggested that this edema/cellular invasion phenotype exhibits upregulated PERIOSTIN (POSTN) gene set and downregulated miR-219, which was predicted to bind to and regulate POSTN. The expression of POSTN was related to poor overall and progression-free survival. In a consecutive study, they proposed that the combination of tumor volume, age, and KPS (VAK) can provide a 3-point scoring system for classification of glioblastoma (37). They showed that the group with good prognosis (the so-called VAK-A) was significantly associated with p53 activation and favorable MGMT promoter methylation status, as compared to the poor prognosis class (VAK-B).
Jamshidi et al (38) carried out a preliminary study on 23 glioblastoma patients and showed an association of vasogenic edema with PI3K signaling network, and a correlation of SVZ involvement with Ras oncogene family members.
Necrotic Core
In a study on necrotic volumes extracted from MRI scans of 99 glioblastoma patients (30 female, 69 male), Colen et al (39) identified gender-specific molecular mechanisms for cell death (TP53 apoptotic in male patients, MYC oncogenic in female patients), suggesting the importance of including sex as a covariate in analyzing molecular data, designing clinical trials, and planning therapies. This was one of the first radiogenomic studies highlighting sex-related variations in genomics and imaging characteristics of glioblastoma.
Using a correlation approach, Grossman et al (40) demonstrated association of necrotic volume with apoptosis and immune response, CE volume with signal transduction, and peritumoral edematous/tumor-infiltrated tissue with homeostasis.
Diffusion Restriction
Cui et al (41) conducted a multi-institutional study, in which high-risk volume (HRV) of glioblastoma, defined as the region with low cellularity according to ADC-map and high enhancement on T1w images, was tested against MGMT methylation status, and mutation status of multiple genes. HRV was not predictive of MGMT methylation status but their combination served as a strong predictor of the overall survival. Furthermore, HRV was significantly higher in the PIK3CA-mutant compared to the wildtype group.
Zinn et al (42) studied ADC values in the NE portion of the tumor, based on T2-FLAIR images, in 35 glioblastoma patients and found that more diffusion restriction (lower ADC values) in the peritumoral edematous/tumor-infiltrated tissue was correlated to distinct genomic networks and differentially-expressed genes that play a role in invasion.
Heiland et al investigated the role of DTI-derived parameters in identification of gene expression pathways (43) in 21 patients who underwent neuro-navigated biopsy operation. In the CE tumor region, FA was strongly associated with activation of epithelial-to-mesenchymal transition pathway and glioblastoma with high FA had the worse prognosis, MD was linked to the genes related to neural function and higher MD was suggestive of more favorable prognosis.
Angiogenesis
Barajas et al (44) collected multiple biopsies from CE and peritumoral non-enhancing regions. They observed elevated CBV and PH values, and decreased PSR and ADC values, within CE regions. According to RNA expression patterns obtained by microarray analysis, 6,653 genes were differentially expressed between the two biopsy specimen groups (CE vs NE). Genes associated with mitosis, angiogenesis, and apoptosis were significantly up-regulated in CE regions as compared to NE parts. Heiland et al showed that vessel size (VS) is highly related to hypoxia, and Epithelial Growth Factor (EGF) pathway and Epithelial-to-Mesenchymal-Transition (EMT) were strongly linked to CBV (45). CBV and CBF-related radiomic features have shown to be significantly related to upregulation of PDGF, EGFR, and VEGF pathways and downregulation of PTEN pathway in a study by Kong et al (46).
Metabolic Function
Only a handful of exploratory studies have investigated MRS in association with genomic data. In a study on 20 glioblastoma patients, Heiland et al (47) explored the relationship between the concentration of metabolites derived from MRS and gene expression pathways. They found that gene expression pathways associated with oligodendrocytic and neural development were significantly correlated to nNAA metabolite (NAA in the tumor normalized to the contralateral healthy tissue); high nCr was found to be correlated to proneural glioblastoma subtype, and low nCr was related to mesenchymal subtype; nGlx was significantly linked to the gene expression profiles involved in hypoxia and cytoskeletal processes; low nGlx was associated to neural subtype, and its high value was related to the classical subtype. Patients with higher nNAA showed longer progression-free survival.
Hypothesis-Driven Studies
Hypothesis-driven studies on glioblastoma are carried out given a certain hypothesis, based on the assumption of variations of one or more genes, pathways, or molecular subtypes, and through exploring the relevant radio-phenotype that best represents the assumed genomics alteration. Glioblastoma harbors around 60 mutations, however, many of these mutations are only “passengers” and only a few are driver mutations (48), which will be explained further.
In what follows, we have categorized the studies based on the mutation of a gene of interest with a focus on the genes that are most relevant for diagnosis and/or targeted therapies, signaling pathways, or molecular subtypes in glioblastoma. A summary of the most repeatable imaging findings for molecular signatures can be found in Table 2.
Table 2.
Summary of MRI phenotypes that have more repeatedly been reported in radiogenomics studies to be associated with specific molecular signature(s)
| Molecular Signature(s) | MRI Phenotype | Radiogenomic Studies |
|---|---|---|
| IDH1 mutation | ||
| Large proportion of non-enhancing tumor compared to tumor enhancement | (52), (54) | |
| Higher CBF, large necrosis | (55) | |
| Frontal location of tumor | (53,56,57,59) | |
| Concentration of 2HG metabolite | (60–63) | |
| MGMT Promoter Methylation | ||
| Higher Ktrans | (70) | |
| Higher minimum ADC | (71) | |
| Higher proportion of non-enhancing tumor | (52) | |
| Left temporal lobe location of tumor | (56,76) | |
| VEGF mutation | ||
| Contrast enhancement | (29) | |
| Heterogeneous edema | (87,88) | |
| EGFR amplification of EGFRvIII mutation | ||
| Higher ratio of the volume of T2w to T1CE abnormality | (98,99) | |
| Higher diffusion restriction | (100,104) | |
| Elevated Ktrans, rCBV, PH | (82,101–104) | |
| Molecular Subtypes | ||
| Mesenchymal subtype | Lower ratio of the volume of T2w to T1CE abnormality | (111,117,119) |
| Proneural subtype | Lower contrast enhancement | (111,118) |
| Classic subtype | Lower intensity in the edema region | (119) |
Isocitrate Dehydrogenase1 (IDH1)
The IDH1 enzyme, found primarily in the cytoplasm and peroxisomes, which are cellular structures that process numerous molecule types, convert isocitrate to ketoglutarate. This leads to production of NADPH molecule, which is important for many cellular processes, such as producing energy, and protecting cells from harmful molecules called reactive oxygen species. The IDH1 gene is responsible for providing instructions for producing the IDH1 enzyme. The IDH1 mutation produces an oncometabolite called 2-hydroxy-glutarate (2-HG), which in turn affects hypoxia inducible factor 1α (HIF-1α). In glioblastoma, an elevation of HIF-1α is a factor in progression of tumor (49,50). IDH1 mutations are frequent in younger patients with grade II gliomas or secondary glioblastoma, and are generally found to have more favorable prognosis with increased overall and progression-free survival than IDH1-wildtype tumors (49–51). IDH1 status has been included in WHO 2016 classification guidelines, due to its significant prognostic importance in stratifying gliomas.
Several radiogenomic studies have suggested connections between the IDH1 mutation with radio-phenotypic appearance of glioblastoma. Chang et al (52) demonstrated that small regions of enhancement and larger proportion of non-enhancing tumor, cysts with low T1 and suppressed T2-FLAIR signal intensity, and well-defined tumor margins are more predictive of IDH1-mutant tumors. Similarly, another research study suggested that large regions of NE tumor can predict IDH1 mutations (53). Hong et al (54) indicated that IDH1-mutant patients have a larger volume of abnormality on T2w and higher ratio of the T2w to T1CE volumes. Additionally, higher mean nADC and longer progression-free survival was observed for IDH1-mutant tumors compared to wildtype. Yamashita et al (55) studied 55 patients (11 patients with IDH1 mutations) and proposed that absolute tumor blood flow (derived from the CBF maps of ASL imaging), relative tumor blood flow (the ratio of CBF in the tumor ROI compared to contralateral normal tissue), necrosis area, and percentage of cross-sectional necrosis area inside the enhancing lesion (the proportional area of no enhancement within the largest cross-sectional area of enhancement) were significantly higher in the IDH1-wildtype group than in mutant group. No significant differences were found for minimum or mean ADC values in the enhancing regions of the tumor (T1CE enhancement).
With regard to tumor location, researchers have reported somewhat similar findings: In the work by Carrillo et al (53), IDH1 tumors occurred more in the frontal lobe, which was also verified by Ellingson et al (56) who showed the prevalence of IDH1-mutant tumors in the left frontal lobe. In a study of a mixture of different glioma grades, Altieri et al (57) demonstrated that IDH1 mutations occur mainly in the right hemisphere and for IDH1-wiltype glioblastoma, temporal lobe is the main area of incidence (249 gliomas; 221 HGG and 28 LGG). Conversely, in another study of lower grade (199 grade II/III) gliomas on the lesion location for IDH1/2 and TERT mutations, Arita et al (58) reported frontal, insular and temporal lobes as the incidence locations of IDH1/2 mutants. Neyra et al (59) used a voxel-based lesion symptom mapping (VLSM) analysis, and investigated the association of several key genes with tumor location. They found a predominance of the IDH1 mutation in the frontal lobe adjacent to the rostral extension of the lateral ventricles both lower grade gliomas and glioblastoma. Overall, IDH1 mutations seem to be more frequently occurring in the frontal lobe.
As mentioned earlier, 2HG is an oncometabolite that has a key role in altering the HIF1A levels leading to switching the tumor cell functions towards progression and malignancy. The IDH1 mutation leads to production of 2HG and increasing evidence supports 2HG to be an optimal biomarker of the IDH1 mutation. Accumulation of 2HG in the tumors with an IDH1 mutation can be noninvasively detected in-vivo by MRS (60–62), which is ideal compared to biopsy, as it does not impose any risks to the patient and can be repeated, it can cover different tumorous regions and consider the normal appearing brain as an internal reference tissue (63). This method seems to present a unique example of MR-based non-invasive detection of a tumor biomarker that is biologically well-supported. However, accurate diagnosis based on this method is dependent upon proper acquisition and quantification methods to avoid false positive results (61,64).
O6-methylguanine-DNA Methyltransferase (MGMT)
MGMT is a protein coding gene that encodes O6-alkylguanine DNA alkyltransferase, which is a DNA repair enzyme. MGMT is crucial for genomic stability and is involved in cellular defense against mutagenesis and toxicity from alkylating agents, which are potent carcinogens resulting in cell death, mutation, and cancer. Genome-wide methylation of MGMT may be associated with carcinogenesis and tumor progression, silencing of tumor suppressors such as TP53 and PTEN (65,66). Methylation of MGMT promoter occurs in 35–45% of malignant gliomas (WHO grades III and IV) and is an important predictive biomarker for the patient’s response to alkylating chemotherapy in glioblastoma. Particularly, MGMT promoter methylation could affect the decision for adjuvant chemoradiotherapy and temolozomide treatment for elderly patients, as it could be too toxic for this patient population (67). For elderly patients with MGMT methylated high-grade gliomas, when temozolomide treatment was adopted, the overall survival improved and for unmethylated group, only radiotherapy is more efficient (68). Progression time is proposed to be significantly longer in patients with MGMT promoter methylation (21.9 months) compared to the unmethylated group (9.2 months), and pseudo-progression, which is a result of treatment-induced blood brain barrier disruption, is more frequent in MGMT methylated group. This in fact reflects the effectiveness of radiotherapy followed by temolozomide therapy for the patients with MGMT methylation and has shown to increase the overall survival in this patient group (69).
Prediction of MGMT methylation status, based on MRI, seems to be challenging but if successful, it will provide a worthwhile non-invasive diagnostic methodology for patient stratification and treatment planning, compared to biopsy. In this regard, Ahn et al (70) found that MGMT methylation was not significantly associated with any features on conventional MRI or DCE-MRI-derived Kep and Ve or DTI-derived ADC and FA. However, Ktrans was statistically higher in MGMT methylated group. As methylated glioblastoma tumors indicate more favorable prognosis, the increased Ktrans in the tumor for this group could be attributed to better penetration of the drugs leading to a better response to treatment.
Rundle-Thiele (71) indicated that minimum ADC was strongly correlated to MGMT status and its elevation was highly suggestive of methylation. According to Chang et al (52), for the MGMT methylated group, heterogeneous nodular enhancement, presence of eccentric cyst, higher portion of non-enhancing tumor with cortical involvement, and slight frontal location dominance can be observed. Texture features from T2w imaging in a work by Korfiatis et al (72) could predict MGMT methylation status in 155 patients with 85% accuracy whereas Li et al (73) built a radiomic model with an accuracy of 80% based on features extracted from a combination of T1w, T1CE, T2w and T2-FLAIR images for prediction of MGMT status in 133 patients.
Kickingereder et al (74) in a study on 181 GBM patients, reported on added value of radiomics to MGMT status and clinical information for improving the prediction of overall and progression-free survival of patients by around 10%. This was similarly verified by Bae et al (75).
The most frequent location of MGMT-methylated glioblastomas seems to be the left temporal lobe (56,76) or the parietal lobe (57), and the MGMT unmethylated group prevail in the insular lobe. MGMT-methylated tumors with an IDH1 mutation mostly grows in the left frontal lobe (56).
Platelet-Derived Growth Factor (PDGF)
PDGFs and their receptors (PDGFRs) play a critical role in cell growth and division, blood vessel formation, proliferation of mesenchymal cells, cell migration, and response to damage. PDGF gene encodes receptor tyrosine kinases (RTKs), a type of cell surface receptor, which transmits signals from cell surface into the cell via signal transduction (77,78). Amplification of PDGF and PDGFR genes, rearrangement of PDGFR-α or overexpression of PDGF ligand, are the common mutations in ~10% of glioblastoma (79). PDGF expression has been shown to be associated with negative prognostic markers of glioblastoma, such as age and lack of the IDH1 mutation (11,80).
A study by Gutman et al (81) suggested that PDGFR-α could be predicted by the ratios of hyperintensity/total tumor volume and tumor bulk/total tumor volume on T2-FLAIR images. Hu et al (82) collected 81 tissue samples using a neuro-navigation biopsy procedure from 18 GBM patients and investigated the differences between gene mutations in the enhancing tumor and brain around tumor based on multi-parametric MRI. PDGFR-α amplification was strongly linked to the texture feature belonging to discrete orthonormal Stockwell transform (DOST) and gray-level co-occurrence matrix (GLCM) categories, derived from isotropic diffusion maps (p), and moderately correlated to DOST texture on EPI+C images.
Vascular Endothelial Growth Factor (VEGF)
In glioblastoma, neo-angiogenesis is a crucial physiologic process to ensure existence of an adequate blood supply for proliferation, survival, and invasion of tumor cells. The VEGF and its receptor (VEGFR), which belong to the PDGF supergene family, is among the dominant pro-angiogenic factors regulating angiogenesis in gliomas. VEGF expression in glioblastoma occurs mostly in the vicinity of necrotic and hypoxic regions through hypoxia-dependent and –independent mechanisms. Hypoxia is observed in the regions deprived of oxygen, leading to accumulation of hypoxia inducible factor-1α (HIF-1α) which activates several hypoxia-related genes, including VEGF. Hypoxia-independent mechanism of VEGF upregulation acts through dysregulated activation of mitogenic and survival pathways (83–85). Several anti-angiogenic drugs and therapies for inhibition of VEGF(R) have been developed and are undergoing clinical trials or approved (bevacizumab, as an anti–VEGF-A humanized monoclonal antibody) for treatment of glioblastoma. However, these drugs have shown no benefit for improving the overall survival (86).
In a preliminary study, Diehn et al (29) showed that contrast enhancement was associated with the activation of tumor hypoxia genes (including VEGF). Beig et al (87,88) performed RNA sequencing for 21 gene expression profile which are associated with hypoxia. Three clusters of low, medium, and high hypoxia index were identified to be correlated with radiomic features. Texture features that quantify structural heterogeneity within edema region on T1w and T2w images, and features that represent the edges and ripples in the enhancing tumor region on T2-FLAIR images were significantly associated with the hypoxia enrichment score.
With a different perspective about the connection between fractal features of volumetric contrast enhancement regions on T1CE and tumor genomics, Miller et al (89) calculated fractal pattern features from 39 GBMs. They showed significant correlations of high fractal dimension with mitochondrial respiration/ATP production pathways and increased VEGF expression. They concluded that the complexity of contrast enhancement represented by variations in fractal features is linked to the genetic pathways of a shift to glycolytic metabolism and VEGF expression.
Epidermal Growth Factor Receptor (EGFR)
EGFR is a cell surface protein and a transmembrane tyrosine kinase receptor, present in epidermal cells, and is a key factor in regulating cell division and death. EGFR gene encodes the EGFR protein to extend the membrane for one end to remain inside and the other to project outside. This allows the protein to attach to ligands for receiving signals helpful for the cell to respond to the environment (90), which follows by activation of a series of intracellular signaling cascades influencing apoptosis, angiogenesis, and invasion.
Overexpression or amplification of EGFR gene is a feature of more aggressive primary glioblastoma (approximately 60%) and is less frequent in secondary glioblastoma (~10%) (91). The most common mutant of EGFR is called variant three (EGFRΔIII, or EGFRvIII), which results from deletion of exons 2 to 7 of the EGFR gene. This mutation has been suggested to be crucial in gliomagenesis and causes increased proliferation, motility, aggressiveness and resistance to therapy for tumor cells (92,93).
Targeting EGFR has shown satisfactory outcomes for several cancers such as colorectal cancer, non-small cell lung cancer, and pancreatic cancer. While being a ‘signature molecule’ for glioblastoma, the reason behind unsuccessful application of EGFR targeting drugs is still undetermined. It is suggested that the failure of EGFR-targeting therapies is attributed to drug delivery issues, numerous adaptive mechanisms, alternate pathway adaptation and less relevance in later stages of the disease (94,95).
EGFR amplification/overexpression occurs mostly in the infiltrating edges and is a factor for upregulating the genes that play a role in glioblastoma invasiveness (96,97). Thus, from an MRI standpoint, the infiltrating tumor sub-regions, especially in the edema, seem to harbor relevant radiographic signatures to EGFR amplification/overexpression. In 2005, Aghi et al (98) examined 75 patients with glioblastoma and found an increased value for T2 (high intensity) to T1 enhancement ratio, and fuzzier borders for tumors with EGFR amplification. This alteration can produce peritumoral edematous/tumor-infiltrated tissue and angiogenesis, facilitating tumor invasion into the surrounding tissue. This can be further explained by the less sharpness of tumor borders indicating an indefinite border between active tumor and the peritumoral edematous/tumor-infiltrated tissue. In consistency, Bosnyak et al (99) suggested a lower T1 contrast volume and lower T1/T2 volume for tumors with EGFR amplification. Diehn et al (29) showed that EGFR overexpression is significantly associated with higher ratio of CE volume to necrotic core volume. Conversely, Gutman et al (81) found that the necrosis/CE ratio was significantly higher in EGFR mutants. In a research by Bale et al (100), higher diffusion restriction was observed in tumors with EGFR amplification while lesion enhancement was not specific for EGFR amplification.
EGFR alterations are linked to changes in neo-angiogenesis and can be captured by MR perfusion-derived parameters. Arevalo-Perez et al (101) tested 82 glioblastoma tumors with known status of EGFRvIII using DCE-MRI, and concluded that patients with EGFRvIII mutations showed increased relative plasma volume and Ktrans. Gupta et al (102) indicated that glioblastoma with EGFR amplification had higher rCBV and lower PSR, and those with EGFRvIII mutation had higher median rPH than the wildtypes.
Intra-tumoral spatial variation of the EGFR mutation has been explored in a few studies. Analysis of biopsy samples collected intra-operatively from CE tumor and NE tumor regions by Hu et al (82) demonstrated that EGFR amplification is more prevalent in the CE tumor compared to the NE regions and it significantly correlates with texture features on rCBV maps (indicative of microvessel volume and angiogenesis) and a few features based on T2w images (reflective of tissue water and edema). Bakas et al (103) proposed a peritumoral heterogeneity index derived from DSC-MRI to characterize peritumoral infiltration and vascularization patterns in the close and distant regions to the CE tumor, and showed that this index serves as a non-invasive imaging signature for predicting EGFRvIII status.
In a machine learning approach and using multi-parametric MR images, Akbari et al (104) discovered that EGFRvIII mutant group exhibit higher rCBV and PH scores associated with elevated neo-angiogenesis, lower water concentration based on T2-FLAIR, and lower ADC value related to dense and non-necrotic regions. Furthermore, they found that EGFRvIII mutants occur more frequently in the frontal and parietal lobes while the wildtype tumors are mostly located in the temporal lobe (Fig. 2). This finding was earlier reported by Bilello et al (105), who found that EGFRvIII mutations are more prominent in the frontal lobe as compared to the wildtype tumors, which prevail in the right frontotemporal region. However, other findings about location of tumors with EGFR amplification or EGFRvIII mutation are contradictory with the aforementioned studies. For example, Ellingson et al (56) showed that tumors with EGFR amplification or EGFRvIII mutation occur most frequently in the left temporal lobe.
Fig. 2.
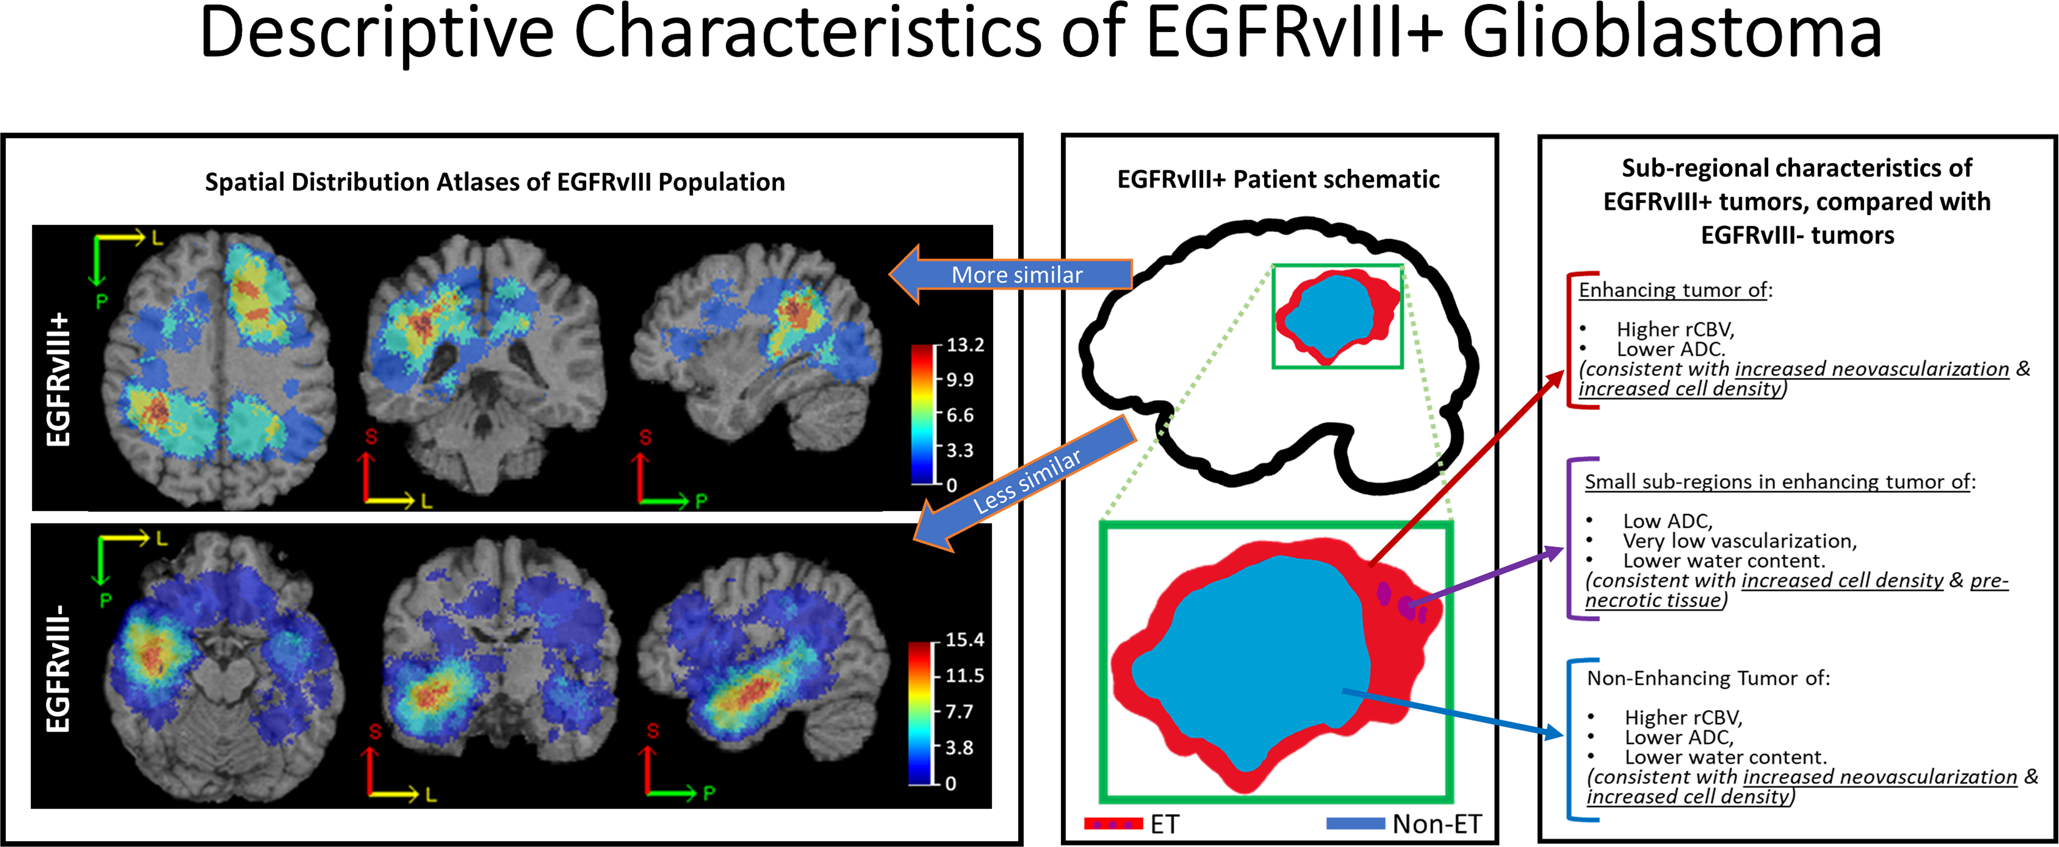
An illustration of descriptive characteristics of mutant EGFRvIII (EGFRvIII+) tumors (adopted from ref. (104) with permission from the authors and the publisher (Oxford University Press, License No. 4636511399697)).
Phosphate and Tensin Homolog (PTEN)
PTEN is a tumor suppressor gene that maps to the chromosomal region 10q23 and regulates cell division to avoid uncontrolled or rapid proliferation. It inhibits the growth factor signals from passing through the PI3K/AKT signaling pathway. The encoded PTEN enzyme makes modifications to other proteins and lipids for removing phosphate groups. Furthermore, it triggers apoptosis process, plays a role in cell migration, adhesion of cells to surrounding tissue, angiogenesis, and possibly helps in maintaining the genetic information of the cell. The aforementioned processes lead to the inhibition of excessive cell growth and tumor formation (90). In most of the cancers, PTEN loss or downregulation is one of the most frequent mutations and has been suggested to be an early phenomenon in glioblastomas (106). Some studies suggest that the PTEN mutation is linked to poor survival in patients with glioblastoma (107,108). PTEN loss is a rare incident in lower grade tumors, rather, it is a sign of tumor progression into a more malignant form (108).
So far, PTEN has not been considered a therapeutic target individually. Early studies on anti-proliferation therapy drugs suggested that EGFRvIII-mutant glioblastoma responds to EGFR inhibitors when their PTEN was intact (109). Only recently, researchers have found a mechanism of resistance to therapies, i.e. ionizing radiation and chemotherapy, which is moderated by phosphorylation of PTEN on tyrosine 240 (pY240) by FGFR (110). Blocking Y240 phosphorylation in glioblastoma models in mice showed to induce radiation sensitivity and increase survival.
Most of the few studies investigating imaging-PTEN mutation have been unsuccessful in indicating any radio-phenotype that can discriminate the glioblastoma with the PTEN mutation from the wildtype group (41,111,112). The only study with notable results seems to be the one carried out by Hu et al (82), where in a multi-parametric MRI study of 81 tissue samples, collected by a neuro-navigation biopsy procedure from 18 GBM patients, strong correlation between PTEN loss and a texture category called local binary patterns (LBP) on T2w images was shown. Furthermore, it was suggested that the loss or deletion of PTEN was more common in the CE tumor tissue samples compared to brain around tumor (or the NE tumor component).
The tumors with a lack of loss of PTEN (PTEN wildtypes) have been reported to occur most frequently in the left frontal lobe and the tumors with PTEN loss had a high likelihood of appearing in periventricular white matter regions near the posterior aspect of the left lateral ventricle (56), although this has not been confirmed by other researchers (59).
Signaling Pathways
The alterations such as deletions, amplifications or other mutations in glioblastoma impact genes that function in certain signaling pathways that control the oncogenesis processes and orient the mutations within wider signaling networks that further support the progression of cancer (48). Description of all signaling molecules and pathways involved in glioblastoma is out of scope of this paper. However, it is worthwhile to mention that the most frequently altered signaling pathways in glioblastomas are RTK/PTEN/PI3K (signal transduction), p53 (stress response), and Rb1 (cell cycle control) pathways (109,113).
Different signaling pathways have been tested against imaging traits. Liu et al (114) identified an angiogenic subgroup of glioblastoma, in which pathways associated with angiogenesis and hypoxia are activated. These patients showed a significantly longer survival when treated with anti-angiogenic therapies, suggesting a benefit of this targeted therapy for this patient subgroup. It has been suggested that radiologically-identified habitats (from a combination of low/high signal intensities on T1w/T1CE/T2w/T2-FLAIR images) could relate to pathways and cellular processes such as phosphorylation of STAT-1 and natural killer cell activity (115). The features quantifying the presence of edges, spots, and ripples (Law energy features) from the CE tumor component showed the best performance for predicting the response of glioblastomas to chemo-RT treatment and were significantly associated with PI3K/AKT/mTOR and apoptosis signaling pathways. The former pathway is involved in cell proliferation and survival, and the latter with cell death (116).
Molecular Subtypes
Gene expression profiling has revealed a convergence of the subtypes of glioblastoma into four expression-based molecular categories, namely classical, neural, proneural, and mesenchymal subtypes with somatic alterations (35). PDGFRA amplifications and IDH1 and TP53 mutations were most frequently found in the proneural group, EGFR alterations were mostly present in the classical group, and NF1 abnormalities were mainly categorized with mesenchymal GBM (35). These glioblastoma subtypes respond differently to aggressive therapies and the survival benefit of the patient from these therapies varies based on these molecular classes. The mesenchymal and classical subtypes benefit the most from the aforementioned therapies than the proneural group.
Radiogenomic studies have shown differences in the imaging features among different molecular glioblastoma subtypes and have supported the hypothesis of specific phenotypic appearance of each subtype on MRI. Volume of CE tumor, volume of central necrosis, combined volume of CE and central necrosis, and the ratio of T2-FLAIR to CE and necrosis were demonstrated to be significantly different in mesenchymal subtype of glioblastoma, as compared to non-mesenchymal subtypes. The best predictor of mesenchymal subtype has been indicated to be low volume ratio of T2 hyperintensity to contrast enhancement and central necrosis (117). Proneural glioblastomas seem to appear with a significantly lower level of CE (111,118). The mesenchymal subtype indicates lower level of non-enhanced tumor compared to other subtypes (111). This finding has further been supported in other studies that report the mesenchymal subtype to be significantly correlated with minimum intensity in the edema region, the classic subtype to be associated with edge sharpness and intensity within necrosis and peritumoral edematous/tumor-infiltrated regions, in the classical tumors compared to mesenchymal subtype, lower intensity in the edematous/tumor-infiltrated region has been observed (119). Accordingly, features of edge complexity have shown to significantly differentiate between mesenchymal and classical molecular subtypes (120). The edematous/tumor-infiltrated volume and total tumor volume have been suggested as the best predictors of glioblastoma molecular subtypes (40).
None of the rCBVmean or rCBVmax parameters calculated from DSC-MR images within the contrast-enhanced part of the lesion were correlated with the molecular subtypes. However, the combination of molecular classification with rCBVmean could be highly predictive of the patient’s overall survival (121). The added value of rCBV in the NE region (rCBVNER) of the tumor to morphologic, clinical, and genomic markers for predicting the overall survival has been sought and shown to increase the predictive performance (122).
CONSIDERATIONS AND CHALLENGES OF RADIOGENOMIC STUDIES
Radiogenomic studies intend to contribute to overcoming the current issue of tissue sampling error, as they can radiographically assess the whole tumor extent. Nevertheless, there are multiple challenges that the scientific community should be taking into consideration, in order to lead to more repeatable, clinically relevant, and hence more impactful results.
Need for Ample and Diverse Data
Ample and, importantly, diverse data are required to allow identification of robust radio-phenotypic patterns of specific molecular characteristics and produce generalizable biomarkers. Undeniably this need becomes more apparent with the advent of deep learning methodologies, which need a vast amount of data to learn meaningful patterns. Such big numbers and diversity cannot be found within a single institution and, currently, can only be found in retrospective datasets pooled across multiple institutions. There are a few public multi-institutional imaging datasets available via The Cancer Imaging Archive (TCIA, www.cancerimagingarchive.net) (123) that describe primarily data of standard clinical practice, as well as some clinical trial data, with corresponding molecular characterizations available in the National Cancer Institute’s Genomic Data Commons portal (NCI GDC, https://portal.gdc.cancer.gov/), as well as corresponding comprehensive proteomic data in the Clinical Proteomic Tumor Analysis Consortium (CPTAC, proteomics.cancer.gov) (124). Results of various existing studies have been made available through the “Analysis Results” dashboard of TCIA website (https://wiki.cancerimagingarchive.net/display/DOI/TCIA+Analysis+Results), enabling future studies to avoid repetition of the efforts and allow reproducibility. An example of such publicly-available results is the expert annotations of glioblastoma sub-regions (125), which have formed the ground truth for the data of the TCGA-GBM (126) and TCGA-LGG (127) collections included in the International brain tumor segmentation (BraTS) challenge (125,128). However, data of standard clinical practice are typically heterogeneous in their acquisition protocol (in terms of both the type of modalities used and their resolution), as well as in the course of treatment followed, which make the data size smaller after inclusion criteria and appropriate curation applies. On the other hand, imaging data from clinical trials follow a standardized acquisition protocol (129), albeit more difficult to be shared publicly due to data-ownership concerns.
Data Processing and Radiographic Feature Extraction
Various data processing routines and varying parameterization of computational methods add to the challenge of identifying ample and diverse data, as further sources of variation in quantitative analyses. In favor of reproducibility, appropriate comprehensive description of the methodological approaches used in radiogenomic studies, and their parameterization, should be at least documented if not distributed as open source implementations. This has been the primary aim of the international multi-institutional effort described by the Image Biomarker Standardization Initiative (IBSI) (130). IBSI attempts to appropriately summarize the mathematical formulation of such computational parameters (e.g., texture features), as well as document the minimum acceptable parameters that should be reported when such parameters are used in scientific studies, while accounting for the input modality.
The overarching goal of such methodological approaches is to extract comprehensive sets of computational parameters (i.e., radiographic features) capturing both visual and sub-visual cues of the underlying tissue structure and reflecting biological pathophysiology. The two main categories of features that are typically considered are based either on conventional radiomics or deep learning. Conventional radiomics have been primarily described by IBSI (130). The underlying principle of deep learning-based features is to learn patterns from large datasets and utilize them, for example, 1) as attention maps (131,132) to adjust the classifier weights on particular image regions, 2) as additional input modalities, and 3) through transfer learning (133).
We note that numerous radiogenomic studies have been implementing well-known parameters for their individual studies. In favor of reproducibility, multiple open-source software toolkits have been developed and made available, facilitating the extraction of various quantitative image characteristics and offering the potential for harmonized processing pipelines. Example of such software tools include, but are not limited to, 3D Slicer (www.slicer.org) (134), PyRadiomics (www.radiomics.io/pyradiomics.html) (135), and the Cancer Image Phenomics Toolkit (CaPTk, www.cbica.upenn.edu/captk) (136).
Curse of Dimensionality
It is commonly observed that the number of radiographic features can be significantly larger than the number of subjects involved in a study. This is expected to lead to a well-known issue in the domain of machine learning, overfitting the data used to train a machine-learning-based biomarker, therefore resulting to non-generalizable results. This is not to say that the extraction of radiographic features should be limited, as the more comprehensive the panel of extracted radiographic features, the more comprehensive the characterization of the region of interest. Nevertheless, this “curse of dimensionality” raises the need for appropriate cross-validation and feature selection methods. Cross-validation is a well-established way to provide unbiased performance estimates of a biomarker, quantitatively validate its generalization performance, and enable analysis of a given dataset as if independent retrospective and prospective cohorts existed, but in a more statistically robust manner by randomly permuting across the provided dataset (137). Feature selection results in ranking a large number of extracted features based on their descriptive/predictive power on the given dataset, while they account for feature collinearities and therefore redundancies.
FUTURE DIRECTIONS
Most radiogenomic studies have focused on predicting individual molecular characteristics from pre-operative baseline scans. Taking into consideration that the concept of precision medicine is defined by precise molecular tumor characterization, these studies may be considered redundant for actual patient management primarily for two reasons. First, in many cancers, we note disruptions of multiple pathways (therefore associative multi-mutational status) for a single patient, instead of an individual molecular characteristic. Second, such radiogenomic studies revolve around precision medicine, whereas in most situations precise tumor characterization will occur anyway, histopathologically, after radiographically identifying a brain tumor suspected of being a glioblastoma.
On the other hand, it has become apparent that glioblastoma molecular characteristics show spatiotemporal heterogeneity, described by either loss of mutant expression at the time of progression (138) or after treatment, both following standard chemo-radiation (139) and peptide vaccination (140) creating an even further complicated picture (141). This is where radiogenomic studies could contribute.
Taking all the above into consideration, there is a need for future directions of radiogenomic studies focusing on the concept of personalized/adaptive medicine, instead of revolving around precision medicine. This would allow to potentially determine if baseline (developed in the primary tumor) radio-phenotypes are preserved in follow up scans irrespective of treatment, thereby recognizing the historic molecular profiling of recurrent tumors, or if there are radio-phenotypical variations over time that would allow the non-invasive longitudinal monitoring of mutational status, thereby evaluating treatment response.
Exemplar computational studies have shown promise on training machine-learning-based models across multiple institutions without sharing patient data (142,143). Such distributed learning approaches could be investigated further in radiogenomic studies, thereby addressing the issue of identifying ample and diverse datasets while also overcoming the various data-ownership concerns, and facilitating the exploitation of the full potential of homogenized clinical trial data.
Finally, the bi-disciplinary radiogenomic studies started to expand naturally towards synergistic analyses of radiographic, histopathologic, genetic, and clinical information. Such radio-patho-genomic analyses should speed up scientific discovery and lead to quantitative integrated evaluations of patient data on multiple scales, with the intention of contributing towards improving personalized and precision medicine. These integrated diagnostic approaches could contribute on the specificity of radio-phenotypes associated to distinct molecular signatures, that current radiogenomic studies have proved only for 2HG MRS (64).
CONCLUSION
Radio-phenotypical (MRI) signatures can assist in tackling the spatiotemporal heterogeneity concern, as well as in detecting properties relating to tumor structure, perfusion/neo-angiogenesis, cellular distribution/density, and metabolic processes. Mounting ongoing research, investigating the connections between radiographic signatures and underlying genetic changes in glioblastoma, have supported the idea that these alterations are followed by radio-phenotypic manifestations. However, current findings are substantially divergent. The reason lies in a) inter-patient heterogeneity of glioblastoma, b) the lack of large cohorts that can represent this heterogeneity, and c) missing standardized multi-institutional guidelines for systematic image acquisition and analysis. With maturation of radiogenomic studies through incorporation of machine-learning methods for systematic and reproducible methods, there is a hope to find specific radio-phenotypic models that reveal the Achilles heel of glioblastoma and encourage personalized targeted therapies.
ACKNOWLEDGMENTS
The authors would like to express their gratitude to Jessica Incmikoski for the revision of the language.
Grant Support: This work was supported by NINDS/NIH: R01NS042645, NCI/NIH: U24CA189523, NCATS/NIH: UL1TR001878, and the ITMAT of the University of Pennsylvania.
ABBREVIATIONS
- 2HG
2-hydroxy-glutarate
- ADC
Apparent Diffusion Coefficient
- ASL
Arterial Spin Labeling
- (r)CBF
(Regional or Relative) Cerebral Blood Flow
- (r)CBV
(Regional or Relative) Cerebral Blood Volume
- CE
Contrast-Enhancing Tumor
- Cho
Choline metabolite
- CNS
Central nervous system
- Cr
Creatine metabolite
- DCE-MRI
Dynamic Contrast-Enhanced MRI
- DNA
Deoxyribonucleic Acid
- DSC-MRI
Dynamic Susceptibility-weighted Contrast-enhanced MRI
- DTI
Diffusion Tensor Imaging
- DWI
Diffusion Weighted Imaging
- EGF(R)
Epidermal Growth Factor (Receptor)
- EPI (+C)
Echo-Planar Imaging (+Contrast)
- FA
Fractional Anisotropy
- FGFR
Fibroblast Growth Factor Receptor
- FLAIR
Fluid Attenuated Inversion Recovery
- GBM
Glioblastoma (formerly known as Glioblastoma Multiforme)
- Glx
Glutamate and Glutamine metabolite
- HIF1A
Hypoxia Inducible Factor 1 Subunit Alpha
- IDH
Isocitrate DeHydrogenase
- Kep
flux rate constant
- Ktrans
The volume transfer constant
- MD
Mean Diffusivity
- MGMT
O6 Methylguanine-DNA Methyltransferase
- miRNA
microRNA
- MRI
Magnetic Resonance Imaging
- MRS
Magnetic Resonance Spectroscopy
- NAA
N-acetylaspartate metabolite
- NE
Non-enhancing Tumor
- NF1
Neurofibromin 1
- NGS
Next Generation Sequencing
- PDGF(R)
Platelet-Derived Growth Factor (Receptor)
- POSTN
Periostin gene
- PH
Peak Height
- PI3K
Phosphoinositide 3-kinase
- PIK3CA
Phosphatidylinositol-4,5-bisphosphate 3-Kinase Catalytic subunit Alpha
- PSR
Percentage of Signal Recovery
- PTEN
Phosphatase and Tensin homolog
- RNA
Ribonucleic Acid
- RTK
Receptor Tyrosine Kinases
- SVZ
Subventricular Zone
- T1CE
Contrast-Enhanced T1-weighted MRI
- T1w
T1-weighted MRI
- T2w
T2-weighted MRI
- TERT
Telomerase Reverse Transcriptase
- TP53 (or p53)
Tumor protein p53
- Ve
extracellular volume ratio
- VEGF(R)
Vascular Endothelial Growth Factor (Receptor)
- VS
Vessel Size
- WES
Whole Exome Sequencing
- WGS
Whole Genome Sequencing
- WHO
World Health Organization
REFERENCES
- 1.Davis ME. Glioblastoma: overview of disease and treatment. Clinical journal of oncology nursing 2016;20(5):S2. [DOI] [PMC free article] [PubMed] [Google Scholar]
- 2.Stupp R, Taillibert S, Kanner A, et al. Effect of tumor-treating fields plus maintenance temozolomide vs maintenance temozolomide alone on survival in patients with glioblastoma: a randomized clinical trial. Jama 2017;318(23):2306–2316. [DOI] [PMC free article] [PubMed] [Google Scholar]
- 3.Barnholtz-Sloan JS, Ostrom QT, Cote D. Epidemiology of Brain Tumors. Neurologic clinics 2018;36(3):395–419. [DOI] [PubMed] [Google Scholar]
- 4.Wang Y, Jiang T. Understanding high grade glioma: molecular mechanism, therapy and comprehensive management. Cancer letters 2013;331(2):139–146. [DOI] [PubMed] [Google Scholar]
- 5.Furnari FB, Fenton T, Bachoo RM, et al. Malignant astrocytic glioma: genetics, biology, and paths to treatment. Genes & development 2007;21(21):2683–2710. [DOI] [PubMed] [Google Scholar]
- 6.Claes A, Idema AJ, Wesseling P. Diffuse glioma growth: a guerilla war. Acta neuropathologica 2007;114(5):443–458. [DOI] [PMC free article] [PubMed] [Google Scholar]
- 7.Prados MD, Byron SA, Tran NL, et al. Toward precision medicine in glioblastoma: the promise and the challenges. Neuro-oncology 2015;17(8):1051–1063. [DOI] [PMC free article] [PubMed] [Google Scholar]
- 8.Gatenby RA, Grove O, Gillies RJ. Quantitative imaging in cancer evolution and ecology. Radiology 2013;269(1):8–14. [DOI] [PMC free article] [PubMed] [Google Scholar]
- 9.Gerlinger M, Rowan AJ, Horswell S, et al. Intratumor heterogeneity and branched evolution revealed by multiregion sequencing. New England journal of medicine 2012;366(10):883–892. [DOI] [PMC free article] [PubMed] [Google Scholar]
- 10.Greaves M, Maley CC. Clonal evolution in cancer. Nature 2012;481(7381):306. [DOI] [PMC free article] [PubMed] [Google Scholar]
- 11.Young JS, Prados MD, Butowski N. Using genomics to guide treatment for glioblastoma. Pharmacogenomics 2018;19(15):1217–1229. [DOI] [PubMed] [Google Scholar]
- 12.Louis DN, Perry A, Reifenberger G, et al. The 2016 World Health Organization classification of tumors of the central nervous system: a summary. Acta neuropathologica 2016;131(6):803–820. [DOI] [PubMed] [Google Scholar]
- 13.Fathi Kazerooni A, Nabil M, Zeinali Zadeh M, et al. Characterization of active and infiltrative tumorous subregions from normal tissue in brain gliomas using multiparametric MRI. Journal of Magnetic Resonance Imaging 2018;48(4):938–950. [DOI] [PMC free article] [PubMed] [Google Scholar]
- 14.Raptopoulos V, Tsai L. Introduction to Radiogenomics Imaging in Clinical Oncology: Springer; 2018. p. 71–78. [Google Scholar]
- 15.Kuo MD, Jamshidi N. Behind the numbers: decoding molecular phenotypes with radiogenomics—guiding principles and technical considerations. Radiology 2014;270(2):320–325. [DOI] [PubMed] [Google Scholar]
- 16.Pinker K, Shitano F, Sala E, et al. Background, current role, and potential applications of radiogenomics. Journal of magnetic resonance imaging : JMRI 2018;47(3):604–620. [DOI] [PMC free article] [PubMed] [Google Scholar]
- 17.Nobusawa S, Watanabe T, Kleihues P, Ohgaki H. IDH1 mutations as molecular signature and predictive factor of secondary glioblastomas. Clinical Cancer Research 2009;15(19):6002–6007. [DOI] [PubMed] [Google Scholar]
- 18.Ohgaki H, Kleihues P. The definition of primary and secondary glioblastoma. Clinical cancer research 2013;19(4):764–772. [DOI] [PubMed] [Google Scholar]
- 19.Watanabe K, Tachibana O, Sato K, Yonekawa Y, Kleihues P, Ohgaki H. Overexpression of the EGF receptor and p53 mutations are mutually exclusive in the evolution of primary and secondary glioblastomas. Brain pathology 1996;6(3):217–223. [DOI] [PubMed] [Google Scholar]
- 20.Kline CN, Joseph NM, Grenert JP, et al. Targeted next-generation sequencing of pediatric neuro-oncology patients improves diagnosis, identifies pathogenic germline mutations, and directs targeted therapy. Neuro-oncology 2016;19(5):699–709. [DOI] [PMC free article] [PubMed] [Google Scholar]
- 21.Korshunov A, Ryzhova M, Hovestadt V, et al. Integrated analysis of pediatric glioblastoma reveals a subset of biologically favorable tumors with associated molecular prognostic markers. Acta neuropathologica 2015;129(5):669–678. [DOI] [PubMed] [Google Scholar]
- 22.Prados MD, Byron SA, Tran NL, et al. Toward precision medicine in glioblastoma: the promise and the challenges. Neuro-oncology 2015;17(8):1051–1063. [DOI] [PMC free article] [PubMed] [Google Scholar]
- 23.Yap TA, Gerlinger M, Futreal PA, Pusztai L, Swanton C. Intratumor heterogeneity: seeing the wood for the trees. Science translational medicine 2012;4(127):127ps110–127ps110. [DOI] [PubMed] [Google Scholar]
- 24.Dregely I, Prezzi D, Kelly‐Morland C, Roccia E, Neji R, Goh V. Imaging biomarkers in oncology: Basics and application to MRI. Journal of Magnetic Resonance Imaging 2018;48(1):13–26. [DOI] [PMC free article] [PubMed] [Google Scholar]
- 25.Zinn PO, Mahmood Z, Elbanan MG, Colen RR. Imaging genomics in gliomas. The Cancer Journal 2015;21(3):225–234. [DOI] [PubMed] [Google Scholar]
- 26.Gillies RJ, Kinahan PE, Hricak H. Radiomics: images are more than pictures, they are data. Radiology 2015;278(2):563–577. [DOI] [PMC free article] [PubMed] [Google Scholar]
- 27.Napel S, Mu W, Jardim‐Perassi BV, Aerts HJ, Gillies RJ. Quantitative imaging of cancer in the postgenomic era: Radio (geno) mics, deep learning, and habitats. Cancer 2018;124(24):4633–4649. [DOI] [PMC free article] [PubMed] [Google Scholar]
- 28.Van Meter T, Dumur C, Hafez N, Garrett C, Fillmore H, Broaddus WC. Microarray analysis of MRI-defined tissue samples in glioblastoma reveals differences in regional expression of therapeutic targets. Diagnostic Molecular Pathology 2006;15(4):195–205. [DOI] [PubMed] [Google Scholar]
- 29.Diehn M, Nardini C, Wang DS, et al. Identification of noninvasive imaging surrogates for brain tumor gene-expression modules. Proceedings of the National Academy of Sciences 2008;105(13):5213–5218. [DOI] [PMC free article] [PubMed] [Google Scholar]
- 30.Pope WB, Chen JH, Dong J, et al. Relationship between gene expression and enhancement in glioblastoma multiforme: exploratory DNA microarray analysis. Radiology 2008;249(1):268–277. [DOI] [PMC free article] [PubMed] [Google Scholar]
- 31.Kong D-S, Kim J, Lee I-H, et al. Integrative radiogenomic analysis for multicentric radiophenotype in glioblastoma. Oncotarget 2016;7(10):11526. [DOI] [PMC free article] [PubMed] [Google Scholar]
- 32.Nicolasjilwan M, Hu Y, Yan C, et al. Addition of MR imaging features and genetic biomarkers strengthens glioblastoma survival prediction in TCGA patients. Journal of Neuroradiology 2015;42(4):212–221. [DOI] [PMC free article] [PubMed] [Google Scholar]
- 33.Itakura H, Achrol AS, Mitchell LA, et al. Magnetic resonance image features identify glioblastoma phenotypic subtypes with distinct molecular pathway activities. Science translational medicine 2015;7(303):303ra138–303ra138. [DOI] [PMC free article] [PubMed] [Google Scholar]
- 34.Rathore S, Akbari H, Rozycki M, et al. Radiomic MRI signature reveals three distinct subtypes of glioblastoma with different clinical and molecular characteristics, offering prognostic value beyond IDH1. Scientific reports 2018;8(1):5087. [DOI] [PMC free article] [PubMed] [Google Scholar]
- 35.Verhaak RG, Hoadley KA, Purdom E, et al. Integrated genomic analysis identifies clinically relevant subtypes of glioblastoma characterized by abnormalities in PDGFRA, IDH1, EGFR, and NF1. Cancer cell 2010;17(1):98–110. [DOI] [PMC free article] [PubMed] [Google Scholar]
- 36.Zinn PO, Majadan B, Sathyan P, et al. Radiogenomic mapping of edema/cellular invasion MRI-phenotypes in glioblastoma multiforme. PloS one 2011;6(10):e25451. [DOI] [PMC free article] [PubMed] [Google Scholar]
- 37.Zinn PO, Sathyan P, Mahajan B, et al. A novel volume-age-KPS (VAK) glioblastoma classification identifies a prognostic cognate microRNA-gene signature. PloS one 2012;7(8):e41522. [DOI] [PMC free article] [PubMed] [Google Scholar]
- 38.Jamshidi N, Diehn M, Bredel M, Kuo MD. Illuminating radiogenomic characteristics of glioblastoma multiforme through integration of MR imaging, messenger RNA expression, and DNA copy number variation. Radiology 2013;270(1):1–2. [DOI] [PMC free article] [PubMed] [Google Scholar]
- 39.Colen RR, Wang J, Singh SK, Gutman DA, Zinn PO. Glioblastoma: imaging genomic mapping reveals sex-specific oncogenic associations of cell death. Radiology 2014;275(1):215–227. [DOI] [PubMed] [Google Scholar]
- 40.Grossmann P, Gutman DA, Dunn WD, Holder CA, Aerts HJ. Imaging-genomics reveals driving pathways of MRI derived volumetric tumor phenotype features in Glioblastoma. BMC cancer 2016;16(1):611. [DOI] [PMC free article] [PubMed] [Google Scholar]
- 41.Cui Y, Ren S, Tha KK, Wu J, Shirato H, Li R. Volume of high-risk intratumoral subregions at multi-parametric MR imaging predicts overall survival and complements molecular analysis of glioblastoma. European radiology 2017;27(9):3583–3592. [DOI] [PubMed] [Google Scholar]
- 42.Zinn PO, Hatami M, Youssef E, et al. Diffusion weighted magnetic resonance imaging radiophenotypes and associated molecular pathways in glioblastoma. Neurosurgery 2016;63(CN_suppl_1):127–135. [DOI] [PubMed] [Google Scholar]
- 43.Heiland DH, Simon-Gabriel CP, Demerath T, et al. Integrative diffusion-weighted imaging and radiogenomic network analysis of glioblastoma multiforme. Scientific reports 2017;7:43523. [DOI] [PMC free article] [PubMed] [Google Scholar]
- 44.Barajas RF Jr, Hodgson JG, Chang JS, et al. Glioblastoma multiforme regional genetic and cellular expression patterns: influence on anatomic and physiologic MR imaging. Radiology 2010;254(2):564–576. [DOI] [PMC free article] [PubMed] [Google Scholar]
- 45.Heiland DH, Demerath T, Kellner E, et al. Molecular differences between cerebral blood volume and vessel size in glioblastoma multiforme. Oncotarget 2017;8(7):11083. [DOI] [PMC free article] [PubMed] [Google Scholar]
- 46.Kong D- S, Kim J, Ryu G, et al. Quantitative radiomic profiling of glioblastoma represents transcriptomic expression. Oncotarget 2018;9(5):6336. [DOI] [PMC free article] [PubMed] [Google Scholar]
- 47.Heiland DH, Mader I, Schlosser P, et al. Integrative network-based analysis of magnetic resonance spectroscopy and genome wide expression in glioblastoma multiforme. Scientific reports 2016;6:29052. [DOI] [PMC free article] [PubMed] [Google Scholar]
- 48.Sever R, Brugge JS. Signal transduction in cancer. Cold Spring Harbor perspectives in medicine 2015;5(4):a006098. [DOI] [PMC free article] [PubMed] [Google Scholar]
- 49.SongTao Q, Lei Y, Si G, et al. IDH mutations predict longer survival and response to temozolomide in secondary glioblastoma. Cancer science 2012;103(2):269–273. [DOI] [PubMed] [Google Scholar]
- 50.Weller M, Felsberg J, Hartmann C, et al. Molecular predictors of progression-free and overall survival in patients with newly diagnosed glioblastoma: a prospective translational study of the German Glioma Network. Journal of Clinical Oncology 2009;27(34):5743–5750. [DOI] [PubMed] [Google Scholar]
- 51.Hartmann C, Hentschel B, Wick W, et al. Patients with IDH1 wild type anaplastic astrocytomas exhibit worse prognosis than IDH1-mutated glioblastomas, and IDH1 mutation status accounts for the unfavorable prognostic effect of higher age: implications for classification of gliomas. Acta neuropathologica 2010;120(6):707–718. [DOI] [PubMed] [Google Scholar]
- 52.Chang P, Grinband J, Weinberg B, et al. Deep-learning convolutional neural networks accurately classify genetic mutations in gliomas. American Journal of Neuroradiology 2018;39(7):1201–1207. [DOI] [PMC free article] [PubMed] [Google Scholar]
- 53.Carrillo J, Lai A, Nghiemphu P, et al. Relationship between tumor enhancement, edema, IDH1 mutational status, MGMT promoter methylation, and survival in glioblastoma. American Journal of Neuroradiology 2012;33(7):1349–1355. [DOI] [PMC free article] [PubMed] [Google Scholar]
- 54.Hong EK, Choi SH, Shin DJ, et al. Radiogenomics correlation between MR imaging features and major genetic profiles in glioblastoma. European radiology 2018;28(10):4350–4361. [DOI] [PubMed] [Google Scholar]
- 55.Yamashita K, Hiwatashi A, Togao O, et al. MR imaging–based analysis of glioblastoma multiforme: Estimation of IDH1 mutation status. American Journal of Neuroradiology 2016;37(1):58–65. [DOI] [PMC free article] [PubMed] [Google Scholar]
- 56.Ellingson B, Lai A, Harris R, et al. Probabilistic radiographic atlas of glioblastoma phenotypes. American Journal of neuroradiology 2013;34(3):533–540. [DOI] [PMC free article] [PubMed] [Google Scholar]
- 57.Altieri R, Zenga F, Ducati A, et al. Tumor location and patient age predict biological signatures of high-grade gliomas. Neurosurgical review 2018;41(2):599–604. [DOI] [PubMed] [Google Scholar]
- 58.Arita H, Kinoshita M, Kawaguchi A, et al. Lesion location implemented magnetic resonance imaging radiomics for predicting IDH and TERT promoter mutations in grade II/III gliomas. Scientific reports 2018;8(1):11773. [DOI] [PMC free article] [PubMed] [Google Scholar]
- 59.Tejada Neyra MA, Neuberger U, Reinhardt A, et al. Voxel-wise radiogenomic mapping of tumor location with key molecular alterations in patients with glioma. Neuro-oncology 2018;20(11):1517–1524. [DOI] [PMC free article] [PubMed] [Google Scholar]
- 60.Pope WB, Prins RM, Thomas MA, et al. Non-invasive detection of 2-hydroxyglutarate and other metabolites in IDH1 mutant glioma patients using magnetic resonance spectroscopy. Journal of neuro-oncology 2012;107(1):197–205. [DOI] [PMC free article] [PubMed] [Google Scholar]
- 61.Andronesi OC, Rapalino O, Gerstner E, et al. Detection of oncogenic IDH1 mutations using magnetic resonance spectroscopy of 2-hydroxyglutarate. The Journal of clinical investigation 2013;123(9):3659–3663. [DOI] [PMC free article] [PubMed] [Google Scholar]
- 62.Choi C, Ganji SK, DeBerardinis RJ, et al. 2-hydroxyglutarate detection by magnetic resonance spectroscopy in IDH-mutated patients with gliomas. Nature medicine 2012;18(4):624. [DOI] [PMC free article] [PubMed] [Google Scholar]
- 63.Andronesi OC, Arrillaga-Romany IC, Ly KI, et al. Pharmacodynamics of mutant-IDH1 inhibitors in glioma patients probed by in vivo 3D MRS imaging of 2-hydroxyglutarate. Nature communications 2018;9(1):1474. [DOI] [PMC free article] [PubMed] [Google Scholar]
- 64.Kickingereder P, Andronesi OC. Radiomics, metabolic, and molecular MRI for brain tumors Seminars in neurology. Volume 38: Thieme Medical Publishers; 2018. p. 032–040. [DOI] [PubMed] [Google Scholar]
- 65.Thon N, Kreth S, Kreth F- W. Personalized treatment strategies in glioblastoma: MGMT promoter methylation status. OncoTargets and therapy 2013;6:1363. [DOI] [PMC free article] [PubMed] [Google Scholar]
- 66.Weller M, Stupp R, Reifenberger G, et al. MGMT promoter methylation in malignant gliomas: ready for personalized medicine? Nature reviews Neurology 2010;6(1):39. [DOI] [PubMed] [Google Scholar]
- 67.Minniti G, Lanzetta G, Scaringi C, et al. Phase II study of short-course radiotherapy plus concomitant and adjuvant temozolomide in elderly patients with glioblastoma. International Journal of Radiation Oncology* Biology* Physics 2012;83(1):93–99. [DOI] [PubMed] [Google Scholar]
- 68.Wick W, Platten M, Meisner C, et al. Temozolomide chemotherapy alone versus radiotherapy alone for malignant astrocytoma in the elderly: the NOA-08 randomised, phase 3 trial. The lancet oncology 2012;13(7):707–715. [DOI] [PubMed] [Google Scholar]
- 69.Brandes AA, Franceschi E, Tosoni A, et al. MGMT promoter methylation status can predict the incidence and outcome of pseudoprogression after concomitant radiochemotherapy in newly diagnosed glioblastoma patients. Journal of Clinical Oncology 2008;26(13):2192–2197. [DOI] [PubMed] [Google Scholar]
- 70.Ahn SS, Shin N- Y, Chang JH, et al. Prediction of methylguanine methyltransferase promoter methylation in glioblastoma using dynamic contrast-enhanced magnetic resonance and diffusion tensor imaging. Journal of neurosurgery 2014;121(2):367–373. [DOI] [PubMed] [Google Scholar]
- 71.Rundle‐Thiele D, Day B, Stringer B, et al. Using the apparent diffusion coefficient to identifying MGMT promoter methylation status early in glioblastoma: importance of analytical method. Journal of medical radiation sciences 2015;62(2):92–98. [DOI] [PMC free article] [PubMed] [Google Scholar]
- 72.Korfiatis P, Kline TL, Coufalova L, et al. MRI texture features as biomarkers to predict MGMT methylation status in glioblastomas. Medical physics 2016;43(6Part1):2835–2844. [DOI] [PMC free article] [PubMed] [Google Scholar]
- 73.Li Z- C, Bai H, Sun Q, et al. Multiregional radiomics features from multiparametric MRI for prediction of MGMT methylation status in glioblastoma multiforme: A multicentre study. European radiology 2018;28(9):3640–3650. [DOI] [PubMed] [Google Scholar]
- 74.Kickingereder P, Neuberger U, Bonekamp D, et al. Radiomic subtyping improves disease stratification beyond key molecular, clinical, and standard imaging characteristics in patients with glioblastoma. Neuro-oncology 2017;20(6):848–857. [DOI] [PMC free article] [PubMed] [Google Scholar]
- 75.Bae S, Choi YS, Ahn SS, et al. Radiomic MRI Phenotyping of Glioblastoma: Improving Survival Prediction. Radiology 2018;289(3):797–806. [DOI] [PubMed] [Google Scholar]
- 76.Ellingson BM, Cloughesy TF, Pope WB, et al. Anatomic localization of O6-methylguanine DNA methyltransferase (MGMT) promoter methylated and unmethylated tumors: a radiographic study in 358 de novo human glioblastomas. Neuroimage 2012;59(2):908–916. [DOI] [PubMed] [Google Scholar]
- 77.Nazarenko I, Hede S- M, He X, et al. PDGF and PDGF receptors in glioma. Upsala journal of medical sciences 2012;117(2):99–112. [DOI] [PMC free article] [PubMed] [Google Scholar]
- 78.Andrae J, Gallini R, Betsholtz C. Role of platelet-derived growth factors in physiology and medicine. Genes & development 2008;22(10):1276–1312. [DOI] [PMC free article] [PubMed] [Google Scholar]
- 79.Fleming TP, Saxena A, Clark WC, et al. Amplification and/or overexpression of platelet-derived growth factor receptors and epidermal growth factor receptor in human glial tumors. Cancer research 1992;52(16):4550–4553. [PubMed] [Google Scholar]
- 80.Bloch O, Lim M, Sughrue ME, et al. Autologous heat shock protein peptide vaccination for newly diagnosed glioblastoma: impact of peripheral PD-L1 expression on response to therapy. Clinical Cancer Research 2017;23(14):3575–3584. [DOI] [PMC free article] [PubMed] [Google Scholar]
- 81.Gutman DA, Dunn WD, Grossmann P, et al. Somatic mutations associated with MRI-derived volumetric features in glioblastoma. Neuroradiology 2015;57(12):1227–1237. [DOI] [PMC free article] [PubMed] [Google Scholar]
- 82.Hu LS, Ning S, Eschbacher JM, et al. Radiogenomics to characterize regional genetic heterogeneity in glioblastoma. Neuro-oncology 2016;19(1):128–137. [DOI] [PMC free article] [PubMed] [Google Scholar]
- 83.Reardon DA, Turner S, Peters KB, et al. A review of VEGF/VEGFR-targeted therapeutics for recurrent glioblastoma. Journal of the National Comprehensive Cancer Network 2011;9(4):414–427. [DOI] [PMC free article] [PubMed] [Google Scholar]
- 84.Reardon DA, Wen PY, Desjardins A, Batchelor TT, Vredenburgh JJ. Glioblastoma multiforme: an emerging paradigm of anti-VEGF therapy. Expert opinion on biological therapy 2008;8(4):541–553. [DOI] [PMC free article] [PubMed] [Google Scholar]
- 85.Shibuya M Vascular endothelial growth factor (VEGF) and its receptor (VEGFR) signaling in angiogenesis: a crucial target for anti-and pro-angiogenic therapies. Genes & cancer 2011;2(12):1097–1105. [DOI] [PMC free article] [PubMed] [Google Scholar]
- 86.Shergalis A, Bankhead A, Luesakul U, Muangsin N, Neamati N. Current challenges and opportunities in treating glioblastoma. Pharmacological reviews 2018;70(3):412–445. [DOI] [PMC free article] [PubMed] [Google Scholar]
- 87.Beig N, Patel J, Prasanna P, et al. Radiogenomic analysis of hypoxia pathway is predictive of overall survival in Glioblastoma. Scientific reports 2018;8(1):7. [DOI] [PMC free article] [PubMed] [Google Scholar]
- 88.Beig N, Patel J, Prasanna P, et al. Radiogenomic analysis of hypoxia pathway reveals computerized MRI descriptors predictive of overall survival in glioblastoma Medical Imaging 2017: Computer-Aided Diagnosis. Volume 10134: International Society for Optics and Photonics; 2017. p. 101341U. [Google Scholar]
- 89.Miller KJ, Berendsen S, Seute T, et al. Fractal structure in the volumetric contrast enhancement of malignant gliomas as a marker of oxidative metabolic pathway gene expression. Translational Cancer Research 2017;6(6):1275–1282. [Google Scholar]
- 90.Health NIo. 2019.
- 91.Huang PH, Xu AM, White FM. Oncogenic EGFR signaling networks in glioma. Sci Signal 2009;2(87):re6–re6. [DOI] [PubMed] [Google Scholar]
- 92.Xu H, Zong H, Ma C, et al. Epidermal growth factor receptor in glioblastoma. Oncology letters 2017;14(1):512–516. [DOI] [PMC free article] [PubMed] [Google Scholar]
- 93.Hatanpaa KJ, Burma S, Zhao D, Habib AA. Epidermal growth factor receptor in glioma: signal transduction, neuropathology, imaging, and radioresistance. Neoplasia 2010;12(9):675–684. [DOI] [PMC free article] [PubMed] [Google Scholar]
- 94.Westphal M, Maire CL, Lamszus K. EGFR as a target for glioblastoma treatment: an unfulfilled promise. CNS drugs 2017;31(9):723–735. [DOI] [PMC free article] [PubMed] [Google Scholar]
- 95.Zhu J-J T Wong E. Personalized medicine for glioblastoma: current challenges and future opportunities. Current molecular medicine 2013;13(3):358–367. [PubMed] [Google Scholar]
- 96.Lal A, Glazer CA, Martinson HM, et al. Mutant epidermal growth factor receptor up-regulates molecular effectors of tumor invasion. Cancer research 2002;62(12):3335–3339. [PubMed] [Google Scholar]
- 97.Okada Y, Hurwitz EE, Esposito JM, Brower MA, Nutt CL, Louis DN. Selection pressures of TP53 mutation and microenvironmental location influence epidermal growth factor receptor gene amplification in human glioblastomas. Cancer research 2003;63(2):413–416. [PubMed] [Google Scholar]
- 98.Aghi M, Gaviani P, Henson JW, Batchelor TT, Louis DN, Barker FG. Magnetic resonance imaging characteristics predict epidermal growth factor receptor amplification status in glioblastoma. Clinical Cancer Research 2005;11(24):8600–8605. [DOI] [PubMed] [Google Scholar]
- 99.Bosnyák E, Michelhaugh SK, Klinger NV, et al. Prognostic molecular and imaging biomarkers in primary glioblastoma. Clinical nuclear medicine 2017;42(5):341. [DOI] [PMC free article] [PubMed] [Google Scholar]
- 100.Bale TA, Jordan JT, Rapalino O, et al. Financially Effective Test-Algorithm to Identify an Aggressive, EGFR-amplified Variant of IDH-Wildtype, Lower-Grade Diffuse Glioma. Neuro-oncology 2018. [DOI] [PMC free article] [PubMed] [Google Scholar]
- 101.Arevalo-Perez J, Thomas A, Kaley T, et al. T1-weighted dynamic contrast-enhanced MRI as a noninvasive biomarker of epidermal growth factor receptor vIII status. American Journal of Neuroradiology 2015;36(12):2256–2261. [DOI] [PMC free article] [PubMed] [Google Scholar]
- 102.Gupta A, Young R, Shah A, et al. Pretreatment dynamic susceptibility contrast MRI perfusion in glioblastoma: prediction of EGFR gene amplification. Clinical neuroradiology 2015;25(2):143–150. [DOI] [PMC free article] [PubMed] [Google Scholar]
- 103.Bakas S, Akbari H, Pisapia J, et al. In vivo detection of EGFRvIII in glioblastoma via perfusion magnetic resonance imaging signature consistent with deep peritumoral infiltration: the φ-index. Clinical Cancer Research 2017;23(16):4724–4734. [DOI] [PMC free article] [PubMed] [Google Scholar]
- 104.Akbari H, Bakas S, Pisapia JM, et al. In vivo evaluation of EGFRvIII mutation in primary glioblastoma patients via complex multiparametric MRI signature. Neuro-oncology 2018;20(8):1068–1079. [DOI] [PMC free article] [PubMed] [Google Scholar]
- 105.Bilello M, Akbari H, Da X, et al. Population-based MRI atlases of spatial distribution are specific to patient and tumor characteristics in glioblastoma. NeuroImage: Clinical 2016;12:34–40. [DOI] [PMC free article] [PubMed] [Google Scholar]
- 106.Smith JS, Tachibana I, Passe SM, et al. PTEN mutation, EGFR amplification, and outcome in patients with anaplastic astrocytoma and glioblastoma multiforme. Journal of the National Cancer Institute 2001;93(16):1246–1256. [DOI] [PubMed] [Google Scholar]
- 107.Han F, Hu R, Yang H, et al. PTEN gene mutations correlate to poor prognosis in glioma patients: a meta-analysis. OncoTargets and therapy 2016;9:3485. [DOI] [PMC free article] [PubMed] [Google Scholar]
- 108.Koul D PTEN signaling pathways in glioblastoma. Cancer biology & therapy 2008;7(9):1321–1325. [DOI] [PubMed] [Google Scholar]
- 109.Belden CJ, Valdes PA, Ran C, et al. Genetics of glioblastoma: a window into its imaging and histopathologic variability. Radiographics : a review publication of the Radiological Society of North America, Inc 2011;31(6):1717–1740. [DOI] [PMC free article] [PubMed] [Google Scholar]
- 110.Ma J, Benitez JA, Li J, et al. Inhibition of nuclear PTEN tyrosine phosphorylation enhances glioma radiation sensitivity through attenuated DNA repair. Cancer cell 2019;35(3):504–518. e507. [DOI] [PMC free article] [PubMed] [Google Scholar]
- 111.Gutman DA, Cooper LA, Hwang SN, et al. MR imaging predictors of molecular profile and survival: multi-institutional study of the TCGA glioblastoma data set. Radiology 2013;267(2):560–569. [DOI] [PMC free article] [PubMed] [Google Scholar]
- 112.Kickingereder P, Bonekamp D, Nowosielski M, et al. Radiogenomics of glioblastoma: machine learning–based classification of molecular characteristics by using multiparametric and multiregional MR imaging features. Radiology 2016;281(3):907–918. [DOI] [PubMed] [Google Scholar]
- 113.Verhaak RG. Moving the needle: Optimizing classification for glioma. Science translational medicine 2016;8(350):350fs314–350fs314. [DOI] [PubMed] [Google Scholar]
- 114.Liu TT, Achrol AS, Mitchell LA, et al. Magnetic resonance perfusion image features uncover an angiogenic subgroup of glioblastoma patients with poor survival and better response to antiangiogenic treatment. Neuro-oncology 2016;19(7):997–1007. [DOI] [PMC free article] [PubMed] [Google Scholar]
- 115.Dextraze K, Saha A, Kim D, et al. Spatial habitats from multiparametric MR imaging are associated with signaling pathway activities and survival in glioblastoma. Oncotarget 2017;8(68):112992–113001. [DOI] [PMC free article] [PubMed] [Google Scholar]
- 116.Beig N, Prasanna P, Hill V, et al. Radiogenomic characterization of response to chemo-radiation therapy in glioblastoma is associated with PI3K/AKT/mTOR and apoptosis signaling pathways Medical Imaging 2019: Computer-Aided Diagnosis. Volume 10950: International Society for Optics and Photonics; 2019. p. 109501B. [Google Scholar]
- 117.Naeini KM, Pope WB, Cloughesy TF, et al. Identifying the mesenchymal molecular subtype of glioblastoma using quantitative volumetric analysis of anatomic magnetic resonance images. Neuro-oncology 2013;15(5):626–634. [DOI] [PMC free article] [PubMed] [Google Scholar]
- 118.Macyszyn L, Akbari H, Pisapia JM, et al. Imaging patterns predict patient survival and molecular subtype in glioblastoma via machine learning techniques. Neuro-oncology 2015;18(3):417–425. [DOI] [PMC free article] [PubMed] [Google Scholar]
- 119.Gevaert O, Mitchell LA, Achrol AS, et al. Glioblastoma multiforme: exploratory radiogenomic analysis by using quantitative image features. Radiology 2014;273(1):168–174. [DOI] [PMC free article] [PubMed] [Google Scholar]
- 120.Czarnek NM, Clark K, Peters KB, Collins LM, Mazurowski MA. Radiogenomics of glioblastoma: a pilot multi-institutional study to investigate a relationship between tumor shape features and tumor molecular subtype Medical Imaging 2016: Computer-Aided Diagnosis. Volume 9785: International Society for Optics and Photonics; 2016. p. 97850V. [Google Scholar]
- 121.Jain R, Poisson L, Narang J, et al. Genomic mapping and survival prediction in glioblastoma: molecular subclassification strengthened by hemodynamic imaging biomarkers. Radiology 2013;267(1):212–220. [DOI] [PMC free article] [PubMed] [Google Scholar]
- 122.Jain R, Poisson LM, Gutman D, et al. Outcome prediction in patients with glioblastoma by using imaging, clinical, and genomic biomarkers: focus on the nonenhancing component of the tumor. Radiology 2014;272(2):484–493. [DOI] [PMC free article] [PubMed] [Google Scholar]
- 123.Clark K, Vendt B, Smith K, et al. The Cancer Imaging Archive (TCIA): maintaining and operating a public information repository. Journal of digital imaging 2013;26(6):1045–1057. [DOI] [PMC free article] [PubMed] [Google Scholar]
- 124.Edwards NJ, Oberti M, Thangudu RR, et al. The CPTAC data portal: a resource for cancer proteomics research. Journal of proteome research 2015;14(6):2707–2713. [DOI] [PubMed] [Google Scholar]
- 125.Bakas S, Akbari H, Sotiras A, et al. Advancing the cancer genome atlas glioma MRI collections with expert segmentation labels and radiomic features. Scientific data 2017;4:170117. [DOI] [PMC free article] [PubMed] [Google Scholar]
- 126.Scarpace L, Mikkelsen L, Cha T, et al. Radiology data from the cancer genome atlas glioblastoma multiforme [TCGA-GBM] collection. The Cancer Imaging Archive 2016;11(4). [Google Scholar]
- 127.Pedano N, Flanders A, Scarpace L, et al. Radiology data from the cancer genome atlas low grade glioma [TCGA-LGG] collection. The Cancer Imaging Archive 2016. [Google Scholar]
- 128.Menze BH, Jakab A, Bauer S, et al. The multimodal brain tumor image segmentation benchmark (BRATS). IEEE transactions on medical imaging 2014;34(10):1993–2024. [DOI] [PMC free article] [PubMed] [Google Scholar]
- 129.Goldmacher G, Ellingson B, Boxerman J, Barboriak D, Pope W, Gilbert M. Standardized brain tumor imaging protocol for clinical trials. American Journal of Neuroradiology 2015;36(10):E65–E66. [DOI] [PMC free article] [PubMed] [Google Scholar]
- 130.Zwanenburg A, Leger S, Vallières M, Löck S. Image biomarker standardisation initiative. arXiv preprint arXiv:161207003 2016. [Google Scholar]
- 131.Xu K, Ba J, Kiros R, et al. Show, attend and tell: Neural image caption generation with visual attention. arXiv preprint arXiv:150203044 2015. [Google Scholar]
- 132.Wang F, Jiang M, Qian C, et al. Residual attention network for image classification. Proceedings of the IEEE Conference on Computer Vision and Pattern Recognition; 2017. p. 3156–3164. [Google Scholar]
- 133.Burke LA, Hutchins HM. Training transfer: An integrative literature review. Human resource development review 2007;6(3):263–296. [Google Scholar]
- 134.Fedorov A, Beichel R, Kalpathy-Cramer J, et al. 3D Slicer as an image computing platform for the Quantitative Imaging Network. Magnetic resonance imaging 2012;30(9):1323–1341. [DOI] [PMC free article] [PubMed] [Google Scholar]
- 135.Van Griethuysen JJ, Fedorov A, Parmar C, et al. Computational radiomics system to decode the radiographic phenotype. Cancer research 2017;77(21):e104–e107. [DOI] [PMC free article] [PubMed] [Google Scholar]
- 136.Davatzikos C, Rathore S, Bakas S, et al. Cancer imaging phenomics toolkit: quantitative imaging analytics for precision diagnostics and predictive modeling of clinical outcome. Journal of Medical Imaging 2018;5(1):011018. [DOI] [PMC free article] [PubMed] [Google Scholar]
- 137.Duda RO, Hart PE, Stork DG. Pattern classification: John Wiley & Sons: 2012. [Google Scholar]
- 138.Niclou SP. Gauging heterogeneity in primary versus recurrent glioblastoma. Oxford University Press; 2015. [DOI] [PMC free article] [PubMed] [Google Scholar]
- 139.van den Bent MJ, Gao Y, Kerkhof M, et al. Changes in the EGFR amplification and EGFRvIII expression between paired primary and recurrent glioblastomas. Neuro-oncology 2015;17(7):935–941. [DOI] [PMC free article] [PubMed] [Google Scholar]
- 140.Gedeon PC, Choi BD, Sampson JH, Bigner DD. Rindopepimut: anti-EGFRvIII peptide vaccine, oncolytic. Drugs of the Future 2013;38(3):147. [DOI] [PMC free article] [PubMed] [Google Scholar]
- 141.Gan HK, Cvrljevic AN, Johns TG. The epidermal growth factor receptor variant III (EGFRvIII): where wild things are altered. The FEBS journal 2013;280(21):5350–5370. [DOI] [PubMed] [Google Scholar]
- 142.Sheller MJ, Reina GA, Edwards B, Martin J, Bakas S. Multi-institutional Deep Learning Modeling Without Sharing Patient Data: A Feasibility Study on Brain Tumor Segmentation International MICCAI Brainlesion Workshop: Springer; 2018. p. 92–104. [DOI] [PMC free article] [PubMed] [Google Scholar]
- 143.Chang K, Balachandar N, Lam C, et al. Distributed deep learning networks among institutions for medical imaging. Journal of the American Medical Informatics Association 2018;25(8):945–954. [DOI] [PMC free article] [PubMed] [Google Scholar]