Abstract
Background
Cerebrovascular reserve (CVR) may be measured by using an acetazolamide test to clinically evaluate patients with cerebrovascular disease. However, acetazolamide use may be contraindicated and/or undesirable in certain clinical settings.
Purpose
To predict CVR images generated from acetazolamide vasodilation with a deep learning network by using only images before acetazolamide administration.
Materials and Methods
Simultaneous oxygen 15 (15O)–labeled water PET/MRI before and after acetazolamide injection were retrospectively analyzed for patients with Moyamoya disease and healthy control participants from April 2017 to May 2019. Inputs to deep learning models were perfusion-based images (arterial spin labeling [ASL]), structural scans (T2 fluid-attenuated inversion-recovery, T1), and brain location. Two models, that is, 15O-labeled water PET cerebral blood flow (CBF) and MRI (PET-plus-MRI model) before acetazolamide administration and only MRI (MRI-only model) before acetazolamide administration, were trained and tested with sixfold cross-validation. The models learned to predict a voxelwise relative CBF change (rΔCBF) map by using rΔCBF measured with PET due to acetazolamide as ground truth. Quantitative analysis included image quality metrics (peak signal-to-noise ratio, root mean square error, and structural similarity index), as well as comparison between the various methods by using correlation and Bland-Altman analyses. Identification of vascular territories with impaired rΔCBF was evaluated by using receiver operating characteristic metrics.
Results
Thirty-six participants were included: 24 patients with Moyamoya disease (mean age ± standard deviation, 41 years ± 12; 17 women) and 12 age-matched healthy control participants (mean age, 39 years ± 16; nine women). The rΔCBF maps predicted by both deep learning models demonstrated better image quality metrics than did ASL (all P < .001 in patients) and higher correlation coefficient with PET than with ASL (PET-plus-MRI model, 0.704; MRI-only model, 0.690 vs ASL, 0.432; both P < .001 in patients). Both models also achieved high diagnostic performance in identifying territories with impaired rΔCBF (area under receiver operating characteristic curve, 0.95 for PET-plus-MRI model [95% confidence interval: 0.90, 0.99] and 0.95 for MRI-only model [95% confidence interval: 0.91, 0.98]).
Conclusion
By using only images before acetazolamide administration, PET-plus-MRI and MRI-only deep learning models predicted cerebrovascular reserve images without the need for vasodilator injection.
© RSNA, 2020
Summary
Deep learning analysis of oxygen 15–labeled water PET or MRI alone before acetazolamide administration was applied to create images of cerebrovascular reserve without the need for pharmacologic vasodilation.
Key Results
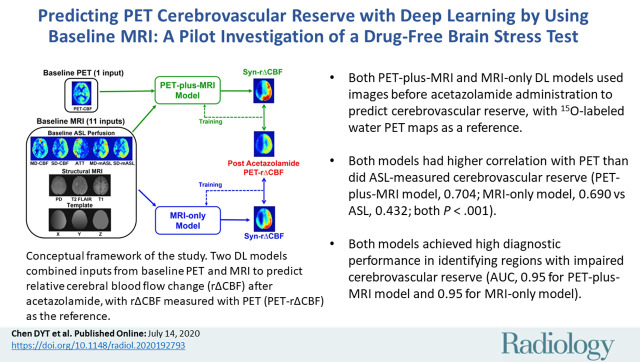
■ Both PET-plus-MRI and MRI-only deep learning models used images before acetazolamide administration to successfully predict cerebrovascular reserve, with oxygen 15–labeled water PET maps as a reference.
■ Both models had higher correlation with PET than did arterial spin labeling (ASL)–measured cerebrovascular reserve (PET-plus-MRI model, 0.704; MRI-only model, 0.690 vs ASL, 0.432; both P < .001).
■ Both models achieved high diagnostic performance in identifying regions with impaired cerebrovascular reserve (area under receiver operating characteristic curve, 0.95 for PET-plus-MRI model and 0.95 for MRI-only model).
Introduction
Many patients with chronic cerebrovascular disease are at increased risk of ischemic stroke because they have poor cerebrovascular reserve (CVR), defined as the ability to increase cerebral blood flow (CBF) in response to a vasodilatory stimulus (1). Clinically, CVR is commonly measured by using paired CBF measurements before and after a vasodilator drug, typically acetazolamide (2).
Acetazolamide is generally safe but contraindicated in patients with sulfa allergies or severe kidney and liver disease (2). Furthermore, patients may present with strokelike symptoms during the test. These symptoms, although transient and rare, unsettle patients and medical staff. Reported reactions include common mild adverse reactions such as headache, flushing, and malaise (3), and rare severe adverse events including pulmonary edema, Stevens-Johnson syndrome, and anaphylaxis (2,4). Finally, avoiding an intravenous medication makes the test easier to administer. Assessing CVR without acetazolamide injection is thus valuable for the clinical evaluation of patients with cerebrovascular disease.
Several studies have shown that CVR in patients with cerebrovascular disease may be predicted from baseline perfusion or structural images, including mean transit time and time to maximum from dynamic perfusion CT and MRI; arterial transit time (ATT) from arterial spin labeling (ASL); and the so-called ivy sign on T2 fluid-attenuated inversion-recovery images (5–8). Most of these studies used a linear model with single input to make predictions. However, multiple other factors may also affect CVR, including the severity of arterial stenosis, baseline CBF, old strokes, and brain location. Deep learning, which recently has shown remarkable performance in the reconstruction and generation of brain images (9), provides a potential method to construct a multivariate nonlinear model to improve prediction of CVR.
Moyamoya disease is a progressive occlusive arteriopathy of the anterior circulation that occurs primarily in young patients without other comorbidities (10). As such, these patients are ideal study participants to investigate severely altered cerebral hemodynamics. In this study, we obtained simultaneous oxygen 15 (15O)–labeled water PET/MRI in patients with Moyamoya disease and healthy control participants, including PET and ASL MRI scans of brain perfusion. We hypothesized that deep learning models can predict voxelwise CVR from baseline (ie, before acetazolamide administration) structural and perfusion images by using PET CVR as the ground truth. Once validated, such an approach would allow CVR estimation in settings where pharmacologic vasodilation is either contraindicated or undesirable.
Materials and Methods
Participants
This Health Insurance Portability and Accountability Act–compliant retrospective study was approved by our institutional review board. Written informed consent was obtained from all participants. From April 2017 through May 2019, we recruited consecutive patients with Moyamoya disease through the Neuroscience Clinics and age-matched healthy control participants. Inclusion criteria included age of 15 years or older and ability to comply with all studies. Exclusion criteria was poor CVR response to acetazolamide (defined as an absolute PET CBF change in cerebellum of less than 10 mL/100 g/min).
PET/MRI Acquisition
Images were acquired with a simultaneous time-of-flight 3.0-T PET/MRI scanner (Signa; GE Healthcare, Waukesha, Wis). Each participant underwent two simultaneous PET/MRI perfusion scans, at baseline and 15 minutes after intravenous administration of acetazolamide (15 mg/kg with a maximum of 1 g).
Static PET images were reconstructed from 2 minutes of detected counts after injection. The reconstruction used time-of-flight ordered subset expectation maximization and included corrections for decay, scatter, random counts, dead time, and point-spread function compensation. MRI attenuation correction was performed with the vendor’s atlas-based method.
Each MRI perfusion scan included two pseudocontinuous ASL scans and a phase-contrast MRI scan. Standard single-delay ASL with consensus parameters (11) and a Hadamard-encoded multidelay ASL sequence (12) were obtained. Phase-contrast MRI was performed to measure total brain blood flow at one slice in the cervical region perpendicular to the internal carotid and vertebral arteries. T1-weighted three-dimensional high-spatial-resolution images and T2-weighted fluid-attenuated inversion-recovery images were acquired for all participants. Detailed MRI parameters are listed in Table E1 (online).
CBF Quantification
Quantitative PET CBF maps were generated by combining phase-contrast MRI and 15O-labeled water PET with a method that takes the spatial distribution information from the PET maps and scales it to whole-brain mean CBF measured with simultaneous phase-contrast MRI (13). Quantitative ASL CBF maps were generated from the ASL difference images with proton density–weighted reference images. For single-delay ASL, CBF maps were quantified by using the single-compartment model (11). For multidelay ASL, ATT maps were measured by using the signal-weighted delay approach and ATT-corrected CBF maps were generated from the two-compartment model (12).
Image Processing
All images were coregistered to T1-weighted structural images by using Statistical Parametric Mapping software (version SPM12; Wellcome Centre, London, United Kingdom) and then normalized to the Montreal Neurologic Institute template by using Advanced Normalization Tools (https://stnava.github.io/ANTs) (14). Relative CBF change due to vasodilation (rΔCBF) was defined as the difference between CBF after acetazolamide and CBF before acetazolamide, normalized to each participant’s mean CBF change within the cerebellum, based on a spatially unbiased atlas template of human cerebellum (15), to account for individual differences in global CBF augmentation. All rΔCBF maps were smoothed with a 10-mm Gaussian filter. The rΔCBF maps measured with PET (PET rΔCBF) and rΔCBF maps measured with multidelay ASL (ASL rΔCBF) were calculated.
Deep Learning Model Implementation
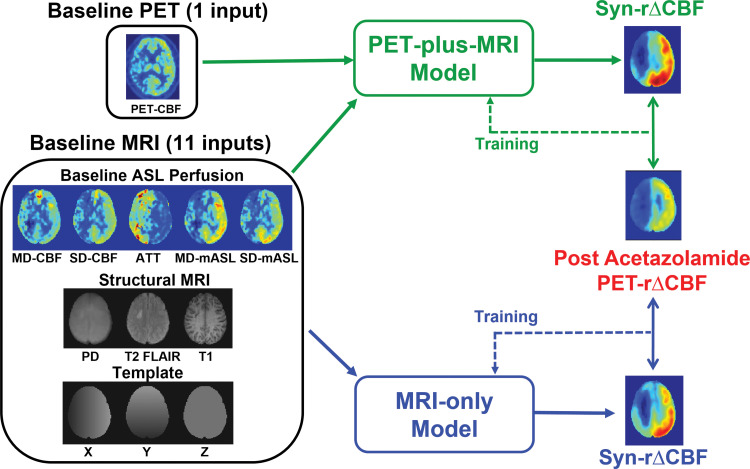
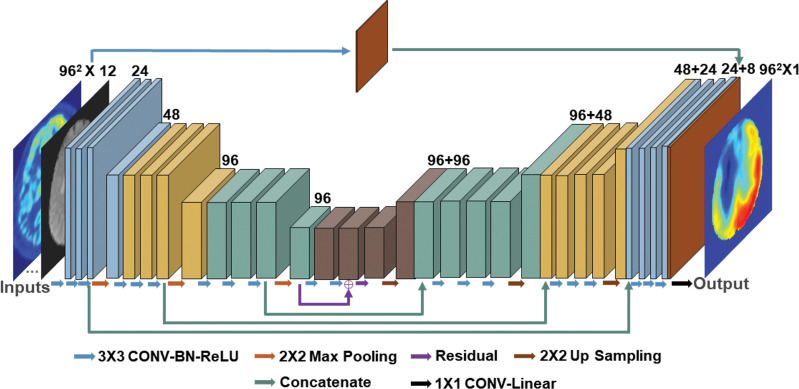
We constructed two deep learning models to predict ground truth PET rΔCBF. The first model (PET-plus-MRI model) included 12 inputs from both baseline PET and MRI, including (a) baseline PET CBF; (b) baseline ASL: CBF and mean ASL difference signal from single-delay and multidelay ASL, proton density–weighted images from single-delay ASL, and ATT from multidelay ASL; (c) structural scans: T1-weighted and T2 fluid-attenuated inversion-recovery images, which provide information of tissue composition and presence of old strokes; and (d) the voxel coordinate in Montreal Neurologic Institute template space, which provides information on brain location. In the second model (MRI-only model), we excluded the baseline PET CBF map from the inputs. The model architecture was a two-dimensional encoder-decoder with a U-Net structure (16), shown in Figure 1. In brief, each encoder layer consists of three convolutional layers with 3 × 3 kernels, batch normalization, rectified linear unit activation layer, and 2 × 2 max pooling. A residual connection is placed at the central layer. In the decoder portion, the data in the encoder layers are concatenated to retain high-spatial-resolution information. Finally, linear interpolation is performed to give the output of synthetic rΔCBF maps.
Figure 1a:
(a) Image shows conceptual framework of study. Two deep learning models combined multiple inputs from baseline PET and MRI to predict relative cerebral blood flow (CBF) change (rΔCBF) after acetazolamide, with rΔCBF measured with PET (PET-rΔCBF) as reference. PET-plus-MRI model used both baseline PET and MRI inputs. MRI-only model used only MRI inputs. (b) Image shows architecture of deep learning model (PET-plus-MRI model shown for simplicity; MRI-only model would exclude baseline PET CBF map from inputs). Network components are color coded and labeled at bottom, and input and output image dimensions are labeled. Channel numbers in each step are shown above blocks. ASL = arterial spin labeling, ATT = arterial transit time, BN = batch normalization layer, CONV = convolutional layer, FLAIR = fluid-attenuated inversion-recovery, linear = linear layer, mASL = mean ASL difference signal, MD = multidelay, PD = proton density–weighted image, ReLU = rectifier linear unit, SD = single-delay, Syn-rΔCBF = synthetic rΔCBF predicted by deep learning models.
Figure 1b:
(a) Image shows conceptual framework of study. Two deep learning models combined multiple inputs from baseline PET and MRI to predict relative cerebral blood flow (CBF) change (rΔCBF) after acetazolamide, with rΔCBF measured with PET (PET-rΔCBF) as reference. PET-plus-MRI model used both baseline PET and MRI inputs. MRI-only model used only MRI inputs. (b) Image shows architecture of deep learning model (PET-plus-MRI model shown for simplicity; MRI-only model would exclude baseline PET CBF map from inputs). Network components are color coded and labeled at bottom, and input and output image dimensions are labeled. Channel numbers in each step are shown above blocks. ASL = arterial spin labeling, ATT = arterial transit time, BN = batch normalization layer, CONV = convolutional layer, FLAIR = fluid-attenuated inversion-recovery, linear = linear layer, mASL = mean ASL difference signal, MD = multidelay, PD = proton density–weighted image, ReLU = rectifier linear unit, SD = single-delay, Syn-rΔCBF = synthetic rΔCBF predicted by deep learning models.
Deep Learning Model Training and Testing
All input images except ATT were normalized to the corresponding whole-brain mean. ATT was normalized by 3.7 seconds, which was the longest postlabel delay used. Input images were augmented by flipping along x and y direction The cost function was defined as weighted mean absolute error minus 0.1 times structural similarity index metric (17). We weighted the weighted mean absolute error by threefold in voxels with PET rΔCBF less than 1, to emphasize accuracy in low CVR regions. We added structural similarity index metric as a perceptual loss, which improves performance for image generation (18). Adaptive moment estimation was used as the optimization method. The initial learning rate was 0.0006 with a batch size of 160 slices and 40 epochs.
Sixfold cross-validation was used. The 36 PET/MRI data sets were divided into six subgroups, each consisting of six data sets from four patients with Moyamoya disease and two healthy control participants. For each fold, the data sets from five of the subgroups (30 data sets total) were used for training, from which 10% of the images were randomly selected for validation. This trained network was then tested on the unused subgroup (six data sets total). All training and testing were performed by using a Tesla V100 PCIe graphics processing unit (Nvidia, Santa Clara, Calif). The code for the model, along with the final trained weights from one of the folds of the cross-validation, are available on GitHub (https://github.com/paddington0814/ASLCVR_model).
Assessment of Image Quality
Synthetic rΔCBF and ASL rΔCBF image quality were quantitatively evaluated by using root mean square error (RMSE), peak signal-to-noise ratio, and structural similarity index metric, compared with the ground truth PET rΔCBF maps. All three metrics were calculated within the Montreal Neurologic Institute–based brain mask for each slice and averaged for each participant.
Assessment of rΔCBF Quantification
The rΔCBF was measured in 90 supratentorial cortical regions of interest based on the AAL2 template in each participant (19). Mixed-effect models adjusted for within-participants clustering by assuming within-participant errors and random effects are normally distributed (20), and Bland-Altman plots examined correlation and agreement between synthetic rΔCBF, ASL ΔCBF maps, and the ground truth PET rΔCBF maps.
Detection of Impaired CVR
For each patient with Moyamoya disease, rΔCBF was calculated in six vascular territories (anterior, middle, and posterior in each hemisphere), corresponding to two slice locations of the Alberta Stroke Program Early CT Score (21). Threshold values of impaired PET rΔCBF were defined as 3 standard deviations below the mean PET rΔCBF values in the healthy control participants (Fig E1 [online]). The area under the receiver operator characteristic curve (AUC) was used to evaluate the diagnostic performance of synthetic rΔCBF and ASL rΔCBF at identifying territories with impaired CVR. A total of 144 vascular territories from the 24 patients were included in the analysis. Sensitivity and specificity for each method were calculated at the model threshold that maximized the Youden index. To explore the diagnostic performance in a wider range, thresholds of 2 standard deviations and 4 standard deviations below the healthy control mean were also evaluated.
Statistical Analyses
The Friedman test was used to compare image quality between the PET-plus-MRI model, MRI-only model, and ASL methods. Posthoc comparison was performed by using Dunn multiple comparison test. The differences of correlation coefficient and AUC between each method were compared by using Wilcox–Muska test (22) and DeLong test, respectively. The mixed-effect model analyses, Wilcox–Muska test, and DeLong test were performed with Stata (version 15.1; StataCorp, College Station, Tex), and the other analyses were performed with GraphPad Prism (version 5; GraphPad Software, La Jolla, Calif).
Results
Participant Characteristics
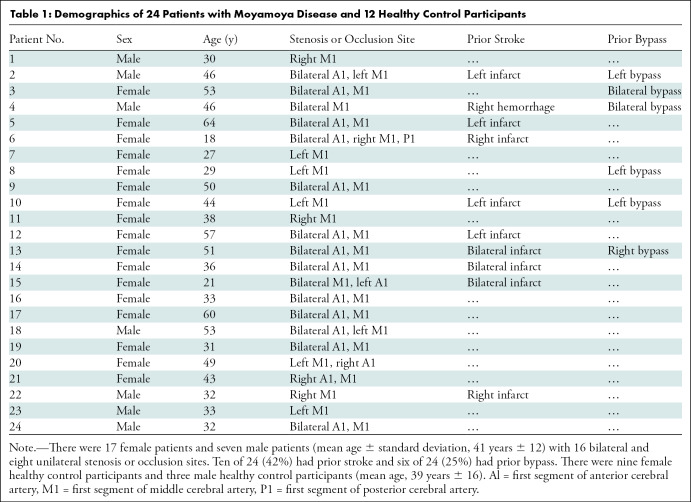
From the 25 patients with Moyamoya disease who completed all studies, response to acetazolamide failed in one patient and the patient was excluded. Twenty-four patients (mean age ± standard deviation, 41 years ± 12; 17 women) and 12 age-matched healthy control participants (mean age, 39 years ± 16; nine women) were included. Participant demographics are summarized in Table 1.
Table 1:
Demographics of 24 Patients with Moyamoya Disease and 12 Healthy Control Participants
Image Quality Assessment
Figure 2 shows the image quality metrics for each method. In patients with Moyamoya disease, both deep learning models performed better than did ASL rΔCBF for all metrics (all P < .001). In healthy control participants, the PET-plus-MRI model outperformed ASL rΔCBF for all metrics (P = .003 [RMSE], P < .001 [peak signal-to-noise ratio and structural similarity index metric]), while the MRI-only model was only better for structural similarity index metric (P = .004). No differences in image quality were observed between the two models when comparing patients and healthy control participants (RMSE, peak signal-to-noise ratio, structural similarity index metric: P = .39, P = .39, P = .25 [patients]; P = .31, P = .10, P = .10 [control participants]). The details of image quality metrics are listed in Table E2 (online).
Figure 2a:
Graphs show image quality metrics of relative cerebral blood flow change (rΔCBF) maps from PET-plus-MRI model, MRI-only model, and rΔCBF measured with multidelay arterial spine labeling (ASL rΔCBF) compared with reference PET. (a) Patients with Moyamoya disease. (b) Healthy control participants. In patients with Moyamoya disease, both deep learning models were better than was ASL rΔCBF on all three metrics. In healthy control participants, PET-plus-MRI model was better than was ASL rΔCBF in all three metrics, while MRI-only model was only better than was ASL rΔCBF for structural similarity index (SSIM). There was no difference between two models in all metrics in both patients with Moyamoya disease and healthy control participants. PSNR = peak signal-to-noise ratio, RMSE = root mean square error.
Figure 2b:
Graphs show image quality metrics of relative cerebral blood flow change (rΔCBF) maps from PET-plus-MRI model, MRI-only model, and rΔCBF measured with multidelay arterial spine labeling (ASL rΔCBF) compared with reference PET. (a) Patients with Moyamoya disease. (b) Healthy control participants. In patients with Moyamoya disease, both deep learning models were better than was ASL rΔCBF on all three metrics. In healthy control participants, PET-plus-MRI model was better than was ASL rΔCBF in all three metrics, while MRI-only model was only better than was ASL rΔCBF for structural similarity index (SSIM). There was no difference between two models in all metrics in both patients with Moyamoya disease and healthy control participants. PSNR = peak signal-to-noise ratio, RMSE = root mean square error.
CVR Quantification Assessment
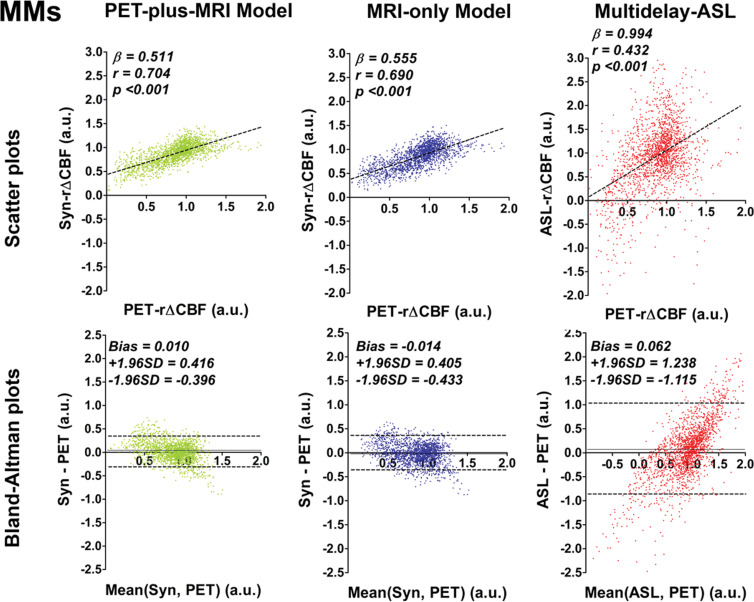
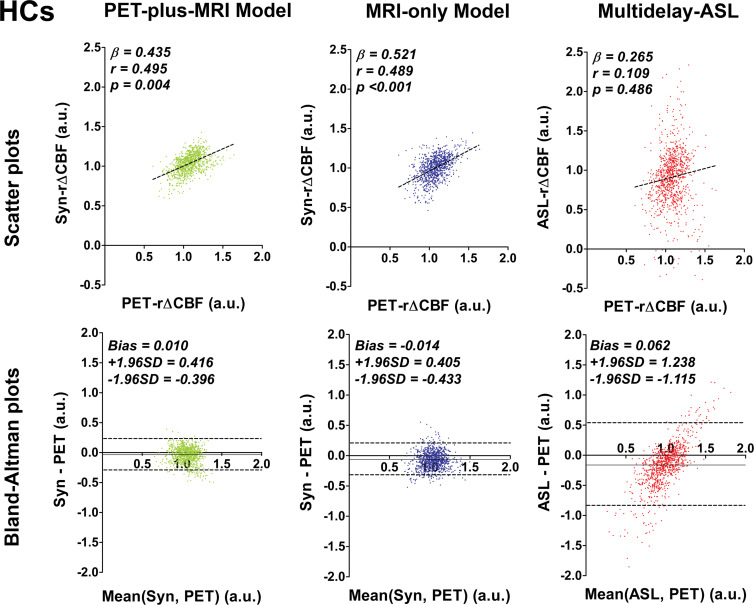
In patients with Moyamoya disease, rΔCBF from both deep learning models and ASL rΔCBF were all correlated with PET rΔCBF (Fig 3a), although the deep learning models had better correlation than did ASL rΔCBF (both P < .001). In healthy control participants, rΔCBF values from both models also correlated with PET rΔCBF (P < .001 [PET-plus-MRI model] and 0.004 [MRI-only model]), while ASL rΔCBF did not correlate with PET rΔCBF (P = .49) (Fig 3b). In both groups, the correlation coefficients were not different between the two models (P = .62 [patients] and 0.95 [control participants]). On Bland-Altman plots, rΔCBF values from both models showed less bias and lower variance than did ASL rΔCBF for both groups. Moreover, proportional bias existed for ASL rΔCBF in both groups, showing overestimation at higher rΔCBF and underestimation at lower rΔCBF (Fig 3b).
Figure 3a:
Graphs show correlation and Bland-Altman plots of relative cerebral blood flow change (rΔCBF) from both deep learning models and rΔCBF measured with multidelay arterial spin labeling (ASL rΔCBF), compared with reference PET. (a) Patients with Moyamoya disease (MMs). In patients with Moyamoya disease, both models and ASL rΔCBF correlated with rΔCBF measured with PET (PET-rΔCBF), while correlation coefficients of both models were higher than that of ASL rΔCBF. (b) Healthy control participants (HCs). In healthy control participants, both models correlated with PET, while ASL rΔCBF does not. On Bland-Altman plots, both models showed less bias and reduced variance compared with ASL rΔCBF, which showed a proportional bias to rΔCBF values. Beta is slope of correlation and r is the correlation coefficient. SD = standard deviation, Syn = synthetic, Syn-rΔCBF = synthetic rΔCBF predicted by deep learning models.
Figure 3b:
Graphs show correlation and Bland-Altman plots of relative cerebral blood flow change (rΔCBF) from both deep learning models and rΔCBF measured with multidelay arterial spin labeling (ASL rΔCBF), compared with reference PET. (a) Patients with Moyamoya disease (MMs). In patients with Moyamoya disease, both models and ASL rΔCBF correlated with rΔCBF measured with PET (PET-rΔCBF), while correlation coefficients of both models were higher than that of ASL rΔCBF. (b) Healthy control participants (HCs). In healthy control participants, both models correlated with PET, while ASL rΔCBF does not. On Bland-Altman plots, both models showed less bias and reduced variance compared with ASL rΔCBF, which showed a proportional bias to rΔCBF values. Beta is slope of correlation and r is the correlation coefficient. SD = standard deviation, Syn = synthetic, Syn-rΔCBF = synthetic rΔCBF predicted by deep learning models.
Detection of Impaired CVR
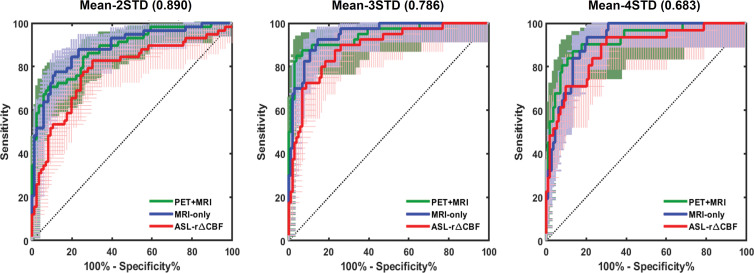
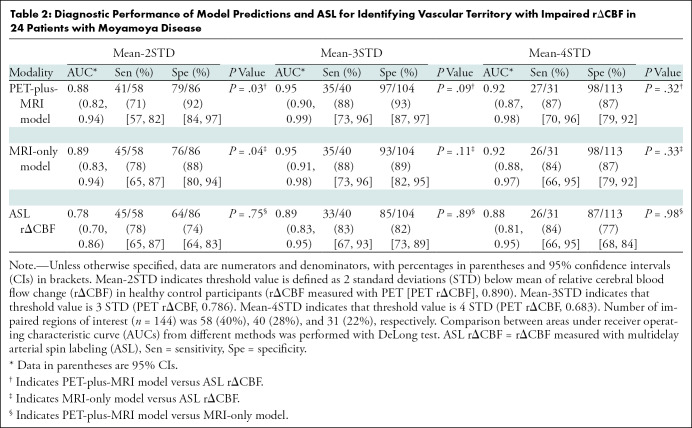
Figure 4 shows the receiver operator characteristic curves and Table 2 shows the AUC, sensitivity, and specificity of both deep learning models and ASL rΔCBF to identify vascular territories with impaired PET rΔCBF in patients with Moyamoya disease. For each threshold of impaired PET rΔCBF, the AUC of both models were higher than that of ASL rΔCBF. The AUCs for PET-plus-MRI model, MRI-only model, and ASL rΔCBF were 0.95 (95% confidence interval [CI]: 0.90, 0.99), 0.95 (95% CI: 0.91, 0.98), and 0.89 (95% CI: 0.83, 0.95) for a threshold of 3 standard deviations below mean in healthy control participants. A similar pattern was seen for milder or more severe CVR thresholds. The deep learning models consistently outperformed ASL rΔCBF, even though the ASL images were acquired before and after acetazolamide administration while the deep learning models predicted CVR using images before acetazolamide administration only (Table 2). At the threshold of 3 standard deviations, sensitivity and specificity for PET-plus-MRI model, MRI-only model, and ASL rΔCBF were 35 of 40 (88%) and 97 of 104 (93%), 35 of 40 (88%) and 93 of 104 (89%), and 33 of 40 (83%) and 85 of 104 (82%), respectively.
Figure 4:
Graphs show receiver operating characteristic (ROC) curves for identifying vascular territory with impaired relative cerebral blood flow change (rΔCBF). Threshold at 2 standard deviations (STD) below mean rΔCBF of healthy control participants (left). Threshold at 3 STD below mean (middle). Threshold at 4 STD below mean (right). Areas under ROC curve of PET-plus-MRI and MRI-only models are higher than that of rΔCBF measured with multidelay arterial spin labeling (ASL rΔCBF) at all three thresholds. Detailed areas under ROC curve values and diagnostic performance are listed in Table 2.
Table 2:
Diagnostic Performance of Model Predictions and ASL for Identifying Vascular Territory with Impaired rΔCBF in 24 Patients with Moyamoya Disease
Image Assessment
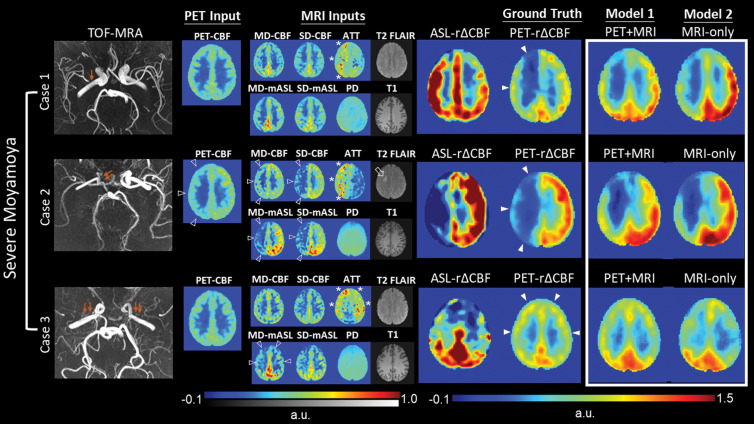
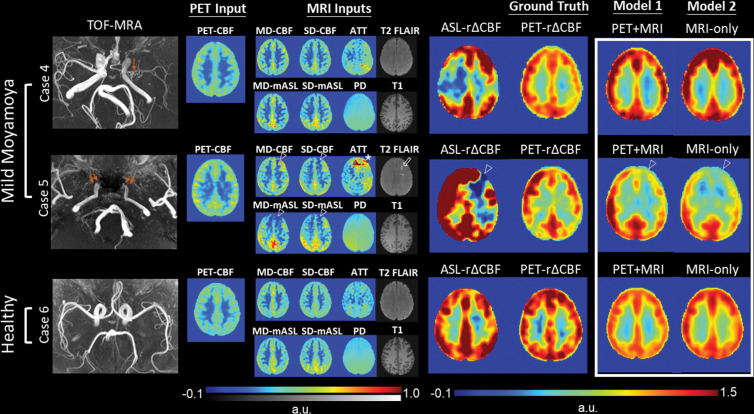
Images from three patients with severe Moyamoya disease, defined as having impaired PET rΔCBF in any vascular territory, are shown in Figure 5. Synthetic rΔCBF of both models visually show higher image quality than ASL rΔCBF and are similar to PET rΔCBF. Generally, brain regions with lower CBF, longer ATT, and chronic infarcts on baseline images had lower rΔCBF. ASL tended to underestimate rΔCBF in regions with low PET rΔCBF, consistent with the proportional bias on Bland-Altman plots. Figure 6 presents two patients with mild Moyamoya disease without impaired CVR and a healthy control participant. In mild cases, baseline CBF was usually preserved and ATT was not severely prolonged.
Figure 5:
Representative images in three patients with severe Moyamoya disease with impaired relative cerebral blood flow (CBF) change (rΔCBF) measured with PET. Upper row: Case 1 shows a 43-year-old woman with moderate right M1 stenosis (arrow). Baseline CBF is preserved, while arterial transit time (ATT) is prolonged (*), in right cerebral hemisphere. Both PET-plus-MRI and MRI-only models correctly predict impaired rΔCBF in right cerebral hemisphere, while rΔCBF measured with multidelay (MD) arterial spin labeling (ASL) (ASL rΔCBF) mistakenly shows lower rΔCBF in left side. Middle row: Case 2 shows 18-year-old woman with occluded right distal internal carotid artery (double arrows). In addition to prolonged baseline ATT (*), reduced baseline PET-CBF, ASL CBF, and mean ASL difference signal (mASL) (open arrowheads) are noted in right cerebral hemisphere, as well as a chronic infarct on T2 fluid-attenuated inversion-recovery (FLAIR) (open arrow). Both deep learning models correctly predicted more severely impaired rΔCBF than in case 1. Lower row: Case 3 shows a 33-year-old woman with bilateral M1 occlusion (double arrows). Both models successfully predicted impaired rΔCBF from inputs of prolonged baseline ATT (*) and mildly reduced MD-mASL bilaterally (open arrowheads), PD = proton density–weighted image, PET-rΔCBF = relative CBF change measured with PET, SD = single-delay, TOF-MRA = time-of-flight MR angiography.
Figure 6:
Representative images in two patients with mild Moyamoya disease without impaired relative cerebral blood flow (CBF) change (rΔCBF) by using PET and a healthy control participant. Upper row: Case 4 shows a 29-year-old woman with mild left M1 stenosis (arrow). Both models successfully predict preserved rΔCBF in bilateral hemispheres, while rΔCBF measured with multidelay (MD) arterial spin labeling (ASL) (ASL rΔCBF) shows unexpected focal defect at right frontoparietal region. Middle row: Case 5 shows a 46-year-old man with bilateral internal carotid artery occlusion (double arrows) after bilateral bypass surgery. Baseline PET-CBF was preserved, but focal defects in CBF and mean ASL difference signal (mASL) of both ASLs, arterial transit artifact in MD-mASL CBF map (open arrowhead), prolonged arterial transit time (ATT) (*), and old infarct (open arrow) were observed in left anterior frontal region. Both models mistakenly predicted impaired rΔCBF in left anterior cerebral artery territory, probably due to previous bypass surgery. Lower row: Case 6 shows 28-year-old male healthy control participant with normal rΔCBF measured with PET (PET-rΔCBF). PD = proton density–weighted image, SD = single-delay, TOF-MRA = time-of-flight MR angiography.
Discussion
We constructed deep learning models that combined multicontrast information from baseline PET and MRI to predict cerebrovascular reserve (CVR), using simultaneously acquired oxygen 15 (15O)–labeled water PET maps as the reference. Both models, whether using MRI-only model or PET-plus-MRI model before acetazolamide administration, had better image quality (all P < .001 in patients) and quantification accuracy than did arterial spin labeling (ASL)–derived maps (correlation coefficient, 0.704 for PET-plus-MRI model, 0.690 for MRI-only model vs 0.432 for ASL; both P < .001 in patients). Both models also demonstrated higher or comparable diagnostic performance than did ASL to identify impaired cerebrovascular reserve. Furthermore, the MRI-only model performed similarly to the PET-plus-MRI model in image quality, quantification accuracy, and diagnostic performance (all P > .05 in the comparison between the two models).
Baseline perfusion parameters can predict CVR. Among common perfusion parameters, timing parameters from dynamic susceptibility contrast methods, such as mean transit time and time to maximum, best reflect CVR in Moyamoya disease and atherosclerotic steno-occlusive disease (5,23). ATT derived from multidelay ASL also correlates with CVR and could predict CVR impairment in unilateral steno-occlusive disease (8). Baseline CBF is another important factor to determine CVR. In patients with cerebrovascular disease, when cerebral perfusion pressure begins to decrease, autoregulation causes vasodilation to maintain CBF. Further perfusion pressure decreases cause decreased CBF, leading to a nonlinear relationship with CVR (24). Patients with decreased baseline CBF are likely to have worse CVR than do patients with normal baseline CBF (25). Given that CVR changes are expected to be nonlinear functions of perfusion parameters, a nonlinear data-driven method such as deep learning is expected to provide more accurate predictions than these linear predictors.
Structural imaging could also contribute valuable information to predict CVR. The presence of leptomeningeal collaterals, such as the so-called ivy sign on T2 fluid-attenuated inversion-recovery and ASL arterial transit artifact, are associated with reduced CVR in chronic cerebrovascular disease (7,26). White matter hyperintensities have lower CVR than do normal-appearing white matter (27) and chronic infarcts generally have poor CVR. Furthermore, CVR can have considerable variation among different brain regions and between white matter and gray matter (28). This information can be provided by anatomic images and template coordinates but is hard to integrate into traditional regression models. Deep learning constructs a multimodal nonlinear model, incorporating the inherently high-dimensional inputs of baseline perfusion, structure, and location, to predict voxelwise CVR.
The synthetic CVR maps had higher image quality and quantification accuracy than did relative cerebral blood flow change (rΔCBF) measured with ASL (ASL rΔCBF), even though the latter directly measured information after acetazolamide. A previous study (29) showed that CVR measured with single-delay ASL significantly correlated with SPECT-based CVR in patients with Moyamoya disease. Yet, direct comparison between acetazolamide-induced CVR measured with ASL and with the reference standard PET is still lacking. Potential pitfalls in using ASL to measure CVR include arterial transit artifacts (30), underestimated flow in long ATT regions (31), labeling efficiency changes with vasodilation (32), and poor image quality associated with subtraction maps of a method with inherently low signal-to-noise ratio. Our deep learning models learned the CVR prediction from PET, which was less sensitive to transit delay and flow velocity changes and had higher signal-to-noise ratio than did ASL.
Both deep learning models showed high diagnostic performance in identifying vascular territories with impaired CVR. Yun et al (29) reported areas AUCs between 0.85 and 0.94 by using CVR measured with single-delay ASL to identify impaired CVR regions measured with SPECT in patients with Moyamoya disease. Furthermore, Choi et al (8) used baseline ATT from ASL to identify impaired CVR in unilateral steno-occlusive disease, with an AUC of 0.89. Both our models showed comparable or higher AUCs at all tested thresholds.
On the basis of a previous study showing that 15O-labeled water PET CBF can be predicted from only MRI by using deep learning, we were not surprised that including baseline PET inputs only led to minor improvements over the MRI-only model (33). This observation is of great clinical significance. Because only MRI is needed for prediction, this technology may be implemented at sites without a PET/MRI scanner and 15O-labeled water capability and enable more cost-efficient and streamlined identification of patients at risk.
Our study had several limitations. We did not include dynamic susceptibility contrast maps, such as mean transit time and time to maximum. Although these parameters have showed correlation with CVR, we aimed to provide a gadolinium-based contrast agent–free protocol, given considerations such as nephrogenic systemic fibrosis and deposition (34). Also, using contrast enhancement methods before and after acetazolamide administration is challenging because the first dose may affect quantification of the second dose. Our models predicted normalized rather than absolute CBF change. Although an absolute value is more quantitative, there are wide interindividual CVR variations even in healthy people, such that normalization facilitates identification of impaired CVR (35). We did not compare acetazolamide to alternative nondrug CVR measurement that uses gas challenge (ie, CO2 inhalation or breath holding). However, the need for dedicated equipment such as a gas control system, the use of respiratory mask, visual or auditory cueing for paced breathing, and respiratory end-tidal CO2 monitoring may restrict its clinical use compared with our approach.
Finally, although this is a large study of patients with Moyamoya disease, our data set may not encompass the entire spectrum of CVR changes and thus potentially limit the generalizability of our model. Furthermore, cerebral atherosclerotic disease, another major cause of arterial stenosis, has different pathophysiology, collateral formation, and CVR response from Moyamoya disease (26,36). CVR evaluation is also important in cerebral small-vessel disease (27). While many ASL imaging findings in these diseases are similar (although often milder than in Moyamoya disease), we cannot be certain that the performance of the deep learning models will generalize to patients not included in our testing cohort.
In conclusion, deep learning models can combine multicontrast information from baseline perfusion imaging and structural MRI to create PET-like cerebrovascular reserve (CVR) maps. The MRI-only model allows CVR prediction with oxygen 15–labeled water PET by using only MRI and without injecting acetazolamide, enabling CVR measurements in routine MRI settings. The ability to assess CVR without pharmacologic vasodilation, radiotracers, or PET scanning should benefit the clinical evaluation of patients with cerebrovascular disease.
SUPPLEMENTAL TABLES
SUPPLEMENTAL FIGURES
Acknowledgments
Acknowledgments
The authors thank GE Healthcare for research support and Nvidia for GPU donation.
Supported by the National Institutes of Health (R01-EB025220) and GE Healthcare.
Disclosures of Conflicts of Interest: D.Y.T.C. disclosed no relevant relationships. Y.I. disclosed no relevant relationships. A.P.F. disclosed no relevant relationships. J.G. disclosed no relevant relationships. M.Y.Z. disclosed no relevant relationships. G.K.S. Activities related to the present article: disclosed no relevant relationships. Activities not related to the present article: is a consultant for NeuroSave, Peter Lazic US, Qool Therapeutics, SanBio, Surgical Theater, and Zeiss. Other relationships: disclosed no relevant relationships. G.Z. Activities related to the present article: disclosed no relevant relationships. Activities not related to the present article: is a board member of, is a consultant for, and holds stock/stock options in Subtle Medical; has grants/grants pending with Bayer Healthcare and GE Healthcare; has various MR, PET, and artificial intelligence patents (planned, pending, or issued); received payment for development of education presentations from GE Healthcare. Other relationships: disclosed no relevant relationships.
Abbreviations:
- ASL
- arterial spin labeling
- ASL rΔCBF
- rΔCBF measured with multidelay ASL
- ATT
- arterial transit time
- AUC
- area under receiver operating characteristic curve
- CBF
- cerebral blood flow
- CVR
- cerebrovascular reserve
- PET rΔCBF
- rΔCBF measured with PET
- rΔCBF
- relative CBF change
- RMSE
- root mean square error
References
- 1.Derdeyn CP, Grubb RL, Jr, Powers WJ. Cerebral hemodynamic impairment: methods of measurement and association with stroke risk. Neurology 1999;53(2):251–259. [DOI] [PubMed] [Google Scholar]
- 2.Vagal AS, Leach JL, Fernandez-Ulloa M, Zuccarello M. The acetazolamide challenge: techniques and applications in the evaluation of chronic cerebral ischemia. AJNR Am J Neuroradiol 2009;30(5):876–884. [DOI] [PMC free article] [PubMed] [Google Scholar]
- 3.Sullivan HG, Kingsbury TB, 4th, Morgan ME, et al. The rCBF response to Diamox in normal subjects and cerebrovascular disease patients. J Neurosurg 1987;67(4):525–534. [DOI] [PubMed] [Google Scholar]
- 4.Kelly TE, Hackett PH. Acetazolamide and sulfonamide allergy: a not so simple story. High Alt Med Biol 2010;11(4):319–323. [DOI] [PubMed] [Google Scholar]
- 5.Kim JH, Lee SJ, Shin T, et al. Correlative assessment of hemodynamic parameters obtained with T2*-weighted perfusion MR imaging and SPECT in symptomatic carotid artery occlusion. AJNR Am J Neuroradiol 2000;21(8):1450–1456. [PMC free article] [PubMed] [Google Scholar]
- 6.Rim NJ, Kim HS, Shin YS, Kim SY. Which CT perfusion parameter best reflects cerebrovascular reserve?: correlation of acetazolamide-challenged CT perfusion with single-photon emission CT in Moyamoya patients. AJNR Am J Neuroradiol 2008;29(9):1658–1663. [DOI] [PMC free article] [PubMed] [Google Scholar]
- 7.Mori N, Mugikura S, Higano S, et al. The leptomeningeal “ivy sign” on fluid-attenuated inversion recovery MR imaging in Moyamoya disease: a sign of decreased cerebral vascular reserve? AJNR Am J Neuroradiol 2009;30(5):930–935. [DOI] [PMC free article] [PubMed] [Google Scholar]
- 8.Choi HJ, Sohn CH, You SH, et al. Can Arterial Spin-Labeling with Multiple Postlabeling Delays Predict Cerebrovascular Reserve? AJNR Am J Neuroradiol 2018;39(1):84–90. [DOI] [PMC free article] [PubMed] [Google Scholar]
- 9.Zaharchuk G, Gong E, Wintermark M, Rubin D, Langlotz CP. Deep Learning in Neuroradiology. AJNR Am J Neuroradiol 2018;39(10):1776–1794 10.3174/ajnr.A5543. [DOI] [PMC free article] [PubMed] [Google Scholar]
- 10.Scott RM, Smith ER. Moyamoya disease and moyamoya syndrome. N Engl J Med 2009;360(12):1226–1237. [DOI] [PubMed] [Google Scholar]
- 11.Alsop DC, Detre JA, Golay X, et al. Recommended implementation of arterial spin-labeled perfusion MRI for clinical applications: A consensus of the ISMRM perfusion study group and the European consortium for ASL in dementia. Magn Reson Med 2015;73(1):102–116. [DOI] [PMC free article] [PubMed] [Google Scholar]
- 12.Dai W, Shankaranarayanan A, Alsop DC. Volumetric measurement of perfusion and arterial transit delay using hadamard encoded continuous arterial spin labeling. Magn Reson Med 2013;69(4):1014–1022. [DOI] [PMC free article] [PubMed] [Google Scholar]
- 13.Ishii Y, Thamm T, Guo J, et al. Simultaneous Phase-Contrast MRI and PET for Noninvasive Quantification of Cerebral Blood Flow and Reactivity in Healthy Subjects and Patients With Cerebrovascular Disease. J Magn Reson Imaging 2020;51(1):183–194. [DOI] [PMC free article] [PubMed] [Google Scholar]
- 14.Tustison NJ, Cook PA, Klein A, et al. Large-scale evaluation of ANTs and FreeSurfer cortical thickness measurements. Neuroimage 2014;99:166–179. [DOI] [PubMed] [Google Scholar]
- 15.Diedrichsen J. A spatially unbiased atlas template of the human cerebellum. Neuroimage 2006;33(1):127–138. [DOI] [PubMed] [Google Scholar]
- 16.Ronneberger O, Fischer P, Brox T. U-Net: Convolutional Networks for Biomedical Image Segmentation. In: Navab N, Hornegger J, Wells WM, Frangi AF, eds. Medical Image Computing and Computer-Assisted Intervention – MICCAI 2015. MICCAI 2015. Lecture Notes in Computer Science, vol 9351. Cham, Switzerland: Springer, 2015; 234–241. [Google Scholar]
- 17.Wang Z, Bovik AC, Sheikh HR, Simoncelli EP. Image quality assessment: from error visibility to structural similarity. IEEE Trans Image Process 2004;13(4):600–612. [DOI] [PubMed] [Google Scholar]
- 18.Zhao H, Gallo O, Frosio I, Kautz J. Loss Functions for Image Restoration With Neural Networks. IEEE Trans Comput Imaging 2017;3(1):47–57. [Google Scholar]
- 19.Rolls ET, Joliot M, Tzourio-Mazoyer N. Implementation of a new parcellation of the orbitofrontal cortex in the automated anatomical labeling atlas. Neuroimage 2015;122:1–5. [DOI] [PubMed] [Google Scholar]
- 20.Laird NM, Ware JH. Random-effects models for longitudinal data. Biometrics 1982;38(4):963–974. [PubMed] [Google Scholar]
- 21.Barber PA, Demchuk AM, Zhang J, Buchan AM. Validity and reliability of a quantitative computed tomography score in predicting outcome of hyperacute stroke before thrombolytic therapy. ASPECTS Study Group. Alberta Stroke Programme Early CT Score. Lancet 2000;355(9216):1670–1674. [DOI] [PubMed] [Google Scholar]
- 22.Wilcox RR. Comparing Pearson Correlations: Dealing with Heteroscedasticity and Nonnormality. Commun Stat Simul Comput 2009;38(10):2220–2234. [Google Scholar]
- 23.Kikuchi K, Murase K, Miki H, et al. Quantitative evaluation of mean transit times obtained with dynamic susceptibility contrast-enhanced MR imaging and with (133)Xe SPECT in occlusive cerebrovascular disease. AJR Am J Roentgenol 2002;179(1):229–235. [DOI] [PubMed] [Google Scholar]
- 24.Powers WJ. Cerebral hemodynamics in ischemic cerebrovascular disease. Ann Neurol 1991;29(3):231–240. [DOI] [PubMed] [Google Scholar]
- 25.Rogg J, Rutigliano M, Yonas H, Johnson DW, Pentheny S, Latchaw RE. The acetazolamide challenge: imaging techniques designed to evaluate cerebral blood flow reserve. AJR Am J Roentgenol 1989;153(3):605–612. [DOI] [PubMed] [Google Scholar]
- 26.Roach BA, Donahue MJ, Davis LT, et al. Interrogating the Functional Correlates of Collateralization in Patients with Intracranial Stenosis Using Multimodal Hemodynamic Imaging. AJNR Am J Neuroradiol 2016;37(6):1132–1138. [DOI] [PMC free article] [PubMed] [Google Scholar]
- 27.Blair GW, Doubal FN, Thrippleton MJ, Marshall I, Wardlaw JM. Magnetic resonance imaging for assessment of cerebrovascular reactivity in cerebral small vessel disease: A systematic review. J Cereb Blood Flow Metab 2016;36(5):833–841. [DOI] [PMC free article] [PubMed] [Google Scholar]
- 28.Bhogal AA, Philippens MEP, Siero JCW, et al. Examining the regional and cerebral depth-dependent BOLD cerebrovascular reactivity response at 7T. Neuroimage 2015;114:239–248. [DOI] [PubMed] [Google Scholar]
- 29.Yun TJ, Paeng JC, Sohn CH, et al. Monitoring Cerebrovascular Reactivity through the Use of Arterial Spin Labeling in Patients with Moyamoya Disease. Radiology 2016;278(1):205–213. [DOI] [PubMed] [Google Scholar]
- 30.Zaharchuk G, Bammer R, Straka M, et al. Arterial spin-label imaging in patients with normal bolus perfusion-weighted MR imaging findings: pilot identification of the borderzone sign. Radiology 2009;252(3):797–807. [DOI] [PMC free article] [PubMed] [Google Scholar]
- 31.Fan AP, Guo J, Khalighi MM, et al. Long-Delay Arterial Spin Labeling Provides More Accurate Cerebral Blood Flow Measurements in Moyamoya Patients: A Simultaneous Positron Emission Tomography/MRI Study. Stroke 2017;48(9):2441–2449. [DOI] [PMC free article] [PubMed] [Google Scholar]
- 32.Aslan S, Xu F, Wang PL, et al. Estimation of labeling efficiency in pseudocontinuous arterial spin labeling. Magn Reson Med 2010;63(3):765–771. [DOI] [PMC free article] [PubMed] [Google Scholar]
- 33.Guo J, Gong E, Fan AP, Goubran M, Khalighi MM, Zaharchuk G. Predicting 15O-Water PET Cerebral Blood Flow Maps From Multi-Contrast MRI Using a Deep Convolutional Neural Network With Evaluation of Training Cohort Bias. J Cereb Blood Flow Metab 2019 Nov 13;271678X19888123 [Epub ahead of print]. [DOI] [PMC free article] [PubMed] [Google Scholar]
- 34.McDonald RJ, Levine D, Weinreb J, et al. Gadolinium Retention: A Research Roadmap from the 2018 NIH/ACR/RSNA Workshop on Gadolinium Chelates. Radiology 2018;289(2):517–534. [DOI] [PMC free article] [PubMed] [Google Scholar]
- 35.Settakis G, Molnár C, Kerényi L, et al. Acetazolamide as a vasodilatory stimulus in cerebrovascular diseases and in conditions affecting the cerebral vasculature. Eur J Neurol 2003;10(6):609–620. [DOI] [PubMed] [Google Scholar]
- 36.Cogswell PM, Davis TL, Strother MK, et al. Impact of vessel wall lesions and vascular stenoses on cerebrovascular reactivity in patients with intracranial stenotic disease. J Magn Reson Imaging 2017;46(4):1167–1176. [DOI] [PMC free article] [PubMed] [Google Scholar]
Associated Data
This section collects any data citations, data availability statements, or supplementary materials included in this article.


