

Abstract
Background & Aims:
Accurate hepatitis C virus (HCV) incidence estimates are critical for monitoring progress towards HCV elimination goals, including an 80% reduction in HCV incidence by 2030. Moreover, incidence estimates can help guide prevention and treatment programming, particularly in the context of the US opioid epidemic.
Methods:
An inexpensive, Genedia-based HCV IgG antibody avidity assay was evaluated as a platform to estimate cross-sectional, population-level primary HCV incidence using 1840 HCV antibody and RNA positive samples from 875 individuals enrolled in 5 cohort studies in the US and India. Using samples collected <2 years following HCV seroconversion, the mean duration of recent infection (MDRI) was calculated by fitting a maximum likelihood binomial regression model to the probability of appearing recent. Among samples collected ≥2 years post-HCV seroconversion, a subject-level false recent ratio (FRR) was calculated by estimating the probability of appearing recent using an exact binomial test. Factors associated with falsely appearing recent among samples collected ≥2 years post seroconversion were determined by Poisson regression with generalized estimating equations and robust variance estimators.
Results:
An avidity index cutoff of <40% resulted in an MDRI of 113 days (95%CI:84–146), and an FRR of 0.4% (95%CI:0.0–1.2), 4.6% (95%CI:2.2–8.3), and 9.5% (95%CI:3.6–19.6) among persons who were HIV-uninfected, HIV-infected, and HIV-infected with a CD4 count <200, respectively. No variation was seen between HCV genotypes 1 and 3. In hypothetical scenarios of high-risk settings, a sample size of <1000 individuals could reliably estimate primary HCV incidence.
Conclusions:
This cross-sectional approach can estimate primary HCV incidence for the most common genotypes. This tool can serve as a valuable resource for program and policy planners seeking to monitor and reduce HCV burden.
Keywords: HCV, HIV/HCV coinfection, incidence, surveillance, recent infection
Lay Summary:
Determining the rate of new hepatitis C virus (HCV) infections in a population is critical to monitoring progress toward HCV elimination and to appropriately guide control efforts.
However, since HCV infections are most often initially asymptomatic, it is difficult to estimate the rate of new HCV infections without following HCV-uninfected people over time and repeatedly testing them for HCV infection. Here, we present a novel, resource-efficient method to estimate the rate of new HCV infections in a population using data from a single timepoint.
Graphical Abstract
Introduction
Approximately 71 million people worldwide were chronically infected with HCV in 2015[1]. Injection drug use (IDU) is a major risk factor for HCV infection[2, 3]; the burden of which ranges from 50%−90% in people who inject drugs (PWID)[4–6]. Expanded prevention and treatment efforts have decreased HIV incidence in PWID in some settings, but HCV incidence remains high (from 3.1/100 person-years - 27.2/100 person-years) in the few settings where it has been measured[7–9]. The introduction of short duration (8–12 weeks), efficacious (>95% cure), all-oral and tolerable direct acting antivirals for management of HCV has already sparked conversation on the role of curative HCV treatment as prevention[10, 11]. Accurate population-level HCV incidence estimates are needed to monitor the WHO goal of eliminating HCV since one of the metrics of elimination is an 80% reduction in incidence[12]. In addition, it is important to monitor HCV incidence, which typically antedates HIV incidence and is an early biomarker of an HIV epidemic fueled by IDU. This is particularly relevant for the current US opioid crisis as evidenced by the outbreak observed in Scott County, Indiana[13]. HCV incidence estimates can also be helpful for identifying high-risk populations. Finally, incidence monitoring can be used to measure the effectiveness of HCV prevention interventions, harm reduction, and other interventions to mitigate the consequences of the opioid crisis.
Although HCV is a reportable infection in the US, existing surveillance of acute HCV infection is insensitive. In one study of 149 cases clinically diagnosed as acute HCV infection, only 1 case was confirmed by the local surveillance system[14]. Within a given setting, the gold standard for measuring HCV incidence uses longitudinal follow-up of at-risk individuals. These cohort studies are logistically difficult, resource intensive, and the study participants may not reflect the underlying population at risk. The ability to estimate HCV incidence using data collected from cross-sectional biobehavioral surveys can address many of these challenges[15, 16]. Recent HCV infections can be distinguished from chronic HCV infections using a multi-assay approach of anti-HCV IgG avidity assays and virologic confirmation of infection[17–19]. Previous studies developing this approach have been based on various modifications to the Ortho HCV 3.0 ELISA Test System Avidity Assay (Ortho Clinical Diagnostics, Raritan, NJ). This approach has been shown to perform differently on genotype (GT) 1 and GT3 samples[18] and is expensive (~ $40 USD/sample). Building on this work, we developed and evaluated a modified-Genedia HCV ELISA Avidity Assay (Green Cross Medical Science Corp., Chungbik, Korea), costing ~ $4 USD/sample, in combination with virologic confirmation to estimate cross-sectional HCV incidence.
Materials and Methods
Study Specimens
Data were derived from five prospective PWID cohort studies: The Baltimore Before and After Acute Study of Hepatitis (BBAASH)[7] and AIDS Linked to the IntraVenous Experience (ALIVE) studies in Baltimore, MD[20]; the UFO Study in San Francisco, CA[21]; and the Chennai HIV, HCV and EEral Study (CHHEERS)[22, 23] and Madras Injection Drug User and AIDS Cohort Study (MIDACS) in Chennai, India[24, 25]. Participants provided written informed consent, consented to long-term storage of serum/plasma samples (−80°C), and received counseling about their infection status and drug use. Studies were approved by institutional review boards of the University of California, San Francisco (UFO), Johns Hopkins University (JHU) School of Medicine (BBAASH, ALIVE), JHU School of Public Health (MIDACS, CHHEERS), and YRGCARE IRB (CHHEERS, MIDACS).
Samples were selected based on plasma/serum availability, HCV-positive serostatus, HCV RNA ≥500 IU/mL, known duration of HCV infection and treatment-naive (Table.1). A total of 1840 samples from 875 individuals were used, including 299 samples from 116 individuals with an observed HCV seroconversion event while under one- or three-month follow-up, in BBAASH and UFO, respectively. The remaining samples came from individuals undergoing semi-annual follow-up with a known duration of infection of ≥2 years. The distribution of gender, race or ethnicity, age, and HIV status among samples in this study differed by cohort reflecting the underlying populations enrolled in each. All cohorts had more men than women, and the Chennai cohorts had no women consistent with the epidemiology of drug use in Southern India[26, 27]. The age distribution of individuals in BBAASH and UFO, which enrolled subjects who were HCV seronegative and followed them for seroconversion, was younger than the other cohorts. Among participants with known GT, those enrolled in BBAASH and ALIVE were primarily infected with GT1 viruses, while GT3 infections were more common in CHHEERS and MIDACS. UFO had large proportions of both GT1 and GT3 infections. The majority of samples collected from participants living with HIV were collected from individuals enrolled in ALIVE, CHHEERS, and MIDACS. In samples collected from HIV-infected individuals, the median CD4+ T-cell counts were highest among MIDACS participants and lowest among ALIVE participants.
Table.1.
Characteristics of study population.
| BBAASH | UFO | ALIVE | CHHEERS | MIDACS | ||||||
|---|---|---|---|---|---|---|---|---|---|---|
| No. Indiv. (%) | No. Samp. (%) | No. Indiv. (%) | No. Samp. (%) | No. Indiv. (%) | No. Samp. (%) | No. Indiv. (%) | No. Samp. (%) | No. Indiv. (%) | No. Samp. (%) | |
| 48 | 212 | 73 | 165 | 396 | 541 | 161 | 564 | 197 | 358 | |
| Duration of HCV infection * | ||||||||||
| <2 years | 47 | 162 | 69 | 137 | 0 | 0 | 0 | 0 | 0 | 0 |
| ≥2 years | 25 | 50 | 15 | 28 | 396 | 541 | 161 | 564 | 197 | 358 |
| Gender | ||||||||||
| Female | 19 (39.5) | 72 (33.9) | 23 (31.5) | 35 (21.2) | 108 (27.3) | 142 (26.2) | 0 (0) | 0 (0) | 0 (0) | 0 |
| Male | 29 (60.5) | 140 (66.1) | 50 (68.5) | 130 (78.8) | 288 (72.7) | 399 (73.8) | 161 (100) | 564 (100) | 197 (100) | 358 (100) |
| Race/Ethnicity | ||||||||||
| Black | 5 (10.4) | 17 (8.0) | 1 (1.4) | 1 (0.6) | 354 (89.1) | 494 (91.3) | ||||
| Non-Black | 43 (89.6) | 195 (92.0) | 72 (98.6) | 164 (99.4) | 42 (10.9) | 47 (8.7) | ||||
| Tamilian | 151 (93.8) | 531 (94.2) | 192 (97.5) | 349 (97.5) | ||||||
| Non-Tamilian | 10 (6.2) | 33 (5.8) | 5 (2.5) | 9 (2.5) | ||||||
| Median Age (IQR) | 25 (23–27) | 26 (24–28) | 46 (41–51) | 44 (40–48) | 39 (34–43) | |||||
| HCV Genotype | ||||||||||
| 1 | 39 (81.3) | 180 (84.9) | 37 (50.7) | 87 (52.7) | 136 (34.4) | 250 (46.2) | 21 (13.0) | 77 (13.7) | 24 (12.2) | 38 (10.6) |
| 2 | 4 (8.3) | 13 (6.1) | 7 (9.6) | 13 (7.9) | 6 (1.5) | 12 (2.2) | 0 (0) | 0 (0) | 0 (0) | 0 (0) |
| 3 | 4 (8.3) | 15 (7.1) | 23 (31.5) | 54 (32.7) | 1 (0.3) | 2 (0.4) | 116 (72.0) | 401 (71.1) | 165 (83.8) | 308 (86.0) |
| 4 | 0 (0) | 0 (0) | 1 (1.4) | 3 (1.8) | 0 | 0 (0) | 1 (0.6) | 8 (1.4) | 0 (0) | 0 (0) |
| 6 | 0 (0) | 0 (0) | 0 (0) | 0 (0) | 0 | 0 (0) | 5 (3.1) | 20 (3.5) | 1 (0.5) | 1 (0.3) |
| Unknown | 1 (2.1) | 4 (1.9) | 5 (6.8) | 8 (4.9) | 253 (63.9) | 277 (51.2) | 18 (11.2) | 58 (10.3) | 7 (3.6) | 11 (3.1)) |
| HIV positive | 1 (2.1) | 1 (0.5) | 1 (1.4) | 1 (0.6) | 119 (30.1) | 151 (27.9) | 51 (31.7) | 243 (43.1) | 48 (24.4) | 55 (15.4) |
| Median CD4+ T-cell count (cells/μL) among HIV+ (IQR) | N/A | N/A | 272 (148–423) | 368 (279–498) | 475 (351–606) | |||||
Some individuals contributed samples > and <2 years post seroconversion
Abbreviations: BBAASH, Baltimore-Before and after Acute Study of Hepatitis; ALIVE, AIDS Linked to the IntraVenous Experience; CHHEERS, Chennai HIV, Hepatitis C and EEral Study; MIDACS, Madras Injection Drug User and AIDS Cohort Study
For participants with an observed HCV seroconversion event during follow-up, the date of seroconversion was estimated as follows: 1) for individuals with an RNA positive and HCV antibody negative visit, the estimated date of seroconversion was 22.5 days after that visit date[7]; 2) for individuals with an RNA positive and HCV antibody negative visit that occurred less than 22.5 days prior to the first date of RNA positive and HCV antibody positive visit, the estimated date of seroconversion was the midpoint between the two visits; 3) for all other individuals the estimated date of seroconversion was the midpoint between the last HCV antibody negative visit date and the first HCV antibody positive visit date-restricted to <180 days between these two visits. The date of seroconversion for samples collected from individuals HCV antibody positive at enrollment could not be estimated, but samples were only selected from visits ≥2 years after enrollment.
Modified-Genedia Avidity Assay
HCV IgG antibody avidity was determined by modification of the Genedia HCV ELISA 3.0 assay. Samples were incubated overnight (12–18 hours) in duplicate (intra-assay) on a Genedia 3.0 HCV EIA plate (10 μL specimen in 200 μL sample diluent) on a plate shaker (500 rpm) at room temperature (RT) (22–25°C). Using an automatic Biotek ELx405TM Microplate washer, the entire plate was washed once with 1X wash buffer (WB) (200 μL). One well of each sample was manually treated with 300 μL of 11M urea (prepared using 1X wash buffer) to dissociate antigen-antibody complexes, while the second well was treated with 300 μL of 1x WB for 5 minutes at RT. The entire plate was then washed once with 1X WB (200 μL). The dissociation step was repeated two additional times. Following the third dissociation step the entire plate was washed six times with 1X WB (300 μL). The remainder of the assay (beginning with the addition of conjugate) was performed per manufacturer’s protocol. Blank, negative, and positive controls provided in the Genedia kit, an incident control (ZeptoMetrix, Buffalo, NY), and a prevalent control (collected from individuals ~ 6.5 years after seroconversion) were run in duplicate on every plate.
HCV avidity for each sample was reported as an avidity index (AI), calculated as the ratio of absorbance (OD) of the well treated with the 11M urea to the well treated with WB reported as a percentage. An AI of 100% signified strongest antibody-antigen binding. In the primary analyses, all samples with a WB OD of <0.1 (n=12), indicating very recent infection, were considered to have an AI of <10%. Sensitivity analyses were carried out removing samples with a WB optical density <0.1[18].
Additional laboratory testing protocols and assays for HCV IgG, HCV RNA, and HCV GT are detailed in Supplementary.Table.1. Because prior studies have shown low avidity among samples with no or very low HCV RNA[17, 18], we limited our analysis to HCV RNA positive samples. Samples were considered HCV RNA positive if they had an HCV viral load >500 IU/mL or had sufficient HCV RNA to determine a GT in the absence of HCV RNA viral load testing (MIDACS and CHHEERS). For individuals from whom multiple samples ≥2 years post enrollment were used (ALIVE, MIDACS, and CHHEERS) RNA testing was not always performed for all samples. A positive RNA test on the earliest available sample was used as an indicator of chronic infection, and all subsequent samples were assumed RNA positive in the absence of testing. HIV status was ascertained by ELISA testing followed by Western blot confirmation, and CD4+ T-cell count determination.
Statistical Analyses
Biomarker-based algorithms to estimate incidence can be characterized by two parameters: the mean duration of recent infection (MDRI) and the false recent ratio (FRR)[28–30]. These parameters are dependent on a time-scale cutoff (T), which defines the time samples are allowed to appear recently infected by the algorithm. We defined T=2 years (730.5 days) based on the delayed humoral immune response to HCV infection[7], and consistent with prior studies[17, 31].
Using samples collected <2 years following HCV seroconversion, the MDRI was calculated in increments of 10% by fitting a binomial regression to the probability of appearing recent based on the testing algorithm with a logit link on a polynomial in time since HCV seroconversion of the third degree; corresponding 95%CI were calculated using 1000 bootstrap replicates[15, 28, 30].
Using samples collected ≥2 years following seroconversion each participant was assigned a recency status based on the majority of samples for that individual. If exactly half of a participant’s samples were classified as recent the participant then contributed a count of 0.5 to the FRR numerator. Among samples collected after the time cutoff T, the subject-level FRR was calculated in increments of 10% by estimating the probability of appearing recent using an exact binomial test, corresponding 95%CI were determined from a binomial distribution. We defined recent infection as having an AI <40%, for further analyses.
We determined factors associated with falsely appearing recent (AI<40%) among samples collected ≥2 years post-HCV seroconversion. Univariable and multivariable prevalence ratios (PRs) and 95%CI were calculated from modified Poisson regression models using generalized estimating equations accounting for clustering of samples within subjects, an exchangeable correlation structure, and a robust variance estimator[32]. Cohort was included as a predictor in all models. Due to collinearity in the data, gender was not included in multivariable analysis.
The precision of the testing algorithm using an AI cutoff of 40% to estimate incidence in various hypothetical scenarios representative of low, moderate, and high burden HCV epidemics was assessed. The sample size needed to estimate HCV incidence with a relative standard error (RSE) of 30%, as guided by the WHO/UNAIDS Working Group on Cross-Sectional Incidence Assays[33], was determined across ranges of HCV incidence and HCV and HIV prevalence. For all precision calculations, the RSE of the MDRI and FRR were set to 14% and 33%, respectively, based on the parameters of the testing algorithm at an AI cutoff of 40%.
The MDRI, FRR, and precision analyses were conducted using the inctools package[28] and implemented in R (The R Foundation for Statistical Computing, Vienna, Austria). Other analyses were conducted using Stata (StataCorp, College Station, Texas).
A complete, transparent, accurate and timely account of relevant methods are detailed in Supplementary.CTAT.Table.
Results
HCV avidity increased with time post-HCV seroconversion among samples with a known duration of infection (Figure.1). By two years post-HCV seroconversion, the majority of samples had an avidity index >90%[17].
Figure.1. Genedia-Avidity index values as a function of time since HCV seroconversion.

299 samples were collected from 116 seroconverters in the BBAASH and UFO cohorts. Box-and-whisker plots of the avidity index (AI) values in increments of 10% depict the median, interquartile range, and highest and lowest AI of each given time interval post-HCV seroconversion.
The MDRI of the Genedia-Avidity Assay at AI cutoffs in increments of 10% for all samples combined and stratified by GT1 and GT3 are presented in Figure.2. The MDRI increased with increasing AI. At an AI cutoff of 40% the MDRI was 113 days (95%CI:=84–146) (Supplementary.Table.2). The MDRI of GT1 and GT3 at AI<40% were 110 days (95%CI=831–45) and 139 days (95%CI=51–214), respectively (Supplementary.Table.3).
Figure.2. Mean duration of recent infection of Genedia-Avidity by avidity index.

Mean duration of recent infection (MDRI) calculated by fitting a binomial regression to the probability of appearing recent and 95%CIs calculated using 1000 bootstrap replicates, are shown by avidity index (AI) cutoffs in increments of 10%. (A) The MDRI (solid line) and 95%CI (dashed lines) for 299 samples from 116 individuals. (B) The MDRI for 210 genotype (GT) 1 samples from 73 individuals (light grey), and 60 GT3 samples from 26 individuals (dark grey).
The FRR of the Genedia-Avidity Assay at AI cutoffs in increments of 10% for all samples combined and stratified by GT and HIV status are presented in Figure.3. Similar to the MDRI, FRR increased with increasing AI. Using an AI cutoff of 40% the FRR was 1.5% (95%CI=0.8–2.6) (Supplementary.Table.2). The FRR of GT1 and GT3 at AI<40% were 1.0% (95%CI=0.1–3.4) and 0.7% (95%CI=0.1–2.5), respectively (Supplementary.Table.3). Among samples with an unknown GT, the FRR at AI<40% was 2.0% (95%CI=0.9–3.9), owing to the high HIV proportion of HIV positive samples with an unknown GT in this group (data not shown). The FRR at AI<40% in GT1 and GT3 samples, when limited to only HIV uninfected samples, was 0% (95%CI=0.0–2.2) and 0.5% (95%CI=0–2.5), respectively (Supplementary.Table.4). The FRR of HIV-uninfected and infected samples at AI<40% were 0.4% (95%CI=0.0–1.2) and 4.6% (95%CI=2.2–8.3), respectively (Supplementary.Table.5). Among samples from HIV-infected individuals the FRR of those with ≥200 CD4+ T-cell/μL and <200 CD4+ T-cell/μL at AI<40% were 2.5% (95%CI=0.7–6.2) and 9.5% (95%CI=3.6–19.6), respectively (Supplementary.Table.6).The MDRI, and FRR (overall, by GT, by HIV status, and by CD4+ T-cell level) among those with wash OD>0.1 were similar to the primary analyses (data not shown).
Figure.3. False recent ratio of HCV Genedia-Avidity by avidity index.

Subject-level False Recent Ratios (FRR) calculated by estimating the probability of appearing recent using an exact binomial test and 95%CIs determined from a binomial distribution are shown by avidity index (AI) cutoffs in increments of 10%. (A) The FRR (solid line) and 95%CI (dashed lines) for 1541 samples from 794 individuals. (B) The FRR for 426 genotype (GT) 1 samples from 208 individuals (light grey), and 723 GT3 samples from 291 individuals (dark grey). (C) The FRR for 1091 HIV-uninfected samples from 578 individuals (light grey), and 449 HIV-infected samples from 218 individuals (dark grey). (D) The FRR for 274 HIV-infected samples from 163 individuals with a CD4 T-cell count ≥200 (light grey), and 76 HIV-infected samples from 63 individuals with a CD4 T-cell count <200 (dark grey).
Age, gender, and GT were not associated with a lower avidity response (AI<40%) among samples collected ≥2 years post-HCV seroconversion. However, in this sample set, a lower avidity response (AI<40%) was more likely to be observed in individuals infected with HIV who had a CD4+ T-cell count <200 cells/μL, adjPR=22.0 (95%CI=6.28–77.01; p<0.001) compared to HIV negative individuals (Table.2). Samples collected from individuals infected with HIV with a CD4+ T-cell count >200 cells/μL were not significantly more likely to have a lower avidity response (AI<40%) compared to HIV uninfected individuals, adjPR=3.05 (95%CI=0.58–15.90; p=0.187).
Table.2. Factors associated with an avidity index <40% among HCV RNA positive samples collected more than 2 years post-HCV seroconversion.
Prevalence ratios (PR) and 95%CIs were calculated from modified Poisson regression models using generalized estimating equations to account for the clustering of samples within subjects, an exchangeable correlation structure, and a robust variance estimator to indicate associations with a Genedia-Avidity Index <40% among samples collected ≥2 years post-HCV seroconversion. P-values calculated using Wald test. These data are indicative of misclassification of samples collected after two years post-HCV seroconversion as ‘recent’ infection. All models adjusted for cohort.
| Characteristic | Univariable | Multivariable | |||
|---|---|---|---|---|---|
| (n/N) | PR [95%CI] | P-value | PR [95%CI] | P-value | |
| Gender | |||||
| Male | (19/1383) | (ref) | |||
| Female | (3/158) | 1.35 (0.35, 5.31) | 0.663 | ||
| Age (years) | |||||
| 18–34 | (3/247) | (ref) | (ref) | ||
| 35–44 | (8/681) | 1.47 (0.48, 4.51) | 0.501 | 0.45 (0.10, 2.08) | 0.306 |
| ≥45 | (11/613) | 1.07 (0.32, 3.57) | 0.908 | 1.06 (0.18, 6.19) | 0.950 |
| HCV Genotype | |||||
| 1 | (4/426) | (ref) | (ref) | ||
| Other (2, 3, 4, 6) | (9/769) | 1.52 (0.07, 34.41) | 0.791 | 0.54 (0.02, 14.47) | 0.712 |
| HIV Status | |||||
| Negative | (5/1091) | (ref) | (ref) | ||
| Positive CD4+ T-cell count ≥ 200 cells/μL | (6/274) | 5.18 (1.49, 17.94) | 0.010 | 3.05 (0.58, 15.90) | 0.187 |
| Positive CD4+ T-cell count < 200 cells/μL | (8/76) | 21.27 (6.17, 73.37) | <0.001 | 22.0 (6.28, 77.01) | <0.001 |
| Total | 22/1541 | ||||
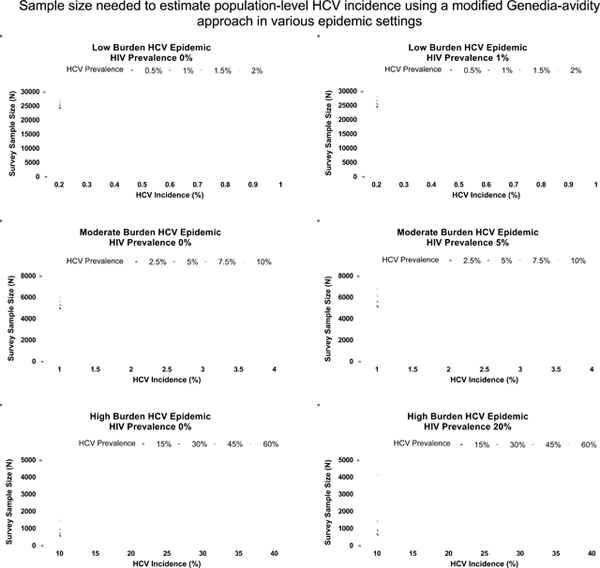
To determine the utility of the HCV Genedia-Avidity approach, we simulated populations reflecting low, moderate, and high burden HCV epidemics and assessed the approach’s precision to estimate incidence using an AI cutoff of 40%, with an RSE of 30% (Figure.4). To estimate incidence in a low burden setting (HCV prevalence 0.5–2%; incidence 0.2–1%), reflective of general populations, the sample size needed was >4,000 across all variations regardless of HIV prevalence. In a moderate burden setting (HCV prevalence of 2.5–10%; incidence of 1–4%), once incidence reached 2% the sample size needed to estimate HCV incidence is <3,000 individuals regardless of HIV prevalence. High burden settings (HCV prevalence 15–60%; incidence 10–40%) require <1000 individuals to estimate incidence regardless of HIV prevalence.
Figure.4. Precision of Genedia-Avidity Approach to estimate primary HCV incidence in various populations.

The sample sizes represent the total number of individuals (HCV seropositive and seronegative) required in a single cross-sectional survey to achieve an incidence estimate with a relative standard error (RSE) of 30% using the modified-Genedia-Avidity approach with an avidity index <40%. HCV and HIV seroprevalence was varied to represent different epidemic states. The RSE for the mean duration of recent infection and false recent ratio was 14%, and 33%, respectively.
Conclusions
There has been increased interest in biomarker-based approaches for accurate detection of recent HCV infection similar to those for HIV[17–19]. However, these approaches have utilized an expensive assay that has shown limited utility outside of GT1 infections. Here, samples with a known duration of infection collected from five prospective cohort studies of PWID were used to evaluate a modified-Genedia-Avidity assay coupled with viremic confirmation to estimate population-level, cross-sectional incidence of primary HCV infection. We demonstrate that this approach can identify recently infected individuals in this high-risk population, with a low frequency of false recency and without being affected by GT. In simulated populations of high HCV incidence, this approach required a sample size of fewer than 1,000 individuals to accurately estimate incidence. This study demonstrates an inexpensive approach to accurately estimate primary HCV incidence from a cross-sectional survey.
Cross-sectional, biomarker-based approaches to estimate incidence require a large MDRI and low FRR[34]. The UNAIDS/WHO Working Group on Global HIV/AIDS and STI Surveillance has specified an MDRI>120 days and an FRR<2.5% for HIV cross-sectional incidence testing[34]. While specific criteria for HCV have yet to be established, using the modified-Genedia approach, we have proposed an AI cutoff of <40% to achieve the most optimal MDRI and FRR combination using the HIV criteria as a reference. At this cutoff, misclassification is strongly associated with poor immune status among those with HIV. This association has been shown previously[17], and will likely be a factor in any biomarker-based approaches that rely on the development of a robust and long-term immune response to infection. However, this is unlikely to pose a problem in settings with high ART coverage or early during HIV outbreaks when the majority of those infected have not progressed to AIDS. Importantly, this approach does not appear to have differential MDRI or FRR when comparing GT1 and GT3, as seen in other avidity-based approaches[18]. Having an approach that can be used regardless of GT removing the need for costly GT testing and figuring out how to estimate incidence testing in a mixed GT population using tests with different performance characteristics is advantageous.
Two types of misclassification can impede the utility of cross-sectional incidence assays; misidentifying truly recently infected individuals as not recently infected, and identifying non-recently infected individuals as recently infected, often referred to as the FRR[35]. Recently infected individuals are rarer within a population relative to chronically infected individuals, particularly for HCV where rates of chronicity and prevalence are high, placing a premium on a low FRR. The overall FRR, including all HIV-infected and HIV-uninfected samples together, in our study was low, 1.5%, which is reasonably low and the specificity of this approach is high, similar to previous studies[18].
The longer the MDRI, the fewer individuals need to be sampled to accurately estimate incidence. To this effect, the goal is to maximize the MDRI as much as possible without increasing the FRR to the detriment of the algorithm. Prior studies have reported slightly longer MDRIs using an Ortho HCV Version 3.0 ELISA Test System[17, 18]. However, similar to the modified-Ortho approach[17] the modified-Genedia approach demonstrated a necessary sample size of <1000 individuals to estimate HCV incidence in high burden populations. The Ortho HCV Version 3.0 ELISA Test System costs ~$40 USD/sample, while the Genedia HCV ELISA 3.0 assay costs ~$4 USD/sample. This discrepancy in cost, even in scenarios requiring larger sample sizes for precision, will likely result in less expensive implementation of the Genedia approach as it is unlikely to require a ten-fold higher sample size.
Our study has limitations. Although every individual had RNA testing completed on at least one sample, RNA testing was not performed on every sample collected from individuals observed to be infected ≥2 years (i.e., FRR calculations). For these individuals, we assumed those who tested RNA positive once were chronically infected, given that clearance would have more plausibly occurred early in infection. However, if some samples were included from individuals who cleared their infections but were assumed to be chronic, this would have resulted in an overestimate of the FRR. Approximately, one-quarter to one-half of PWID who clear their initial infection do become reinfected, and up to one-quarter of chronically infected PWID are superinfected with HCV[36–38], but we were unable to assess the effect of reinfection and superinfection using this approach due to sample limitations. However, we hypothesize that reinfection and superinfections would appear as chronic infections using the Genedia approach since it has been shown that AI does not have a linear increasing relationship with duration of infection in individuals who have cleared their infections (Supplementary.Figure.1)[18]. As we move towards the WHO’s 2030 goals[12] reinfection may be best monitored through routine HCV RNA screening of previously treated individuals engaged in care, while the Genedia approach could be used for general serosurveys of incidence of primary infections in a large population who may not yet be engaged in care. While it has been shown that HCV antibody dynamics in early infection may differ among HIV-infected individuals compared to uninfected individuals[39] we did not have a sufficient sample size of HIV-infected HCV seroconverters to assess the impact of HIV on the MDRI. However, the FRR was not impacted by HIV status alone, but instead by low immune status among those with HIV infections.
Our study also has several strengths. We had a large sample size of >1800 samples from five cohorts of PWID from four cities and two countries. Within these cohorts we were able to collect enough GT1 and GT3 specimens, which account for almost 70% of infections globally[1], to demonstrate that the Genedia-Avidity assay performance does not differ by these two GT as was seen with other avidity-based assays[18]. We had 299 samples collected from individuals monthly (BBAASH)[7] or quarterly (UFO)[21] who enrolled HCV negative and were followed for HCV infection. This coupled with the restriction of <180 days between an HCV RNA-/EIA- and HCV RNA+/EIA+ visit enabled us to estimate dates of seroconversion with good accuracy, allowing for a more precise MDRI.
Here we have evaluated a Genedia-Avidity based approach for estimating primary HCV infection incidence in cross-sectional settings. We have demonstrated that this approach has the ability to serve as a tool to estimate primary HCV incidence with reasonable sample sizes in high-risk populations, limited expense, and without genotypic limitations (GT1 vs. GT3). Importantly, external validation studies particularly in cohorts where longitudinal incidence has been estimated and cross-sectional incidence can be calculated and compared are still needed for understanding the real-world utility of this approach for measuring cross-sectional incidence in both low and high-risk populations. Studies to assess whether this method can reliably and accurately discriminate recently from non-recently infected individuals who have previously cleared their infections naturally or through medication will be helpful in understanding how well this approach will be able to estimate overall incidence (not just primary incidence) from a cross-sectional sample in populations with high rates of reinfection. However, while we await further validation, these data do support the use of this tool to identify recent primary HCV infections within high-risk populations. Even with the aforementioned limitations, this tool can be used to characterize the epidemiology of recent infections and the design of targeted interventions to reduce further transmission and therefore has the potential to serve as a valuable resource to monitor the impact of programs and policies aimed toward reducing HCV incidence.
Supplementary Material
Highlights.
This avidity-based approach can discriminate recent from non-recent HCV infections
This approach does not produce differential results by genotype
This cross-sectional approach can be used to estimate incidence using an n<1000
Acknowledgement
We thank participants and staff of the BBAASH, ALIVE, UFO, MIDACS, and CHHEERS cohorts and SACEMA for providing incidence tools. This work was facilitated by JHU-CFAR.
Financial Support
This work was supported primarily by the Division of Intramural Research, National Institutes of Allergy and Infectious Diseases (NIAID), National Institutes of Health (NIH). This work was also supported by NIH extramural grants: R01DA016017, T32DA007292, T32AI102623, R01DA026727, U19AI088791, R01AI108403, R01AI077757, R01DA12568, 5R01AI095068, R37DA013806, 3-R01DA016017, U01DA036297, UM1AI068613, and P30AI094189. The funders had no role in the design, data collection and analysis, decision to publish, or preparation of the manuscript.
Footnotes
Conflicts of Interest
The authors do not have potential conflicts of interest to declare.
Publisher's Disclaimer: This is a PDF file of an unedited manuscript that has been accepted for publication. As a service to our customers we are providing this early version of the manuscript. The manuscript will undergo copyediting, typesetting, and review of the resulting proof before it is published in its final form. Please note that during the production process errors may be discovered which could affect the content, and all legal disclaimers that apply to the journal pertain.
References
- [1].Polaris Observatory HCVC. Global prevalence and genotype distribution of hepatitis C virus infection in 2015: a modelling study. Lancet Gastroenterol Hepatol 2017;2:161–176. [DOI] [PubMed] [Google Scholar]
- [2].Degenhardt L, Hall W. Extent of illicit drug use and dependence, and their contribution to the global burden of disease. Lancet 2012;379:55–70. [DOI] [PubMed] [Google Scholar]
- [3].MacDonald M, Crofts N, Kaldor J. Transmission of hepatitis C virus: rates, routes, and cofactors. Epidemiol Rev 1996;18:137–148. [DOI] [PubMed] [Google Scholar]
- [4].Abraham P Viral hepatitis in India. Clinics in laboratory medicine 2012;32:159–174. [DOI] [PubMed] [Google Scholar]
- [5].Latkin C, Srikrishnan AK, Yang C, Johnson S, Solomon SS, Kumar S, et al. The relationship between drug use stigma and HIV injection risk behaviors among injection drug users in Chennai, India. Drug and alcohol dependence 2010;110:221–227. [DOI] [PMC free article] [PubMed] [Google Scholar]
- [6].Thomas DL. Global control of hepatitis C: where challenge meets opportunity. Nature medicine 2013;19:850–858. [DOI] [PMC free article] [PubMed] [Google Scholar]
- [7].Cox AL, Netski DM, Mosbruger T, Sherman SG, Strathdee S, Ompad D, et al. Prospective evaluation of community-acquired acute-phase hepatitis C virus infection. Clin Infect Dis 2005;40:951–958. [DOI] [PubMed] [Google Scholar]
- [8].Grebely J, Lima VD, Marshall BD, Milloy MJ, DeBeck K, Montaner J, et al. Declining incidence of hepatitis C virus infection among people who inject drugs in a Canadian setting, 1996–2012. PloS one 2014;9:e97726. [DOI] [PMC free article] [PubMed] [Google Scholar]
- [9].Hagan H, Pouget ER, Williams IT, Garfein RL, Strathdee SA, Hudson SM, et al. Attribution of hepatitis C virus seroconversion risk in young injection drug users in 5 US cities. The Journal of infectious diseases 2010;201:378–385. [DOI] [PubMed] [Google Scholar]
- [10].Martin NK, Vickerman P, Foster GR, Hutchinson SJ, Goldberg DJ, Hickman M. Can antiviral therapy for hepatitis C reduce the prevalence of HCV among injecting drug user populations? A modeling analysis of its prevention utility. Journal of hepatology 2011;54:1137–1144. [DOI] [PubMed] [Google Scholar]
- [11].Martin NK, Vickerman P, Grebely J, Hellard M, Hutchinson SJ, Lima VD, et al. Hepatitis C virus treatment for prevention among people who inject drugs: Modeling treatment scale-up in the age of direct-acting antivirals. Hepatology 2013;58:1598–1609. [DOI] [PMC free article] [PubMed] [Google Scholar]
- [12].WHO. Combating Hepatitis B and C to Reach Elimination by 2030. Geneva: World Health Organization; 2015. November, 11. [Google Scholar]
- [13].Peters PJ, Pontones P, Hoover KW, Patel MR, Galang RR, Shields J, et al. HIV Infection Linked to Injection Use of Oxymorphone in Indiana, 2014–2015. The New England journal of medicine 2016;375:229–239. [DOI] [PubMed] [Google Scholar]
- [14].Onofrey S, Aneja J, Haney GA, Nagami EH, DeMaria A Jr., Lauer GM, et al. Underascertainment of acute hepatitis C virus infections in the U.S. surveillance system: a case series and chart review. Ann Intern Med 2015;163:254–261. [DOI] [PMC free article] [PubMed] [Google Scholar]
- [15].Brookmeyer R, Konikoff J, Laeyendecker O, Eshleman SH. Estimation of HIV incidence using multiple biomarkers. American journal of epidemiology 2013;177:264–272. [DOI] [PMC free article] [PubMed] [Google Scholar]
- [16].Brookmeyer R, Laeyendecker O, Donnell D, Eshleman SH. Cross-sectional HIV incidence estimation in HIV prevention research. Journal of acquired immune deficiency syndromes 2013;63 Suppl 2:S233–239. [DOI] [PMC free article] [PubMed] [Google Scholar]
- [17].Patel EU, Cox AL, Mehta SH, Boon D, Mullis CE, Astemborski J, et al. Use of Hepatitis C Virus (HCV) Immunoglobulin G Antibody Avidity as a Biomarker to Estimate the Population-Level Incidence of HCV Infection. The Journal of infectious diseases 2016;214:344–352. [DOI] [PMC free article] [PubMed] [Google Scholar]
- [18].Shepherd SJ, McDonald SA, Palmateer NE, Gunson RN, Aitken C, Dore GJ, et al. HCV avidity as a tool for detection of recent HCV infection: Sensitivity depends on HCV genotype. J Med Virol 2018;90:120–130. [DOI] [PubMed] [Google Scholar]
- [19].Hope VD, Harris RJ, Vickerman P, Platt L, Shute J, Cullen KJ, et al. A comparison of two biological markers of recent hepatitis C virus (HCV) infection: implications for the monitoring of interventions and strategies to reduce HCV transmission among people who inject drugs. Euro Surveill 2018;23. [DOI] [PMC free article] [PubMed] [Google Scholar]
- [20].Vlahov D, Anthony JC, Munoz A, Margolick J, Nelson KE, Celentano DD, et al. The ALIVE study, a longitudinal study of HIV-1 infection in intravenous drug users: description of methods and characteristics of participants. NIDA research monograph 1991;109:75–100. [PubMed] [Google Scholar]
- [21].Page K, Hahn JA, Evans J, Shiboski S, Lum P, Delwart E, et al. Acute hepatitis C virus infection in young adult injection drug users: a prospective study of incident infection, resolution, and reinfection. J Infect Dis 2009;200:1216–1226. [DOI] [PMC free article] [PubMed] [Google Scholar]
- [22].Mehta SH, Vogt SL, Srikrishnan AK, Vasudevan CK, Murugavel KG, Saravanan S, et al. Epidemiology of hepatitis C virus infection & liver disease among injection drug users (IDUs) in Chennai, India. Indian J Med Res 2010;132:706–714. [PMC free article] [PubMed] [Google Scholar]
- [23].Solomon SS, Celentano DD, Srikrishnan AK, Vasudevan CK, Murugavel KG, Iqbal SH, et al. Low incidences of human immunodeficiency virus and hepatitis C virus infection and declining risk behaviors in a cohort of injection drug users in Chennai, India. American journal of epidemiology 2010;172:1259–1267. [DOI] [PMC free article] [PubMed] [Google Scholar]
- [24].Solomon SS, Srikrishnan AK, Mehta SH, Vasudevan CK, Murugavel KG, Thamburaj E, et al. High prevalence of HIV, HIV/hepatitis C virus coinfection, and risk behaviors among injection drug users in Chennai, India: a cause for concern. Journal of acquired immune deficiency syndromes 2008;49:327–332. [DOI] [PMC free article] [PubMed] [Google Scholar]
- [25].Solomon SS, Hawcroft CS, Narasimhan P, Subbaraman R, Srikrishnan AK, Cecelia AJ, et al. Comorbidities among HIV-infected injection drug users in Chennai, India. The Indian journal of medical research 2008;127:447–452. [PMC free article] [PubMed] [Google Scholar]
- [26].Panda S, Kumar MS, Lokabiraman S, Jayashree K, Satagopan MC, Solomon S, et al. Risk factors for HIV infection in injection drug users and evidence for onward transmission of HIV to their sexual partners in Chennai, India. J Acquir Immune Defic Syndr 2005;39:9–15. [DOI] [PubMed] [Google Scholar]
- [27].Kumar MS, Mudaliar S, Thyagarajan SP, Kumar S, Selvanayagam A, Daniels D. Rapid assessment and response to injecting drug use in Madras, south India. The International journal on drug policy 2000;11:83–98. [DOI] [PubMed] [Google Scholar]
- [28].Kassanjee R, McWalter TA, Barnighausen T, Welte A. A new general biomarker-based incidence estimator. Epidemiology 2012;23:721–728. [DOI] [PMC free article] [PubMed] [Google Scholar]
- [29].Kassanjee R, McWalter TA, Welte A. Short Communication: Defining optimality of a test for recent infection for HIV incidence surveillance. AIDS research and human retroviruses 2014;30:45–49. [DOI] [PMC free article] [PubMed] [Google Scholar]
- [30].Kassanjee R, Pilcher CD, Keating SM, Facente SN, McKinney E, Price MA, et al. Independent assessment of candidate HIV incidence assays on specimens in the CEPHIA repository. AIDS 2014;28:2439–2449. [DOI] [PMC free article] [PubMed] [Google Scholar]
- [31].Netski DM, Mosbruger T, Depla E, Maertens G, Ray SC, Hamilton RG, et al. Humoral immune response in acute hepatitis C virus infection. Clinical infectious diseases : an official publication of the Infectious Diseases Society of America 2005;41:667–675. [DOI] [PubMed] [Google Scholar]
- [32].Zou G A modified poisson regression approach to prospective studies with binary data. American journal of epidemiology 2004;159:702–706. [DOI] [PubMed] [Google Scholar]
- [33].Surveillance UWWGoGHAaS. When and how to use assays for recent infection to estimate HIV incidence at a population level. 2011. [cited 1 May 2015]; Available from: http://www.who.int/diagnostics_laboratory/hiv_incidence_may13_final.pdf
- [34].UNAIDS/WHO Working Group on Global HIV/AIDS and STI Surveillance. When and how to use assays for recent infection to estimate HIV incidence at a population level. Geneva, Switzerland; 2011. [Google Scholar]
- [35].McWalter TA, Welte A. Relating recent infection prevalence to incidence with a sub-population of assay non-progressors. J Math Biol 2010;60:687–710. [DOI] [PubMed] [Google Scholar]
- [36].Cunningham EB, Applegate TL, Lloyd AR, Dore GJ, Grebely J. Mixed HCV infection and reinfection in people who inject drugs [mdash] impact on therapy. Nature Reviews Gastroenterology & Hepatology 2015. [DOI] [PubMed] [Google Scholar]
- [37].Osburn WO, Fisher BE, Dowd KA, Urban G, Liu L, Ray SC, et al. Spontaneous control of primary hepatitis C virus infection and immunity against persistent reinfection. Gastroenterology 2010;138:315–324. [DOI] [PMC free article] [PubMed] [Google Scholar]
- [38].Sacks-Davis R, Grebely J, Dore GJ, Osburn W, Cox AL, Rice TM, et al. Hepatitis C virus reinfection and spontaneous clearance of reinfection - the InC3 study. The Journal of infectious diseases 2015. [DOI] [PMC free article] [PubMed] [Google Scholar]
- [39].Thomson EC, Nastouli E, Main J, Karayiannis P, Eliahoo J, Muir D, et al. Delayed anti-HCV antibody response in HIV-positive men acutely infected with HCV. Aids 2009;23:89–93. [DOI] [PMC free article] [PubMed] [Google Scholar]
Associated Data
This section collects any data citations, data availability statements, or supplementary materials included in this article.