

Abstract
Computer-aided diagnosis (CAD), in the general sense, includes computer-aided detection and characterization of abnormalities on medical images. The usefulness of CAD for assisting radiologists in detection of breast cancer in screening mammography has been demonstrated by a number of prospective clinical trials in recent years. The development of CAD in other areas is also being actively pursued by researchers. In this talk, the recent work in two areas of CAD, digital breast tomosynthesis (DBT) and chest computed tomography (CT), in the CAD Research Laboratory at the University of Michigan will be reviewed.
DBT is a new modality under development for breast imaging. The quasi-3D information in DBT alleviates the problem of overlapping tissue in mammography and holds the promise to improve the sensitivity for cancer detection. DBT image analysis can be performed in the 3D reconstructed volume or the 2D projection view images. DBT image quality depends on the image acquisition parameters, reconstruction method and parameters. The flexibility in image processing approaches makes CAD development for DBT interesting and challenging. Our early experiences in the development of image segmentation and feature extraction techniques for mass detection and characterization in DBT will be discussed. The performances of the CAD systems using the 2D, 3D, and combined 2D and 3D approaches will be compared.
CT has been shown to be superior to chest x-rays in detection of small lung nodules and thus lung cancer at an early stage. Although the cost-effectiveness of lung cancer screening with CT is still being debated, many research groups are developing CAD methods for detection and characterization of lung nodules in chest CT scans. The specific prescreening, segmentation, and feature extraction techniques designed for our lung nodule detection and characterization systems will be discussed. The effects of CAD on radiologists’ accuracy in nodule detection and characterization in CT scans will be demonstrated by results of observer ROC studies. There are similarities in the approaches to developing CAD methods in 3D image volumes such as DBT and CT, these experiences will facilitate the development of CAD systems for other diseases in 3D modalities.
1. CAD FOR BREAST CANCER IN TOMOSYNTHESIS
In mammography, the sensitivity and specificity of lesion detection and characterization are reduced by the presence of overlapping dense fibroglandular breast tissue. This problem may be alleviated by the new approach of digital breast tomosynthesis (DBT) imaging. In DBT, a sequence of projection view (PV) mammograms is acquired as the x-ray source rotates over a limited angular range around the breast. The total dose of a DBT scan is kept at about the same as or only slightly higher than that of a regular mammogram. Tomographic slices of the breast volume can then be generated from the sequence of PV images by a reconstruction technique. The DBT slices provide quasi-3D structural information and thus reduce the camouflaging effects of dense tissues. DBT is one of the promising methods that may improve the accuracy of detection and characterization of breast lesions. Several manufacturers have been developing DBT systems and conducting clinical trials with prototype systems.
Computer-aided detection has been shown to improve breast cancer detection in screening mammography.[1-3] Computer-aided diagnosis has the potential to improve the differentiation of malignant and benign lesions, thus reducing benign biopsy. CAD will likely play a role in DBT as for conventional mammograms. Efforts are underway to develop CAD systems for DBT.[4-10] In our CAD Research Laboratory at the University of Michigan, we have been investigating the development of CAD methods for DBT and the dependence of CAD performance on the imaging and tomosynthesis parameters. A brief review of our experience will be presented in this paper.
1.1. Simultaneous Algebraic Reconstruction Technique (SART) for Breast Tomosynthesis
Our laboratory has investigated three representative methods for DBT reconstruction.[11] These methods include the backprojection (BP) method, the SART method, and the maximum likelihood method with the convex algorithm (ML-Convex)[12]. Our comparative study demonstrated that both SART and ML-Convex can achieve high-quality reconstruction and SART can provide comparable DBT image quality to that of the ML-Convex method but with fewer number of iterations.
The details of the SART that we implemented for DBT reconstruction can be found in the literature[11, 13]. Briefly, SART [14] is an iterative reconstruction technique proposed as a refinement of the original algebraic reconstruction technique [15-17]. The reconstruction process uses the detected x-ray intensity from the PVs to estimate the x-ray attenuation properties of each voxel in the breast. The iterative process starts with an initial distribution. The calculated forward projection using the current estimates of voxel values in the volume is compared to the actual detected data and the difference will be back-projected and added to the imaged volume. The updating is performed after all rays in one PV have been processed. One complete iteration is defined as the process that all PV images have been used once, and the number of updates in one complete iteration is thus equal to the number of PVs. The number of iterations required to attain good image quality will depend on many factors, especially the number of PVs in the scan. In practice, it is difficult to establish a criterion to terminate the iteration automatically for a given tomosynthesis case. The number of iterations and the relaxation parameter are often pre-determined experimentally for a given type of cases.
In our laboratory, we used DBT cases acquired with two different DBT systems for development of CAD detection and diagnosis methods. One data set was acquired with a GE first generation prototype DBT system (11 PVs, 50 degree arc) in the Breast Imaging Research Laboratory at the Massachusetts General Hospital (MGH) and the other with a GE second generation prototype system (21 PVs, 60 degree arc) at the University of Michigan (UM). An example of a DBT slice acquired with the DBT system at UM and reconstructed with the SART method at 1-mm slice interval is shown in Fig. 1 in comparison with a conventional mammogram of the same breast in the same view. It can be seen that the spiculated mass is much more conspicuous in the DBT slice without the overlapping tissue. We are conducting studies to develop CAD methods for DBT and to evaluate the dependence of the performance of CAD systems on various reconstruction parameters and image analysis methods. Although the results are still preliminary, the studies illustrate the many variables that will affect development of CAD systems for DBT.
Fig. 1.

An example of DBT of a breast with a spiculated mass. (a) the conventional mammogram. (b) a DBT slice reconstructed with the SART method at 1-mm slice interval. The slice intersected approximately the center of the mass. Without the overlapping tissue the mass is much more visible on the DBT slice than on the conventional mammogram.
1.2. CAD for Breast Tomosynthesis
CAD development for tomosynthesis imaging is more flexible than conventional projection imaging. Computerized lesion detection or characterization can be conducted in several ways: (1) performing image analysis in the individual 2D PV images and then combining the information from the PVs, [4] (2) combining the information in the PVs first by tomosynthesis reconstruction and then performing image analysis in the reconstructed slices or in the 3D volume,[5] and (3) taking both the 2D and 3D approaches in parallel and then combining the information from the two approaches. The block diagram in Fig. 2 illustrates the different approaches. Many different computer-vision techniques can be designed at each step in each approach. The best combination of techniques and parameters will depend on the approach taken. CAD in mammography has been found to be useful for both soft tissue masses and microcalcifications. To date, our laboratory has focused on mass detection and characterization. CAD for microcalcifications in DBT will be developed in future studies.
Fig. 2.
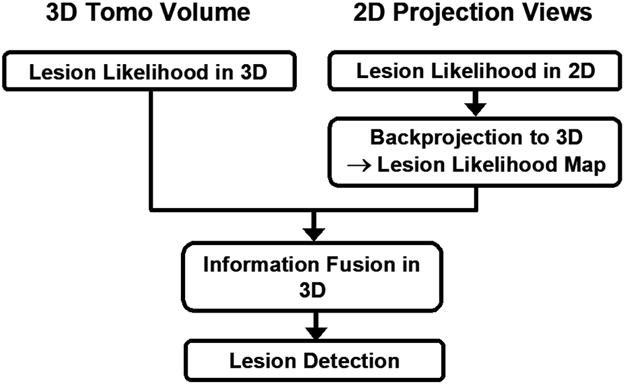
Three approaches to lesion detection: (1) detection in 3D tomosynthesized volume, (2) detection on 2D projection view images and merging the detection in the PV images in 3D, and (3) combined 3D and 2D mass likelihood information to estimate the likelihood of a detected object being a mass.[7]
1.3. Computerized Detection of Masses
Mass detection in DBT volume
The reconstructed 3D DBT slices are input to the system as a volume. Three-dimensional gradient field analysis is applied to the DBT volume to prescreen for mass candidates. Each candidate is then segmented by a 3D AC model to extract the volume of the object. Morphological features including size and shape descriptors are extracted from the segmented object. Gray level features that describe the contrast and the gray level histogram characteristics are extracted from the object and the background tissue surrounding the object. Texture features are first extracted from the individual slices. For a given slice, a rubber-band straightening transform (RBST) is applied to a band of pixels in the region surrounding the object boundary.[18] The RBST image is further enhanced by Sobel filtering. Runlength statistics (RLS) texture features are then extracted from the resulting gradient image. The corresponding texture features are averaged over all slices of the object. Selected morphological, gray level, and texture features for the object are used as input predictor variable in a linear discriminant analysis (LDA) to differentiate mass and non-mass structures. A 3D mass likelihood score is thus obtained for each object.
Mass detection in projection view images
For mass detection on the 2D PVs, our CAD system previously trained for detection of masses on single-projection digital mammograms is adapted to the individual PV images that are low-dose and noisy by retraining the false-positive (FP) classifier.[19] For each PV, the image is first processed with a 2D gradient field analysis. Mass candidates are identified as locations of strong gradient convergence. Each mass candidate is segmented by a 2D AC model. Two-dimensional morphological, gray level and texture features are then extracted from the segmented mass candidate. An LDA classifier using the 2D features as input predictor variables is used to classify mass and FPs. The 2D mass likelihood score is estimated for each object region from the output of the LDA classifier. The 2D mass likelihood scores from the corresponding objects detected on the individual PVs are then combined into a 3D mass likelihood score. To obtain the corresponding location of the detected objects in the 2D PVs, the object locations on the PVs are back-projected to the 3D breast volume using the imaging geometry of the DBT system in a process similar to a backprojection reconstruction algorithm.
Combined mass detection system
In the combined CAD system, the output scores from the two systems are merged to improve the estimate of the mass likelihood. The 3D spatial distribution of the mass likelihood scores from the 2D approach has been estimated by back-projection. The 3D mass likelihood score estimated for each mass candidate by the 3D CAD system can then be merged with that estimated from the backprojected 2D mass likelihood scores at the corresponding 3D location. The combined 3D mass likelihood score is used to differentiate masses and false positives (FPs).
Fig. 3 shows a comparison of the test free response receiver operating characteristics (FROC) curves generated by estimating the mass detection sensitivity as a function of FPs per case as the decision threshold for the 2D mass likelihood score, the 3D mass likelihood score, or the combined 2D and 3D score was varied. Because of the small sample size, leave-one-case-out method was used to train and test the algorithms.
Fig. 3.

FROC curves for mass detection in the reconstructed DBT volume (3D), in the 2D PV images (2D), and by combining the 2D and 3D mass likelihood information (Combined) for a data set of 100 DBT volumes containing 69 malignant and 31 benign masses. The data set was collected at MGH. [8]
Dependence of mass detection on reconstruction parameters
DBT image quality depends on the reconstruction methods and parameters. We have conducted a study to compare mass detection accuracy on images reconstructed using the ML-Convex method and the SART method at different number of iterations and relaxation parameter. Mass detection was performed in the reconstructed DBT volume. Fig. 4 shows the FROC curves obtained with the two different reconstruction methods. The results indicate that, with properly selected parameters, the mass detection accuracy in the reconstructed DBT volumes was comparable for the SART and ML-Convex methods.
Fig. 4.

FROC curves showing the dependence of mass detection performance on reconstruction methods and parameters using DBTs acquired at the MGH. (a) Maximum likelihood-Convex method with different number of iterations, (b) SART with different number of iterations and relaxation parameters, and (c) comparison of the highest curves in (a) and (b). A data set of 26 DBT volumes with 15 malignant and 11 benign masses collected at MGH was used.[6]
DBT image quality also depends on the number of PVs, the total angular range of the tomographic scan, and the distribution of the PVs within the scan range. Using the DBT scans collected with the GE system at UM that acquires a total of 21 PVs with a uniform 3° increment, we performed a study to compare the SART-reconstructed DBT image quality of six different distributions by subsampling 11 PVs from the 21 PVs.[20] The six distributions included both uniform and non-uniform angular increments of the PVs within the scan range. Our study indicated that, among the six distributions studied, the distribution with a uniform 6° increment provided the best trade-offs between the resolution and ghosting artifacts on the image plane and the depth direction for SART. This PV distribution was then chosen for a study of the effect of number of PVs for DBT reconstruction on mass detection accuracy. Two conditions were included in this preliminary study; one used the original 21 PVs in 3° increments, the other 11 PVs in 6° increments. The latter therefore used a subset of the PVs and about half the dose of the former. The appearances of the structures in the reconstructed slice using 11 PVs are similar to those using 21 PVs, except that the images of the former are somewhat noisier and contained some visible structured artifacts in the breast parenchyma. The leave-one-case-out test FROC curves for mass detection in the two sets of reconstructed DBT volumes are compared in Fig. 5. The detection accuracy was higher with the data set reconstructed with 21 PVs, probably due to improved resolution, reduced ghosting artifacts, and higher dose.
Fig. 5.

FROC curves for mass detection in the DBT volume reconstructed using 21 PVs and 11 PVs. A data set of 50 DBT volumes containing 14 malignant and 36 benign masses collected at UM was used. [21]
1.4. Computerized Classification of Masses
We have performed preliminary studies of mass classification using the DBT slices or the PV images as input. The image analysis process on an individual DBT slice or a PV image is similar although the specific parameters and features are trained differently. The mass is first segmented from its breast tissue background within a region of interest (ROI) containing the mass on an image.
The segmentation is performed by a 2D AC model initialized with adaptive k-means clustering followed by morphological filtering. For extraction of spiculation features, a spiculation likelihood map is generated by analyzing the gradient directions around the mass margin and spiculation measures are extracted from the map. For extraction of texture features in tissues around the mass, RBST is applied to a band of pixels around the segmented mass boundary such that the mass boundary was in the horizontal direction and the spiculations are approximately in the vertical direction. The gradient of the RBST image is enhanced by Sobel filtering in both the horizontal and vertical directions. The run-length statistics (RLS) texture features are then extracted from the gradient images. Morphological features including the mass size, the Fourier descriptor, and those from the normalized radial length (NRL) are extracted to describe the mass shape and size. To combine the information from multiple images, the corresponding features extracted from different images are averaged. An LDA classifier with stepwise feature selection is then designed for the differentiation of malignant and benign masses in the multi-dimensional feature space. The leave-one-case-out resampling method was used to train and test the LDA classifiers. The classification accuracy was evaluated in terms of the area under the ROC curve (Az).
For analysis using the DBT slices, we investigated the dependence of classification accuracy on the number of slices used. A feature space was obtained from features of the central slice alone or by averaging the corresponding features from 3 to 19 slices centered at the central slice. Fig. 6 shows that the test Az had a flat plateau from 5 to 9 slices and were slightly lower when too few or too many slices were used.
Fig. 6.

Dependence of the area under the ROC curves for classification of masses on the number of slices where the mass features were extracted and averaged. A data set of 30 malignant and 33 benign masses collected at the MGH was used in this study.[22]
For mass classification using the PVs, we evaluated a feature space obtained from the central PV alone and another by averaging the corresponding features from all 11 PVs. Fig. 7 shows a comparison of the ROC curves using the central DBT slice, average of 5 DBT slices, the central PV and the average of all 11 PVs. The average of 5 DBT slices provided the highest classification accuracy under the conditions studied. This may indicate that the DBT reconstruction technique combined the multiple-PV information more effectively than the simple averaging of the information from the multiple PVs for characterization of the lesion features.
Fig. 7.

ROC curves of the LDA classifiers in the four feature spaces: (1) features extracted from a single DBT slice intersecting approximately the center of the mass, (2) features extracted from 5 DBT slices centered at the central slice and averaged, (3) features extracted from a single PV image at the center of the tomosynthesis scan (0 degree projection angle), and (4) features extracted from all 11 PVs and averaged. A data set of 107 masses (56 malignant and 51 benign) collected at the MGH was used in this study.[23]
2. CAD FOR LUNG CANCER IN THORACIC CT
A number of research groups have been investigating CAD methods for lung nodule detection and characterization on CT scans. A review of the literature can be found elsewhere.[24] Since the cost-effectiveness of lung cancer screening by CT is still being investigated, few studies have been conducted to-date to evaluate the usefulness of CAD in clinical settings in the United States. Nevertheless, laboratory observer performance studies have demonstrated improvement in detection and characterization of lung nodules by radiologists using CAD.
2.1. Computerized Detection of Lung Nodules
For nodule detection, a common strategy used in many CAD systems is to first identify potential regions containing a suspicious object, and then to use an FP classifier to differentiate normal tissue and abnormal lesions. Lung nodules can be grouped into two major types by location, those internal in the lungs and those in the juxta-pleural (JP) region. The two types of nodules have different image characteristics. In our CAD system, a suspicious object is identified as JP or internal, and then different classifiers are applied to objects in these two regions.[25] The major steps of our CAD system for lung nodule detection are shown in the block diagram in Fig. 8.
Fig. 8.

Block diagram of our lung nodule detection system.
In the prescreening stage, nodule candidates are detected using adaptive 3D clustering. A 3D AC algorithm, initialized by k-means clustering within a 3D volume of interest (VOI) containing the object, is used for segmentation of the object.[26] An artificial neural network (ANN) that uses the eigenvalues of the Hessian matrix as input is trained to estimate the likelihood that a voxel belongs to a true nodule. A rule-based classification reduces the FPs based on the ANN output. Feature analysis is then applied to the remaining objects. Three groups of features, including the gradient field features,[27] Hessian features,[27, 28] and morphological features,[27] are extracted for each VOI. The extracted features are merged into a nodule likelihood score using LDA with stepwise feature selection. Two LDA classifiers and thresholds are separately trained for internal and juxta-pleural objects.
Effect of CAD on radiologists’ detection of lung nodules – observer performance study
A pilot observer performance study[29] was conducted with a data set containing 38 nodules in 28 CT examinations collected by the Lung Imaging Database Consortium and 35 nodules in 20 CT scans from the University of Michigan. These CT exams were independent of those used for training the CAD system. All CT scans were read by multiple expert thoracic radiologists to provide the reference standard for detection and only nodules with a diameter larger than 3 mm were included. Four other thoracic radiologists read the CT examinations first without, and then with CAD. Performance was evaluated using FROC methodology and the jackknife FROC analysis methods (JAFROC).[30]
In this data set, the computer system had a sensitivity of 79% (58/73) with an average of 4.9 marks per normal scan (88/18). The JAFROC figures-of-merit for the four radiologists in the no-CAD reading condition were 0.84, 0.75, 0.87, and 0.83, respectively. With CAD, the figures-of-merit improved to 0.88, 0.85, 0.91, and 0.87, respectively. JAFROC analysis indicated that the improvement with CAD was statistically significant (p=0.033).
2.2. Computerized Classification of Lung Nodules
For classification of a lung nodule as malignant or benign, the nodule is first automatically segmented from its surrounding structured background in a local VOI. Image segmentation is performed with a 3D AC model. The AC segmentation starts from an initial contour obtained from k-means clustering within the VOI and smoothed by morphological opening. Morphological, texture, and nodule surface features are extracted from the segmented nodule to characterize its size, shape, margin, surface smoothness, and shape irregularity. An LDA classifier is trained with stepwise feature selection in a leave-one-out resampling scheme to differentiate malignant and benign nodules. Using a data set of 256 nodules (124 malignant and 132 benign) from 152 patients, the test performance of the LDA classifier achieved an Az value of 0.857±0.023.[26, 31]
Effect of CAD on radiologists’ characterization of lung nodules – observer performance study
An observer ROC study was conducted[32] to evaluate the effect of CAD on radiologists’ characterization of lung nodules using the data set described above. Six fellowship-trained thoracic radiologists served as readers. The reading order of the individual nodules was randomized differently for each reader. The readers rated the likelihood of malignancy on a scale of 0–100% and recommended appropriate action first without CAD and then with CAD. The observer ratings were analyzed with the Dorfman-Berbaum-Metz multi-reader, multi-case method.[33] All 6 radiologists obtained improved performance with CAD, with three reaching statistical significance (p<0.05). The average Az of the radiologists improved significantly (p = 0.006) from 0.833 to 0.853. The ROC study thus indicated the potential that CAD can improve radiologists’ accuracy in assessing the likelihood of malignancy of lung nodules on CT.
3. SUMMARY
Development of CAD systems for DBT is at an early stage. Commercial DBT systems are not yet available and the optimal design of tomosynthesis imaging parameters under the constraints of dose and detector efficiency is still an area of active research. The number of DBT cases currently available is limited and the image acquisition parameters of prototype DBT systems vary. Our preliminary studies demonstrated that the performances of computerized lesion detection and characterization depend on the tomsynthesis reconstruction methods and parameters used, and whether image analysis is performed on the reconstructed DBT slices, DBT volume, or the PV images. The large number of variables that can affect image quality makes it a challenging area for CAD development. We can expect increased efforts for CAD research in this area when DBT systems become more commonly accessible and more DBT data available in the near future.
Development of CAD systems for lung nodules in CT scans has been an on-going effort. CT technology has been improving over the years and the improved image quality facilitates computerized nodule detection and characterization. Because the efficacy of CT screening for lung cancer detection is still under investigation, the resources and efforts devoted to CAD development are limited. Nevertheless, studies performed so far have demonstrated the potential of CAD to be a useful second reader in this area. Continued efforts to improve the CAD methods for detection and characterization of lung nodules in CT scans are warranted.
ACKNOWLEDGMENTS
This work results from the efforts of many current and former members of the Computer-Aided Diagnosis Research Laboratory at the University of Michigan and many of our radiologist colleagues who help collect the data and provide clinical insights. In particular, I would like to acknowledge the invaluable contribution from Berkman Sahiner, Ph.D., Jun Wei, Ph.D., Yiheng Zhang, Ph.D., Ted Way, Ph.D., Yi-Ta Wu, Ph.D., Lubomir Hadjiiski, Ph.D., and Chuan Zhou, Ph.D. I am also grateful to Daniel Kopans, M.D., and Richard Moore, Director, of the Breast Image Research Laboratory at the Massachusetts General Hospital for sharing their DBT data set. This work was supported by USPHS grants CA120234, CA93517, CA 91713, and CA95153. The digital tomosynthesis system at UM was developed by the GE Global Research Group through the Biomedical Research Partnership (USPHS grant CA91713, PI: Paul Carson, Ph.D.) collaboration. The content of this paper does not necessarily reflect the position of the funding agencies and no official endorsement of any equipment and product of any companies mentioned should be inferred.
REFERENCES
- 1.Chan H-P, Doi K, Vyborny CJ, Schmidt RA, Metz CE, Lam KL, Ogura T, Wu Y and MacMahon H, “Improvement in radiologists’ detection of clustered microcalcifications on mammograms. The potential of computer-aided diagnosis,” Investigative Radiology 25, 1102–1110 (1990). [DOI] [PubMed] [Google Scholar]
- 2.Freer TW and Ulissey MJ, “Screening mammography with computer-aided detection: Prospective study of 12,860 patients in a community breast center,” Radiology 220, 781–786 (2001). [DOI] [PubMed] [Google Scholar]
- 3.Helvie MA, Hadjiiski LM, Makariou E, Chan H-P, Petrick N, Sahiner B, Lo SCB, Freedman M, Adler D, Bailey J, Blane C, Hoff D, Hunt K, Joynt L, Klein K, Paramagul C, Patterson S and Roubidoux MA, “Sensitivity of noncommercial computer-aided detection system for mammographic breast cancer detection - A pilot clinical trial,” Radiology 231, 208–214 (2004). [DOI] [PMC free article] [PubMed] [Google Scholar]
- 4.Chan H-P, Wei J, Sahiner B, Rafferty EA, Wu T, Ge J, Roubidoux MA, Moore RH, Kopans DB, Hadjiiski LM and Helvie MA, “Computer-aided detection on digital breast tomosynthesis (DBT) mammograms - Comparison of two approaches,” RSNA Program Book 2004, 447 (2004). [Google Scholar]
- 5.Chan H-P, Wei J, Sahiner B, Rafferty EA, Wu T, Roubidoux MA, Moore RH, Kopans DB, Hadjiiski LM and Helvie MA, “Computer-aided detection system for breast masses on digital tomosynthesis mammograms - Preliminary experience,” Radiology 237, 1075–1080 (2005). [DOI] [PMC free article] [PubMed] [Google Scholar]
- 6.Chan H-P, Wei J, Wu T, Sahiner B, Rafferty EA, Hadjiiski LM, Helvie MA, Roubidoux MA, Moore RH and Kopans DB, “Computer-aided detection on digital breast tomosynthesis (DBT) mammograms: Dependence on image quality of reconstruction,” RSNA Program Book 2005, 269 (2005). [Google Scholar]
- 7.Chan H-P, Wei J, Zhang Y, Helvie MA, Moore RH, Kopans D, Roubidoux MA, Sahiner B and Hadjiiski LM, “Digital breast tomosynthesis (DBT) mammography: Computer-aided mass detection by fusion of tomosynthesis and 3D mass likelihood information,” RSNA Program Book 2006, 230 (2006). [Google Scholar]
- 8.Chan H-P, Wei J, Zhang YH, Helvie MA, Moore RH, Sahiner B, Hadjiiski L and Kopans DB, “Computer-aided detection of masses in digital tomosynthesis mammography: Comparison of three approaches,” Medical Physics 35, 4087–4095 (2008). [DOI] [PMC free article] [PubMed] [Google Scholar]
- 9.Reiser I, Nishikawa RM, Giger ML, Wu T, Rafferty E, Moore RH and Kopans DB, “Computerized detection of mass lesions in digital breast tomosynthesis images using two- and three dimensional radial gradient index segmentation,” Technology in Cancer Research and Treatment 3, 437–441 (2004). [DOI] [PubMed] [Google Scholar]
- 10.Reiser I, Nishikawa RM, Giger ML, Wu T, Rafferty EA, Moore RH and Kopans DB, “Computerized mass detection for digital breast tomosynthesis directly from the projection images,” Medical Physics 33, 482–491 (2006). [DOI] [PubMed] [Google Scholar]
- 11.Zhang Y, Chan H-P, Sahiner B, Wei J, Goodsitt MM, Hadjiiski LM, Ge J and Zhou C, “A comparative study of limited-angle cone-beam reconstruction methods for breast tomosynthesis,” Medical Physics 33, 3781–3795 (2006). [DOI] [PMC free article] [PubMed] [Google Scholar]
- 12.Wu T, Moore RH, Rafferty EA and Kopans DB, “A comparison of reconstruction algorithms for breast tomosynthesis,” Medical Physics 31, 2636–2647 (2004). [DOI] [PubMed] [Google Scholar]
- 13.Zhang Y, Chan H-P, Sahiner B, Wu Y-T, Zhou C, Ge J, Wei J and Hadjiiski LM, “Application of boundary detection information in breast tomosynthesis reconstruction,” Medical Physics 34, 3603–3613 (2007). [DOI] [PMC free article] [PubMed] [Google Scholar]
- 14.Andersen AH, “Algebraic reconstruction in CT from limited views,” IEEE Trans Med Imag 8, 50–55 (1989). [DOI] [PubMed] [Google Scholar]
- 15.Gordon R, Bender R and Herman GT, “Algebraic reconstruction techniques (ART) for three dimensional electron microscopy and X-ray photography,” J Theor Biol 29, 471–481 (1970). [DOI] [PubMed] [Google Scholar]
- 16.Herman GT, Image Reconstruction from Projections: The Fundamentals of Computerized Tomography, (Academic Press, New York, 1980). [Google Scholar]
- 17.Kak A and Slaney M, Principle of Computerized Tomographic Imaging, (IEEE Press, New York, 1988). [Google Scholar]
- 18.Sahiner B, Chan H-P, Petrick N, Helvie MA and Goodsitt MM, “Computerized characterization of masses on mammograms: The rubber band straightening transform and texture analysis,” Medical Physics 25, 516–526 (1998). [DOI] [PubMed] [Google Scholar]
- 19.Wei J, Sahiner B, Hadjiiski LM, Chan H-P, Petrick N, Helvie MA, Roubidoux MA, Ge J and Zhou C, “Computer aided detection of breast masses on full field digital mammograms,” Medical Physics 32, 2827–2838 (2005). [DOI] [PMC free article] [PubMed] [Google Scholar]
- 20.Zhang Y, Chan H-P, Goodsitt MM, Schmitz A, Eberhard J and Claus B, “Investigation of different PV distributions in digital tomosynthesis mammography (DTM),” 9th International Workshop on Digital Mammography, Tucson, Arizona, July 20–23, 2008, Proceedings of IWDM-2008, (submitted). [Google Scholar]
- 21.Chan H-P, Wei J, Zhang YH, Sahiner B, Hadjiiski L and Helvie MA, “Detection of masses in digital breast tomosynthesis mammography: Effects of the number of projection views and dose,” 9th International Workshop on Digital Mammography, Tucson, AZ, July 20-23, 279–285. [Google Scholar]
- 22.Chan H-P, Wu YT, Sahiner B, Zhang Y, Moore RH, Kopans DB, Helvie MA, Hadjiiski LM and Way T, “Analysis of mass characteristics on digital breast tomosynthesis (DBT) mammograms: Application to computer-aided diagnosis,” RSNA Program Book 2007, 315 (2007). [Google Scholar]
- 23.Chan H-P, Wu YT, Sahiner B, Zhang YH, Wei J, Moore RH, Kopans DB, Helvie MA, Hadjiiski L and Way T, “Digital tomosynthesis mammography: comparison of mass classification using 3D slices and 2D projection views,” Proc SPIE 6915, 6915061–6915066 (2008). [Google Scholar]
- 24.Chan H-P, Hadjiiski LM, Zhou C and Sahiner B, “Computer-Aided Diagnosis of Lung Cancer and Pulmonary Embolism in Computed Tomography—A Review,” Academic Radiology 15, 535–555 (2008). [DOI] [PMC free article] [PubMed] [Google Scholar]
- 25.Sahiner B, Hadjiiski LM, Chan H-P, Zhou C and Wei J, “Computerized lung nodule detection on screening CT scans: performance on juxta-pleural and internal nodules,” Proc SPIE 6144, 5S1–5S6 (2006). [Google Scholar]
- 26.Way TW, Hadjiiski LM, Sahiner B, Chan H-P, Cascade PN, Kazerooni EA, Bogot N and Zhou C, “Computer-aided diagnosis of pulmonary nodules on CT scans: segmentation and classification using 3D active contours,” Medical Physics 33, 2323–2337 (2006). [DOI] [PMC free article] [PubMed] [Google Scholar]
- 27.Ge Z, Sahiner B, Chan H-P, Hadjiiski LM, Cascade PN, Bogot N, Kazerooni EA, Wei J and Zhou C, “Computer aided detection of lung nodules: false positive reduction using a 3D gradient field method and 3D ellipsoid fitting,” Medical Physics 32, 2443–2454 (2005). [DOI] [PMC free article] [PubMed] [Google Scholar]
- 28.Sahiner B, Chan H-P, Hadjjiski LM, Cascade PN, Bogot NR, Kazerooni EA and Zhou C, “Computerized lung nodule detection on screening CT scans: Performance improvement using hessian features and an artificial neural network classifier,” RSNA, Chicago, [Google Scholar]
- 29.Sahiner B, Hadjiiski LM, Chan H-P, Shi J, Cascade PN, Kazerooni EA, Zhou C, Wei J, Chughtai AR, Poopat C, Song T, Stojanovska J, Frank L and Attili A, “Effect of CAD on radiologists’ detection of lung nodules on thoracic CT scans: Observer performance study,” Proc SPIE 6515, 65151D–65151,65157 (2007). [DOI] [PMC free article] [PubMed] [Google Scholar]
- 30.Chakraborty DP and Berbaum KS, “Observer studies involving detection and localization: modeling, analysis, and validation,” Medical Physics 31, 2313–2330 (2004). [DOI] [PubMed] [Google Scholar]
- 31.Way TW, Sahiner B, Chan H-P, Hadjiiski L, Cascade PN, Chughtai A, Bogot N and Kazerooni E, “Computer aided diagnosis of pulmonary nodules on CT scans: improvement of classification performance with nodule surface features,” Submitted to: Medical Physics (2008). [DOI] [PMC free article] [PubMed] [Google Scholar]
- 32.Way TW, Chan H-P, Stojanovska-Nojkova J, Frank L, Song TK, Kazerooni EA, Cascade PN, Chughtai A, Attili A, Sahiner B and Hadjiiski L, “Effect of computer-aided diagnosis (CAD) on radiologists’ characterization of lung nodules on CT: An ROC study,” RSNA Program Book 2007, 267 (2007). [Google Scholar]
- 33.Dorfman DD, Berbaum KS and Metz CE, “ROC rating analysis: Generalization to the population of readers and cases with the jackknife method,” Investigative Radiology 27, 723–731 (1992). [PubMed] [Google Scholar]