Abstract
Through integration of a MOSFET-based microfluidic Coulter counter with a dc-dielectrophoretic cell sorter, we demonstrate simultaneous on-chip cell separation and sizing with three different samples including 1) binary mixtures of polystyrene beads, 2) yeast cells of continuous size distribution, and 3) mixtures of 4T1 tumor cells and murine bone marrow cells. For cells with continuous size distribution, it is found that the receiver operator characteristic analysis is an ideal method to characterize the separation performance. The characterization results indicate that dc-DEP separation performance degrades as the sorting throughput (cell sorting rate) increases, which provides insights into the design and operation of size-based microfluidic cell separation.
Graphical Abstract
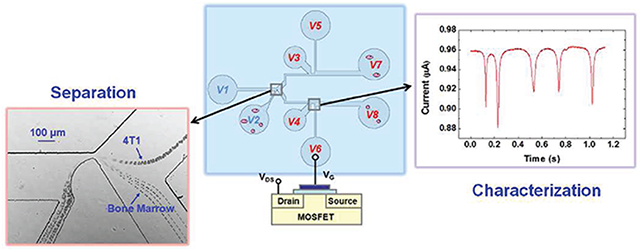
Microfluidic cell separation has attracted significant attention because of its important applications in different microfluidic based assays. Different schemes have been developed to separate cells according to their size, density, and/or dielectric property.1,2 Size-based microfluidic cell separation techniques, in particular, have attracted a lot of interest because the most commonly used conventional cell separation techniques, centrifugation and microfiltration, separate cells by size.
In the past decade, various size-based microfluidic cell separation schemes have been developed,3–18 which, in general, can be classified into two categories: passive separation and active separation.3,4 Passive separation usually involves manipulation of cells in a laminar flow field or filtration with arrays of different size microsieves.5–8 For example, using the deterministic lateral displacement of cells in a laminar flow field composed of periodic flow pattern generated with staggered micropost arrays, Davis et al. demonstrated separation of white blood cells from red blood cells and plasma.5 With massively parallel microsieves, Mohamed et al. showed that cultured neuroblastoma cells could be filtered out from other smaller whole blood cells.6 Active cell separation techniques involve external force fields acting on cells. For example, several reports have been published to show that both alternating current (ac) and direct current (dc) dielectrophoretic (DEP) forces could be used to sort particles and cells by size.9–14 In addition, optical, acoustic, and magnetic forces have all been integrated with microfluidic circuits to realize size-based cell-separation.15–18
As pointed out in two recent reviews,1,2 most microfluidic separation research published so far has been concerned with proof-of-concept demonstration, often with user-defined binary mixtures or preconditioned biological samples. For size-based separation, the binary mixture of particles is often composed of particles or cells of significant size difference.19,20 The separation performance of the binary mixture of different size cells or particles has often been verified qualitatively by visual observation.21 More quantitative characterization has been done with Coulter counters post separation, which requires sample transfer from the microfluidic chip to the Coulter counter, involving additional complication during the transfer process.8,17 A real-time postseparation analyzing system can provide quantitative analyses of how well the separation performance is and how the separation performance varies as a function of sorting throughput, which can provide insights into the device design and the best operation protocol. More importantly, real biological samples often contain cells of continuous size distribution, and, therefore, the parameters used for simple binary mixtures may not be adequate to characterize the separation performance for complex biological samples.
Here we present a microfluidic chip with integrated dc-DEP size-based cell separation and sizing functions to perform simultaneous cell separation and performance characterization. Experiments have been performed with three different samples, binary mixtures of 1.97 and 4.84 μm-diameter polystyrene beads, yeast cells with continuous size distribution, and mixtures of 4T1 tumor and bone marrow cells. For samples with continuous cell size distribution, we adopted the receiver operator characteristic (ROC) analysis22 to quantitatively characterize the separation performance. ROC analysis is the natural choice to quantify the separation of two population distributions, which can help to assess the size-based separation performance as a function of operational parameters such as the sorting throughput in terms of cell sorting rate. The analysis result provides insights for design and operation optimization of size-based cell sorting schemes.
EXPERIMENTAL METHODS
Design of the dc-DEP Cell Sorters.
DEP force is proportional to the gradient of the square of the magnitude of the electric field intensity.23–26 To create an electric field intensity gradient, oil droplets and square hurdles have been used to induce a nonuniform electric field in microfluidic channels.19–21 In the current design, we choose to use a 60 degree triangle hurdle as shown in Figure 1 based on the following two considerations: (1) with a sharper triangle hurdle, the induced electric field intensity gradient is stronger, which will lead to larger difference of the DEP force on different size particles; (2) the design, with a shorter narrow region than those with an oil droplet or a square hurdle, significantly reduces the duration that cells/particles experience strong electric fields. This is important for separation of fragile cells that cannot survive high electric field intensity for an extended period.
Figure 1.
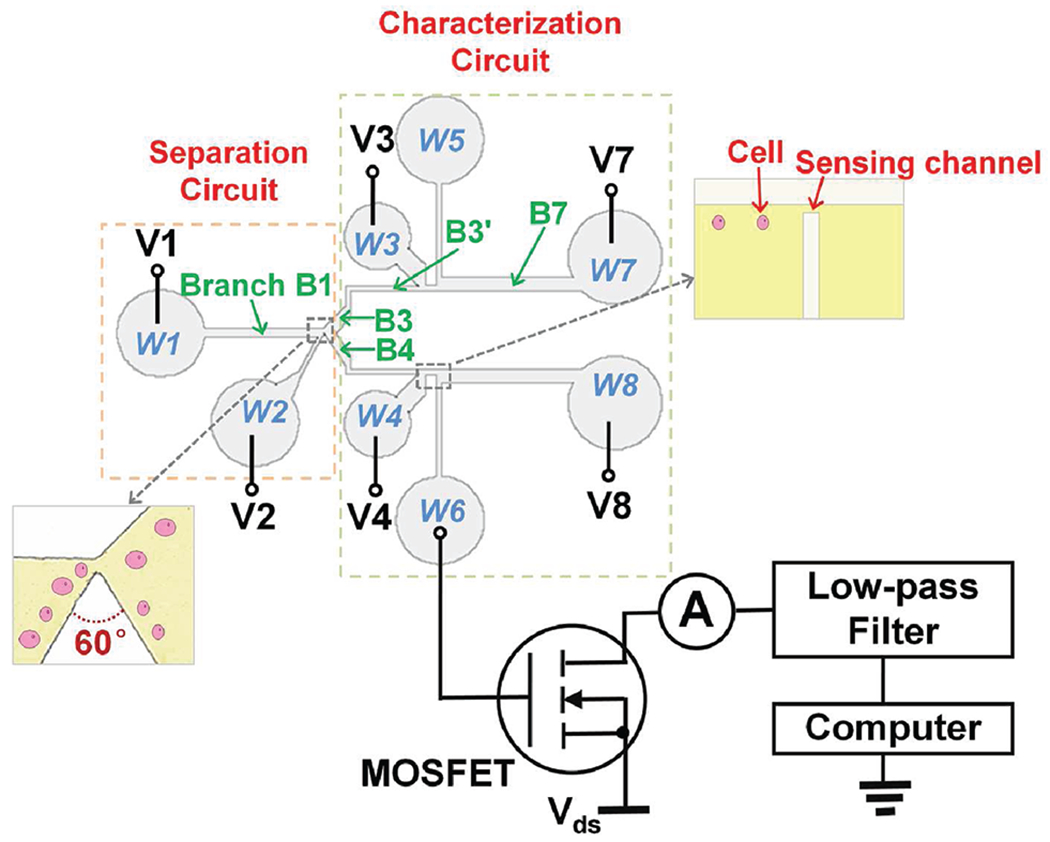
Schematic of the microfluidic channel layout with the separation and the characterization section.
In the operation, cells/particles are fed into the microfluidic sorter through branch B2, in which they are squeezed to flow along the left wall of the triangle hurdle by the buffer flowing in branch B1. The electroosmostic flow in the channels is driven by electric potentials applied to the boundary of each branch. The electric field intensity gradient in branch B1 and B2 is very small so the DEP effect is negligible before the cell/particle translocates the triangle hurdle, where the cell/particle experiences a strong DEP force generated by the highly nonuniform electric field in the transverse direction. The interaction of particles/cells with the nonuniform electric field would induce a negative DEP force, and this induced negative DEP force would point away from the triangle surface and push the particle/cell away from the triangle hurdle. Different size cells/particles experience different DEP forces, with larger DEP forces on larger cells/particles, which push them further away from the triangle hurdle than smaller ones. As a result, different size cells/particles will be deflected to different branches (B3 and B4) after they traverse the tip of the triangle hurdle.
For separation of binary mixtures of polystyrene beads or yeast cells of continuous size distribution, the dimensions of the horizontal driving channel (branch B1) and the tilted input channel (branch B2) are 5.5 mm long and 300 μm wide and 3.5 mm long and 60 μm wide, respectively. The 60 degree triangle hurdle forms a narrow gap of 20 μm wide with the top wall, which is connected to branch B3 (1.5 mm long and 450 μm wide) and B4 (1.5 mm long and 300 μm wide). Both branch B3 and B4 are connected to the sizing section through two L-shape channels (branch B3′ and B4′) of 100 μm wide. All channels are 15 μm in height.
To separate the mixture of 4T1 tumor cells and murine bone marrow cells over a broad range of sizes, we enlarge the separation regime and branch B2, through which the cells are fed into the microfluidic devices. Now the narrowest gap between the triangle hurdle and the top channel wall is 30 μm × 50 μm for length and depth and branch B2 has a dimension of 80 μm × 50 μm for width and depth. Moreover, to investigate the cell entrance effect on separation performance, we also introduce an arc-shaped left wall right before the separation hurdle, in comparison with the straight wall of the triangle hurdle. All channels are 50 μm in height.
Integration of the Cell Sorter and the MOSFET-Based Coulter Counter.
To realize simultaneous on-chip cell separation and sizing, the above-described cell separation circuit is integrated with MOSFET-based microfluidic Coulter counters27–29 as depicted in Figure 1. The sizing section consists of a pair of mirror-symmetric microfluidic circuits, each of which is a MOSFET-based microfluidic Coulter counter with two large microchannels sandwiching a small sensing channel. The sensing channels are 50 μm long, 15 μm wide for polystyrene particles and yeast sizing, and 50 μm long, 30 μm wide for mammalian cell sizing. The MOSFET-based Coulter counter amplifies the percentage modulation of the resistance pulse from the translocation of cells/particles through the small sensing channel, which can be used to measure the size of the cells/particles.27–29 In the MOSFET-based Coulter counter, the electrical potential downstream of the sensing channel is connected to the gate of a MOSFET through a vertical microchannel (4 mm long and 110 μm wide) connected to well W5 and W6, respectively. Well W3 is 1.5 mm above the horizontal channel (branch B3′) to provide an additional port to set the electrical potential in the fluidic circuit. The tilted connection branch between well W3 and the horizontal channel is 2 mm long and 800 μm wide. The horizontal branch B7 is 6 mm long and 500 μm wide. The mirror-symmetric MOSFET-based Coulter counter at the bottom has the same dimensions. All channels are 15 μm in height for polystyrene particles and yeast separation and sizing and 50 μm in height for mammalian cell separation and sizing.
Experimental Procedure.
The microfluidic devices are fabricated using standard soft-lithography techniques and assembled by bonding the PDMS layer to a glass substrate post oxygen plasma treatment.30 In the experiment with polystyrene beads and yeast cells, a buffer solution (composed of 10 mM sodium chloride and 10 mM phosphate, pH 7.2) was loaded into the eight wells of the microfluidic device. Platinum electrodes were submerged into each well to connect the fluidic circuits to the external electronic circuit. Binary mixtures of polystyrene beads (1.97 and 4.84 μm in diameter) or yeast colony were then loaded into well W2. Two DC power supplies (Keithley 6487, Keithley Instruments Inc.) were used to provide 120 and 110 V to well W1 and W2, respectively, to introduce electroosmotic flow. Two relatively low voltages were applied to well W3 (10 V) and W4 (20 V) by another two power supplies (Agilent E-3612A, Agilent Technologies). An additional power supply (Agilent E-3617A, Agilent Technologies) was used to supply a constant source-drain bias (0.15 V) to induce the MOSFET drain current. A negative voltage ranging from −8 V to −18 V was applied to well W7 or W8 to ensure that the MOSFET (2N7000 N-channel FET, Fairchild Semiconductor) worked in the subthreshold regime. The MOSFET drain current was measured by a current preamplifier (Keithley 428, Keithley Instruments Inc.), which was conditioned by a low-pass filter (SR 560, Stanford Research Systems) with a cutoff frequency of 100 Hz and a 50/60 Hz noise eliminator (Hum bug noise eliminator, Quest Scientific Instruments Inc.) before it was fed into the digital data acquisition system. The ground terminals of the power supplies, the current preamplifier, low-pass filter, and the digital data acquisition system were all connected to the same ground line. In this manner, the fluidic and electric circuits were commonly grounded. In some experiments, the particle motion was monitored using an inverted optical microscope (Nikon Eclipse TE-2000U, Nikon Corp.) and recorded by a CCD camera (Nikon digital sight DS-U1, Nikon Corp.). The frame rate was set to be 9.8 frames per second.
Similarly, in the experiment with mammalian cells, DMEM medium, a commonly used medium for culturing mammalian cells, was first filled into the microfluidic device, followed by loading 4T1 tumor and bone marrow cell mixtures into well W2. The separation of 4T1 tumor and bone marrow cells was performed with the applied voltages of 150 V to well W1, 100 V to well W2, 15.1 V to well W3, 34.7 V to well W4, −12.51 V to well W7, and −66.2 V to well W8.
RESULTS AND DISCUSSION
Separation of Binary Polystyrene Beads.
Since quite a few microfluidic separation schemes are demonstrated with binary mixtures, we first applied the device to sort a binary mixture of polystyrene beads (1.97 and 4.84 μm in diameter) and quantitatively characterize the separation performance. The separation was conducted at two different throughputs with bead sorting rates of 0.485 beads/s and 0.778 beads/s, respectively, by altering the bead concentration (6.5 × 10⁶ beads/mL and 1 × 10⁷ beads/mL) in the binary bead mixture. The trajectories of the moving beads at different bead sorting rates were obtained by superimposing multiple consecutive image frames within 1 min using Adobe Photoshop CS3 (Adobe Systems) (Figure 2a,b). The figures show that after the mixture of 1.97 and 4.84 μm diameter polystyrene beads flow through the narrow gap between the triangle hurdle and the channel wall, the single stream of beads mixture splits into multiple streams and are collected into two branches (B3 and B4). Most 4.84 μm polystyrene beads flow into branch B3, while most 1.97 μm polystyrene beads flow into branch B4.
Figure 2.
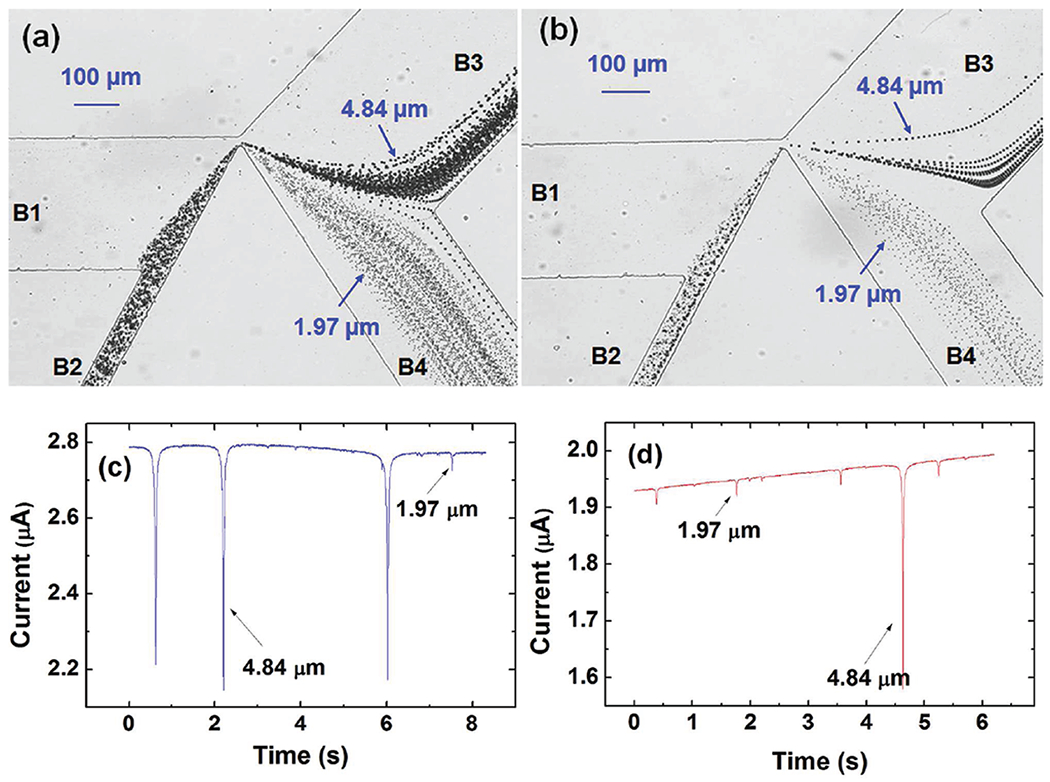
(a) The binary mixture (1.97 and 4.84 μm in diameter polystyrene beads) separation images from superimposing 1 min consecutive images of the moving beads at a high bead sorting rate −0.778 beads/s. (b) The separation images at a lower bead sorting rate −0.485 beads/s under the same experimental conditions. (c) The MOSFET drain current of the upper sensing channel containing mostly 4.84 μm polystyrene beads (with one 1.97 μm bead). (d) The MOSFET drain current of the lower sensing channel containing mostly 1.97 μm polystyrene beads (with one 4.84 μm bead).
Even though Figure 2a,b qualitatively shows that our design of the dc-DEP scheme can separate the beads effectively, it is difficult to determine quantitatively how well the separation is. The integrated MOSFET-based microfluidic Coulter counters, however, can provide quantitative data of the separation performance. Our previous studies27–29 show that the MOSFET-based microfluidic Coulter counter can detect bead or cell volume with a high sensitivity, and the MOSFET-drain current modulation is directly proportional to the volume ratio of the bead/cell to the sensing channel. Figure 2c,d shows snapshots ofthe measured MOSFET drain current ofthe upper (Figure 2c) and lower sensing channels (Figure 2d) as a function of time. Figure 2c indicates that while most beads flow into the upper branch B3 are 4.84 μm-diameter beads, there are a small number of 1.97 μm-diameter beads also entering the branch. A similar observation is true for beads entering the lower branch B4, which indicates that the separation is not 100%. By counting the number of 1.97 and 4.84 μm beads that translocate through each sensing channel over an extended time period, the separation efficiency or purity of the separated beads can be obtained. The characterization results are shown in Table 1, which indicate that as the bead sorting rate decreases from 0.778 to 0.485 beads/s, the purity of the beads in the upper and lower branch increases from 89.16% to 97.35% and from 97.82% to 99.03%, respectively (see the Supporting Information for a confidence analysis). The characterization results show that the separation performance degrades as the bead sorting rate increases. One possible explanation for this finding is that for a higher bead sorting rate, multiple beads can translocate the triangle hurdle at the same time, resulting in undesirable bead deflection and degraded separation performance, which we speculate might come from bead–bead or bead-DEP field interactions.10 It is reasonable to imagine that when two beads are close to each other and translocate the DEP field at the same time, the bead might affect the DEP field and there could be sensible bead–bead interactions, as discussed in the literature.14 These interactions might have a negative effect on the separation result.
Table 1.
Separation Efficiency of the Microfluidic Sorter Determined by the Integrated MOSFET-Based Microfluidic Coulter Counter
| high sorting rate (0.778 beads/s) |
low sorting rate (0.485 beads/s) |
|||
|---|---|---|---|---|
| upper | lower | upper | lower | |
| time (s) | 1500 | 570 | 2550 | 810 |
| # of 4.84 μm beads | 288 | 7 | 257 | 3 |
| # of 1.97 μm beads | 35 | 314 | 7 | 306 |
| purity (%) | 89.16 | 97.82 | 97.35 | 99.03 |
Separation and Characterization of Yeast Cells.
For binary mixtures of beads and cells, it is straightforward to use the percentage of one type of beads/cells in a population as the parameter to characterize the separation performance. However, for real biological samples, the cells are often of continuous size distribution, and, therefore, it is necessary to construct new parameters to characterize the separation performance. To address this issue, we applied the device to separate yeast cells (S. cerevisiae strain CEN.PK 113-7D) of a continuous size distribution under five different sorting rates (0.37 cells/s, 0.9 cells/s, 1.79 cells/s, 2.3 cells/s, and 3.4 cells/s) by adjusting the cell concentration in the buffer (2 × 10⁶ cells/mL, 5 × 10⁶ cells/mL, 1 × 10⁷ cells/mL, 1.5 × 10⁷ cells/mL, and 2 × 10⁷ cells/mL). The volume of each separated yeast cell was simultaneously acquired by the MOSFET-based microfluidic Coulter counters with a lower detection limit of 0.675 μm3. It is worth noting that the signal of Coulter counters is not sensitive to cell shape changes but mainly decided by the volume of each cell. In fact, it has been pointed out31 that compared to a sphere of the same volume, an ellipsoid of revolution with an axial ratio of 4 to 1 would give rise to a pulse difference of merely 3%.
We chose to work on yeast cells also because of the important applications of size-based cell separation in yeast based biological assays and engineering. Currently, because of the inherent asymmetry in yeast growth and division, a synchronous cell population (e.g., prepared with a baby machine) decays rapidly and loses cell cycle synchrony after 3 cell cycles. It has been shown theoretically that size-based filtration could maintain population synchrony for over 30 cycles ofmitotic divisions as opposed to the current best of 3,32 which is certain to impact studies of cell cycle and cell cycle dependent gene regulation as well as industrial applications in which product recovery from micro-organisms is cell cycle dependent.33
In the experiment, the trajectories of yeast cells separated at different sorting rates were obtained by superimposing consecutive images, as shown in Figure 3 (a–c). At a low sorting rate (0.37 cells/s), we observed that larger cells tended to be deflected into the upper branch while smaller ones tended to enter the lower branch. As the cell sorting rate increased, we noticed that the separation performance degraded, as indicated by more smaller cells entering the upper branch and more larger cells entering the lower branch. The quantitative characterization of each cell volume in each branch is performed with the downstream MOSFET-based Coulter counter. To obtain more accurate volume data, a calibration run with more than two hundred 4.84 μm diameter polystyrene beads was done to obtain a reference MOSFET drain current modulation.29 This is acceptable because the MOSFET-drain current modulation is directly proportional to the volume ofthe cells, as discussed in our previous publications about MOSFET-based microfluidic Coulter counters.27–29 Histograms of separated cell volume distributions in the upper and the lower branches for different cell sorting rates are drawn in Figure 3 (d–f) with the statistical analysis results shown in Table 2. The number ofcells in the histogram plots refers to the total number of cells in both the upper and lower branches. Figure 3 (d–f) and Table 2 clearly indicate that the sorting performance degrades as the cell sorting rate increases.
Figure 3.
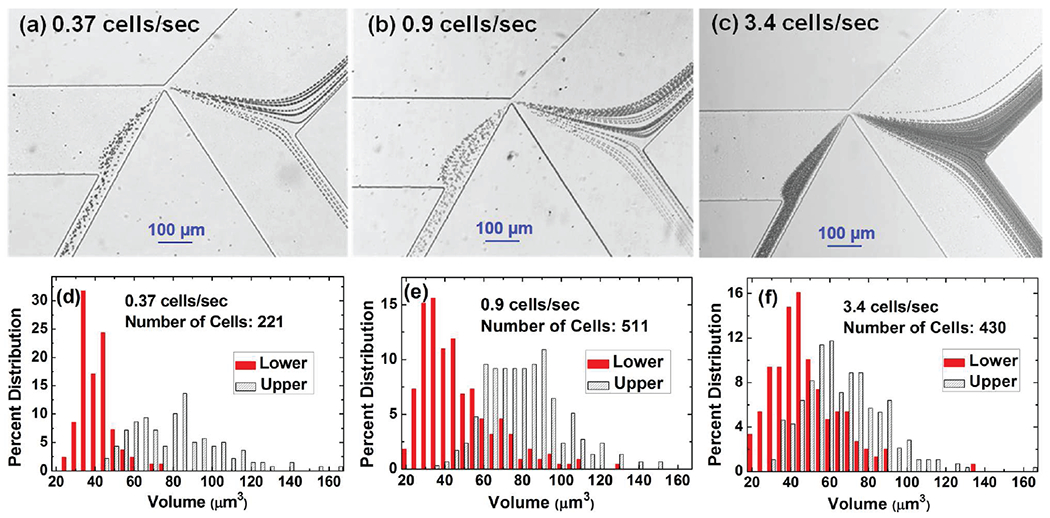
(a-c) The traces of yeast cells by superimposing 30 s consecutive images of the moving yeast at three different cell sorting rates. (d-f) The corresponding histograms of percentage size distributions of yeast cells for the upper branch and the lower branch.
Table 2.
Volumes of the Separated Yeast Cells in the Upper and the Lower Wells Determined by the MOSFET-Based Microfluidic Coulter Counter
| average volume (μm3) |
||||
|---|---|---|---|---|
| concentration (cells/mL) | sorting rate (cells/s) | upper | lower | fractional separation |
| 2 × 10⁶ | 0.37 | 80.04 | 38.32 | 95% |
| 5 × 10⁶ | 0.9 | 77.99 | 44.42 | 78% |
| 1 × 10⁷ | 1.79 | 70.27 | 44.77 | 63% |
| 1.5 × 10⁷ | 2.3 | 65.19 | 45.52 | 56% |
| 2 × 10⁷ | 3.4 | 65.04 | 45.6 | 55% |
Even though the detailed size distribution and the average volume of the separated cells present a good picture of how well the separation performance is, it is desirable to have a single quantitative parameter to characterize the cell separation performance. We find that the receiver operator characteristic (ROC) method, a powerful approach in statistical analysis, provides an ideal parameter to quantitatively characterize the separation performance.22 To assess the separation performance, it is necessary to determine to what extent the two size distributions overlap with each other, which can be described elegantly with a parameter, fractional separation, from an ROC analysis (for details see the Supporting Information).
The ROC analysis and resulted fractional separation for different cell sorting rates have been calculated and shown in Figure 4 and also listed in Table 2. For the ROC analysis, specificity and sensitivity are defined by a threshold position in the two size distributions being analyzed. The curve in Figure 4a is generated by calculating the sensitivity and specificity as the threshold swept through the two size distributions, with the dotted line representing the values if the two distributions completely overlapped. The fractional separation of two distributions is defined as two times the area under the ROC curve minus one. Figure 4a shows the ROC curves and the calculated fractional separation for each cell sorting rate, and Figure 4b plots the fractional separation versus the sorting rate. Along each point of the empiric ROC curve calculated from the yeast separation data (Table 2), a 95% confidence interval for the sensitivity can be calculated using the Wilson Score method with continuity correction.34 This procedure results in the generation of error bars in Figure 4b, in which the fractional separation for different cell sorting rates is bounded by the lower and the upper confidence limit. Figure 4 indicates that the fractional separation is 95% at a cell sorting rate of 0.37 cells/s, which drops to 55% as the cell sorting rate increases to 3.4 cells/s. It is worth noting that the fractional separation drops rapidly as the cell sorting rate increases from 0.37 to 1.79 cells/s, after which the fractional separation only reduces marginally. Similar to the polystyrene bead case, we speculate that enhanced cell–cell interaction and cell-electrical field interaction might be responsible for the degraded performance at higher cell sorting rate. It is difficult to further reduce the cell sorting rate in the experiment because less and less cells can be tested in a reasonable time frame to achieve a statistically meaningful analysis. However, we expect that the fractional separation will approach unity in an asymptotic manner as the cell sorting rate reduces.
Figure 4.
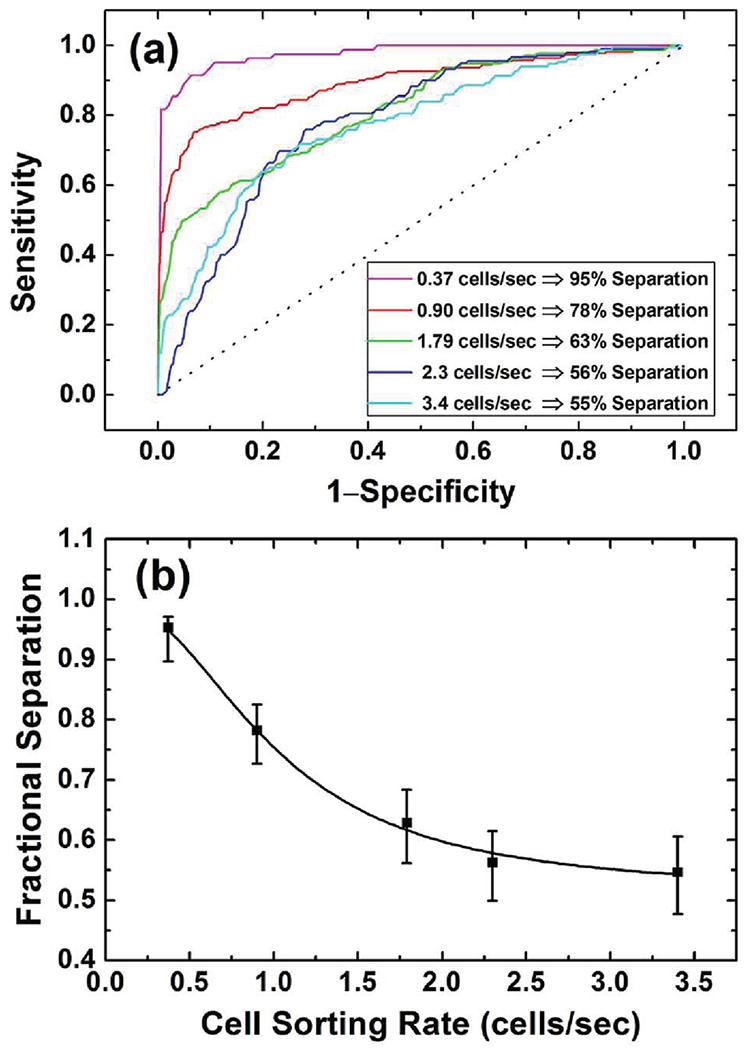
(a) The ROC curves and the calculated fractional separation (FS) for different cell sorting rates. (b) The logistic fit of the FS versus the cell sorting rate.
Arc Design for Separation and Characterization of Murine Breast Cancer Cells (4T1) and Murine Bone Marrow Cells.
While size-based yeast cell separation is of important practical significance, more biomedically relevant cell separation is on mammalian cells. Therefore, it is of great interest to characterize the performance of size-based separation of mammalian cells. To test the present separation and characterization scheme for mammalian cells, we applied the device to separate and characterize binary mixtures of murine breast cancer cells (4T1) and murine bone marrow cells. The device dimension and operation conditions are modified from those for polystyrene beads and yeast cells, as discussed in the Experimental Methods section. Since the mammalian cells tended to deposit on the substrate surface over time, we used a higher concentration of cells to obtain statistically meaningful results in a short time period. In the experiment, we used a mixture with a cell concentration of 3 × 10⁷ cells/mL, which led to a cell sorting rate of 2.37 cells/s.
Test runs showed that as a result of these channel dimension modifications, the buffer from branch B1 could not push the cells well against the left wall of the triangle hurdle, leading to poor cell separation (Figure 5a). This is because for better dc-DEP separation, cells need to enter the separation region along the same flow streamline so different DEP forces can separate them. To compensate for this negative effect of the larger size of branch B2, we modified the profile of the left wall of the triangle hurdle by introducing an arc wall (the designed radius of the arc structure is 180 μm) to ensure that all cells enter the DEP cell separation region at approximately the same position, as shown in Figure 5b.
Figure 5.
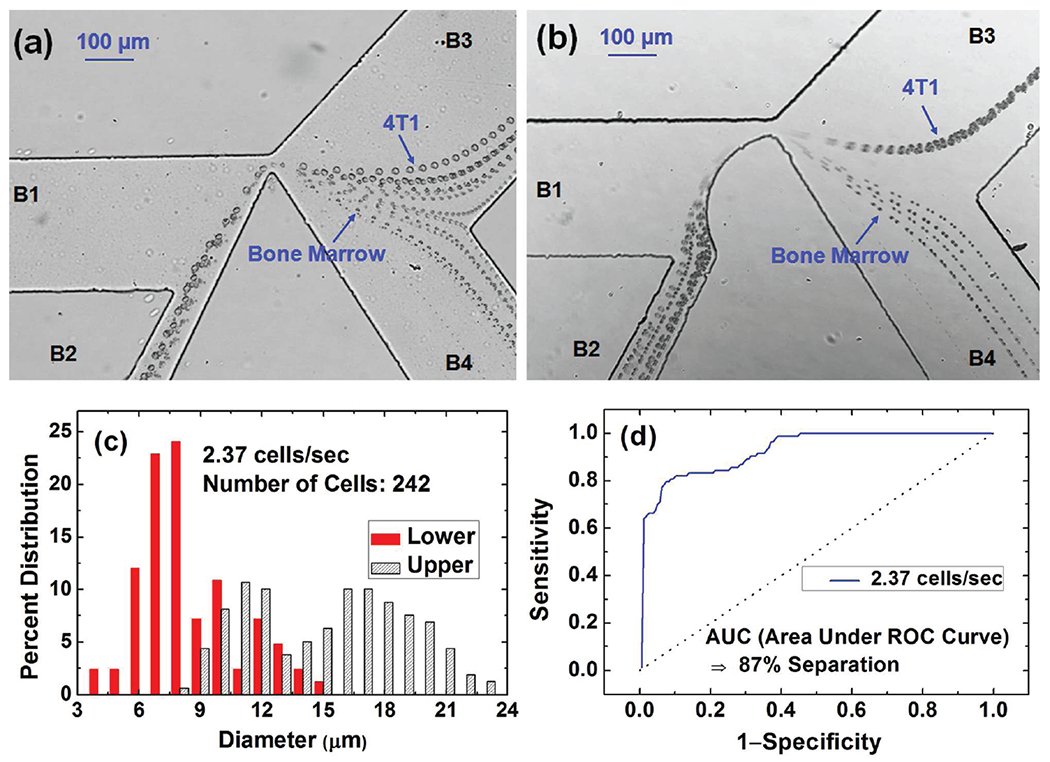
(a-b) The traces of 4T1 breast cancer cells and bone marrow cells via superimposing 5.7 s consecutive images of the moving cells around a triangle (a) and an arc hurdle (b), respectively. (c) The histograms of percentage size distributions for the upper and lower branches. (d) The ROC separation curve for 4T1 and bone marrow cells, yielding an 87% fractional separation.
Figure 5b shows the traces of the 4T1 and bone marrow cells from superimposing 5.7 s consecutive images. As expected, the 4T1 cells, which are larger than the bone marrow cells, are deflected into the upper branch (B3), while the smaller bone marrow cells flow into the lower branch (B4). Size characterization with the downstream microfluidic Coulter counter yields the cell size distribution based on calibration results from more than 200 of 9.77 μm-diameter polystyrene beads. The histogram of percentage size distributions (Figure 5c) shows that for the two separate cell populations, there is an overlap in the size range of 8–15 μm. The ROC analysis, as shown in Figure 5d, yields an 87% fractional separation.
For comparison, we have also characterized the size distribution of 356 4T1 tumor cells and 302 murine bone marrow cells, respectively, with detailed distributions plotted in the Supporting Information (Figure S-2). The average diameter of the 4T1 cells is 17.63 μm with a standard deviation of 3.04 μm, while the average diameter for the bone marrow cells is 8.08 μm with a standard deviation of 1.39 μm. Given that the size distribution of both the 4T1 and bone marrow cells approximately follows normal distribution around the average cell size, it is interesting that the separated cell population in the upper channel shows a size distribution with double peaks. At present, we could not explain the observed double peaks conclusively. One possible reason could be that the bone marrow cells could stick together as twins or triplets, which have larger sizes and flow into the upper channel. Another potential reason is that some bone marrow cells stick to the 4T1 cells and shift the distribution of the 4T1 cells. These speculations are based on our observation that mammalian cells tend to stick together in the experiments. However, to draw solid conclusions, much more extensive experiments need to be done. Given the main scope of this paper is to demonstrate the simultaneous on-chip cell sorting and size characterization and to introduce the ROC analysis to characterize the separation performance for samples with continuous size distribution, we leave the thorough understanding of the observed double peaks in separated cell population to future research.
Further Discussion.
As mentioned in the introduction, microfluidic cell separation has attracted significant attention in the past decade, and a significant amount of efforts have been devoted to develop various microfluidic separation techniques including dc-DEP continuous flow separation. The presented research, with integrated microfluidic Coulter counters to size each cell flowing through the sorter, provides an accurate quantitative characterization of the separation performance as a function of the separation throughput or cell sorting rate. The ROC analysis provides an effective approach to characterize the overlap between separated cell distributions. These data lead to a new understanding of microfluidic cell separation. While the sizing fluidic circuit can be readily integrated with other size-based microfluidic cell separation schemes, here we briefly compare the obtained results with other dc-DEP based microfluidic cell separation as this is the separation scheme we adopted in this paper.
First of all, as mentioned in the introduction, most published microfluidic cell separation studies mainly focused on demonstration of the separation mechanism, only with qualitative, superimposed phase contrast or fluorescent images to show the separation of binary particles of significant size difference.19–21,35–38 More recent studies tend to present at least some quantitative analysis of the separation performance. For example, using dc-DEP separation, Zhu et al.39 separated 1 and 5 μm polystyrene beads and 3 μm polystyrene beads and 4–8 μm yeast cells. Quantitative characterization is only provided for the beads and cell mixture by observing the collection wells through phase contrast imaging. The percentage separation is beyond 90%. However, there is no characterization of the size distribution of yeast cells in the two wells and no separation performance as a function of the separation throughput. Therefore, the presented separation performance as a function of separation throughput, enabled by the quantitative characterization and ROC analysis for yeast colony with a continuous size distribution, provides new insights into the operation of dc-DEP based cell separation.
The MOSFET-based microfluidic Coulter counter circuit, with the current design parameter and without any further optimization, could have a characterization throughput well beyond tens of cells/s. In fact, with further design optimization such as reducing the sensing channel length, together with better noise elimination techniques, the characterization throughput can easily reach thousands of cells per second. In that case, the limitation of the throughput will be mainly fluidic such as the maximum flow velocity that cells can survive. Given the potential to significantly increase the throughput of the MOSFET-based Coulter counter and the fact that cell separation performance degrades as the sorting throughput increases, we do not expect any limitation from the characterization throughput of the MOSFET-based Coulter counter.
SUMMARY
In a summary, we show that by combining a dc-DEP cell sorter and MOSFET-based Coulter counters, simultaneous on-chip size-based cell separation and quantitative separation performance characterization can be achieved. With the new design of dc-DEP cell separation, we can significantly reduce the duration during which cells are exposed to strong electric fields. In addition, an arc shape design of the triangle hurdle wall can be introduced to force the cells to enter the cell separation region from approximately the same position, which is necessary for a good separation result. The integrated MOSFET-based microfluidic Coulter counter presents quantitative characterization of the size distribution of the separated cells. Results show that for dc-DEP cell separation, the separation performance degrades as the cell sorting rate increases. For cells with continuous size distribution, we find that fractional separation, a single parameter from the ROC analysis, presents an ideal quantitative parameter reflecting the cell separation performance.
Supplementary Material
ACKNOWLEDGMENTS
J.S. and D.L. acknowledge financial support from NSF (CBET-0643583). E.M.B. and R.J.I. were partially supported from NIH R01GM090207.
Footnotes
Supporting Information
Text and Figures S-1 and S-2. This material is available free of charge via the Internet at http://pubs.acs.org.
REFERENCES
- (1).Pamme N Lab Chip 2007, 7, 1644–1659. [DOI] [PubMed] [Google Scholar]
- (2).Tsutsui H; Ho CM Mech. Res. Commun 2009, 36, 92–103. [DOI] [PMC free article] [PubMed] [Google Scholar]
- (3).Erickson D; Li DQ Anal. Chim. Acta 2004, 507, 11–26. [Google Scholar]
- (4).Ohno K; Tachikawa K; Manz A Electrophoresis 2008, 29, 4443–4453. [DOI] [PubMed] [Google Scholar]
- (5).Davis JA; Inglis DW; Morton; Lawrence DA; Huang LR; Chou SY; Sturm JC; Austin RH Proc. Natl. Acad. Sci. USA. 2006, 103, 14779–14784. [DOI] [PMC free article] [PubMed] [Google Scholar]
- (6).Mohamed H; McCurdy LD; Szarowski DH; Duva S; Turner JN; Caggana M IEEE Trans. Nanobiosci. 2004, 3, 251–256. [DOI] [PubMed] [Google Scholar]
- (7).Taylor J; Ren CL; Stubley GD Biotechnol. Prog 2008, 24, 981–991. [DOI] [PubMed] [Google Scholar]
- (8).Di Carlo D; Edd JF; Irimia D; Tompkins RG; Toner M Anal. Chem 2008, 80, 2204–2011. [DOI] [PubMed] [Google Scholar]
- (9).Choi S; Park JK Lab Chip 2005, 5, 1161–1167. [DOI] [PubMed] [Google Scholar]
- (10).Doh I; Cho YH Sens. Actuators, A 2005, 121, 59–65. [Google Scholar]
- (11).Li YL; Kaler KVIS Anal. Chim. Acta 2004, 507, 151–161. [Google Scholar]
- (12).Yang J; Huang Y; Wang XB; Becker FF; Gascoyne PRC Anal. Chem 1999, 71, 911–918. [DOI] [PubMed] [Google Scholar]
- (13).Vykoukal J; Vykoukal DM; Freyberg S; Alt EU; Gascoyne PRC Lab Chip 2008, 8, 1386–1393. [DOI] [PMC free article] [PubMed] [Google Scholar]
- (14).Kralj JG; Lis ΜTW; Schmidt MA; Jensen KF Anal. Chem 2006, 78, 5019–5025. [DOI] [PubMed] [Google Scholar]
- (15).Grier DG Nature 2003, 424, 810–816. [DOI] [PubMed] [Google Scholar]
- (16).Shi J; Huang H; Stratton Z; Huang Y; Huang TJ Lab Chip 2009, 9, 3354–3359. [DOI] [PubMed] [Google Scholar]
- (17).Petersson F; Aberg L; Sward-Nilsson AM; Laurell T Anal. Chem 2007, 79, 5117–5123. [DOI] [PubMed] [Google Scholar]
- (18).Han KH; Frazier AB IEE Proc. Nanobiotechnol. 2006, 153, 67–73. [DOI] [PubMed] [Google Scholar]
- (19).Barbulovic-Nad I; Xuan XC; Lee JSH; Li DQ Lab Chip 2006, 6, 274–279. [DOI] [PubMed] [Google Scholar]
- (20).Kang KH; Kang Y; Xuan X; Li D Electrophoresis 2006, 27, 694–702. [DOI] [PubMed] [Google Scholar]
- (21).Kang Y; Li D; Kalams SA; Eid JE Biomed. Microdevices 2008, 10, 243–249. [DOI] [PubMed] [Google Scholar]
- (22).Lasko TA; Bhagwat JG; Zou KH; Ohno-Machado L/. Biomed. Informatics 2005, 38, 404–415. [DOI] [PubMed] [Google Scholar]
- (23).Pohl HA Dielectrophoresis: the behavior of neutral matter in nonuniform electric fields; Cambridge University Press: Cambridge, New York, 1978. [Google Scholar]
- (24).Probstein RF Physicochemical hydrodynamics: an introduction, 2nd ed.; John Wiley & Sons: New York, 1994. [Google Scholar]
- (25).Jones TB Electromechanics of particles; Cambridge University Press: Cambridge; New York, 1995. [Google Scholar]
- (26).Morgan H; Green NG AC electrokinetics: colloids and nanoparticles; Research Studies Press: Philadelphia, PA, 2003. [Google Scholar]
- (27).Xu D; Kang Y; Sridhar M; Hmelo AB; Feldman LC; Li D; Li D Appl. Phys. Lett 2007, 91, 013901. [Google Scholar]
- (28).Sridhar M; Xu DY; Kang YJ; Hmelo AB; Feldman LC; Li DQ; Li DY J. Appl. Phys 2008, 103, 104701. [DOI] [PMC free article] [PubMed] [Google Scholar]
- (29).Sun J; Stowers CC; Boczko EM; Li D Lab Chip 2010, 10, 2986–2993. [DOI] [PMC free article] [PubMed] [Google Scholar]
- (30).Sun JS; Vajandar SK; Xu DY; Kang YJ; Hu GQ; Li DQ; Li DY Microfluid. Nanofluid 2009, 6, 589–598. [Google Scholar]
- (31).Kubitschek HE In Methods in Microbiology; Ribbons RW, Norris JR, Eds.; Academic: London, 1969; p 503. [Google Scholar]
- (32).Stowers CC; Robertson JB; Ban HJ; Tanner RD; Boczko EM Appl. Biochem. Biotechnol 2009, 156, 489–505. [DOI] [PubMed] [Google Scholar]
- (33).Stowers C; Hackworth D; Mischaikow K; Gedeon T; Boczko EJ Biomed. Sci Eng 2010, 3, 987–1001. [Google Scholar]
- (34).Newcombe RG Stat. Med 1998, 17, 857–872. [DOI] [PubMed] [Google Scholar]
- (35).Fiedler S; Shirley SG; Schnelle T; Fuhr G Anal. Chem 1998, 70, 1909–1915. [DOI] [PubMed] [Google Scholar]
- (36).Shafiee H; Sano MB; Henslee EA; Caldwell JL; Davalos RV Lab Chip 2010, 10, 438–445. [DOI] [PubMed] [Google Scholar]
- (37).Beech JP; Jonsson P; Tegenfeldt JO Lab Chip 2009, 9, 2698–2706. [DOI] [PubMed] [Google Scholar]
- (38).Hawkins BG; Ezekiel Smith A; Syed YA; Kirby BJ Anal. Chem 2007, 79, 7291–7300. [DOI] [PubMed] [Google Scholar]
- (39).Zhu J; Canter RC; Keten G; Vedantam P; Tzeng T-RJ; Xuan X Microfluid. Nanofluid 2011, 11, 743–752. [Google Scholar]
Associated Data
This section collects any data citations, data availability statements, or supplementary materials included in this article.


