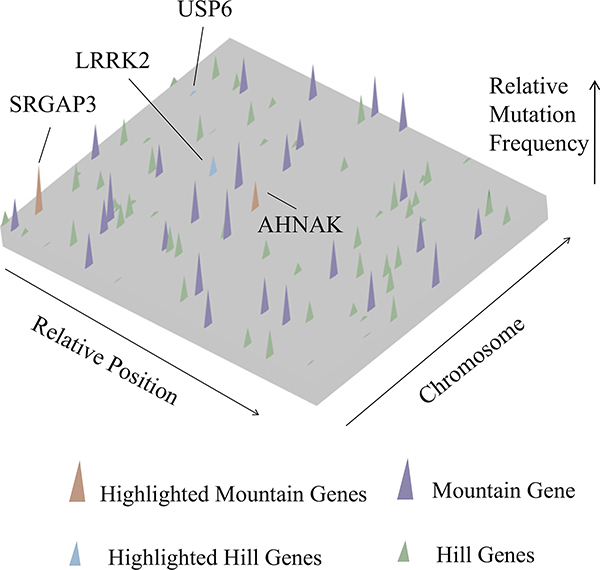
Figure 4. Intratumoral Gene Mutation Landscape of an Individual ccRCC Patient.
Nonsynonymous somatic mutations are plotted in two-dimensional space, which represents chromosomal positions of mutant genes. Chromosomal positions and mutant genes were ranked as indicated by arrows beside the plane. Each mutant gene is scaled by a relative position (0–1) on its chromosome; thus, its position on different chromosomes was normalized by its total length. Higher peaks (purple) —peak heights assigned a value of mutant reads ratio—indicate the 28 identified mountain genes. The shorter peaks (green), with peak heights assigned a value of mutant reads ratio, show the 66 identified hill genes. Genes recurrently mutated in the large patient cohort are marked in red (mountain) and blue (hill). See also Table S5 for details.

