

Abstract
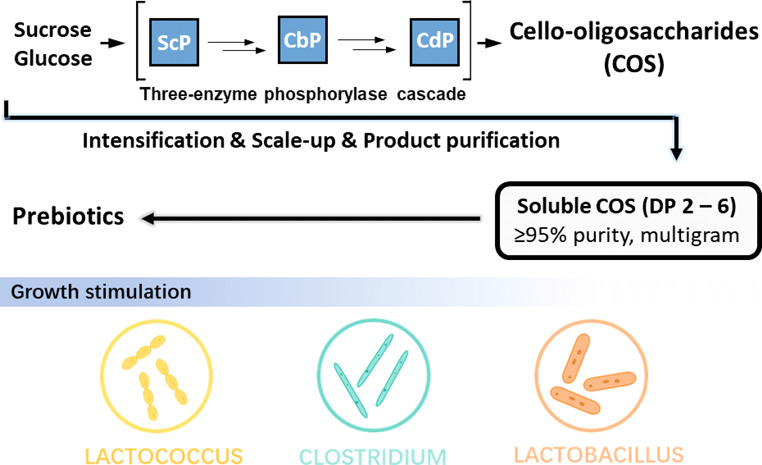
Short-chain cello-oligosaccharides (COS; degree of polymerization, DP ≤ 6) are promising water-soluble dietary fibers. An efficient approach to their bottom-up synthesis is from sucrose and glucose using glycoside phosphorylases. Here, we show the intensification and scale up (20 mL; gram scale) of COS production to 93 g/L product and in 82 mol % yield from sucrose (0.5 M). The COS were comprised of DP 3 (33 wt %), DP 4 (34 wt %), DP 5 (24 wt %), and DP 6 (9 wt %) and involved minimal loss (≤10 mol %) to insoluble fractions. After isolation (≥95% purity; ≥90% yield), the COS were examined for growth promotion of probiotic strains. Benchmarked against inulin, trans-galacto-oligosaccharides, and cellobiose, COS showed up to 4.1-fold stimulation of cell density for Clostridium butyricum, Lactococcus lactis subsp. lactis, Lactobacillus paracasei subsp. paracasei, and Lactobacillus rhamnosus but were less efficient with Bifidobacterium sp. This study shows the COS as selectively functional carbohydrates with prebiotic potential and demonstrates their efficient enzymatic production.
Keywords: functional carbohydrates, dietary fibers and prebiotics, cello-oligosaccharides, cascade biocatalysis, glycoside phosphorylases, sucrose, process intensification
Introduction
Probiotics, typically found in the genera of Bifidobacterium and Lactobacillus, are live microorganisms that confer health benefit to the host when controlled in an adequate amount.1 Correspondingly, prebiotics are the ingredients that serve as nutritional sources for the probiotic bacteria to produce biologically important compounds (e.g., short-chain fatty acids, SCFA), which in turn mediate relevant health effects in the human body.2,3 Numerous health benefits, such as stimulation of immune system,4 regulation of the gastrointestinal function,5 antiobesity effect,6 and prevention of carcinogenesis,7 are associated with the intake of prebiotics. Prebiotic components are defined by the following criteria: they are not digested by the host, they are fermentable by the intestinal microbiota, and they show selective stimulation of the growth and/or activity of beneficial intestinal bacteria.8−10 Nondigestible oligosaccharides (NDOs) are usually built from common (i.e., readily digestible) monosaccharides (e.g., d-glucose, d-mannose, d-galactose, and d-fructose) but involve glycoside linkages largely resistant to hydrolytic degradation by human digestive enzymes. NDOs thus become available as carbon and energy sources for bacteria residing in the lower gastrointestinal tract and act as a specific type of prebiotic.11,12 Several NDOs have been commercialized for prebiotic use. The products are usually mixtures of individual compounds from a structural class of oligosaccharides and may differ in monosaccharide composition, glycoside linkage type, and degree of polymerization (DP, 3–10 sugar units).13 Currently, several classes of NDOs, such as d-galacto-oligosaccharides (GOS, β-1,3/4/6 linked) and d-fructo-oligosaccharides (FOS, β-2,1-linked), have been claimed to show prebiotic properties.6,11,14,15
The rapidly growing evidence on the dynamic composition of the gut microbiota in relation to human health and development strongly motivates the search for new prebiotic NDOs showing selective agency in promoting the growth of microbiota species. In this context, short-chain soluble cello-oligosaccharides (COS) are promising as dietary fibers. COS are linear d-gluco-oligomers built from β-1,4-glycoside linkages. For DP ≤ 6, the COS are soluble in water. Longer COS tend to form insoluble cellulose material. Soluble COS are not digested by the human arsenal of digestive glycoside hydrolases. They thus constitute novel NDOs that have already drawn significant interest from the food industry.16,17 For now, a number of studies performed in vitro or in vivo support the idea of COS exhibiting prebiotic properties. Cellotriose, which is the smallest COS, and the disaccharide cellobiose are the substrates for in vitro growth of probiotic bacteria, such as several Lactobacillus strains,18,19Bifidobacterium breve UCC2003,20 and Bacteroides vulgatus DSM 1447.21 Also, in vivo experiments show a beneficial effect of COS on the intestinal microbiota of calves.22 With the initial studies showing promise, it would be desirable to assess the functional properties of soluble COS (especially those of DP ≥ 3) in greater detail. Limitation on the applicability of COS arises due to the compound availability and price. To further develop their uses, COS must be produced at large scale efficiently.
Generally, the routes for COS production are categorized according to whether they are based upon the depolymerization of cellulose or bottom-up synthesis.23−25 Chemical and enzymatic methods are known for both routes.23,26 However, COS production in high yield and with proper DP control remains challenging.27,28 Technology fit for the bulk production of soluble COS is currently lacking. We previously reported a three-enzyme cascade system for conversion of sucrose and glucose into COS of the desired DP between 3 and 6.29 The enzymes used are glycoside phosphorylases: sucrose phosphorylase (ScP), cellobiose phosphorylase (CbP) and cellodextrin phosphorylase (CdP). In the sequence-based classification of carbohydrate-active enzymes, ScP is found in family GH13 and CbP and CdP both belong to family GH94.30 The COS are synthesized by a DP-controlled, iterative elongation of glucose from α-d-glucose 1-phosphate (αGlc1-P) via a linear CbP-CdP cascade reaction (Figure 1). The intermediary αGlc1-P is produced from sucrose by ScP in the presence of phosphate. This enzyme system enabled a favorable production of soluble COS from expedient substrates. The yield on sucrose was as high as ∼88 mol %.29 While useful as a method, the enzymatic synthesis would strongly benefit from significant intensification of the production level to industrially demanded product concentrations in the range of ∼100 g/L. In addition, the scale up to gram-scale production would be required for detailed product evaluation. This study was performed to promote the enzymatic synthesis of COS toward a robust biocatalytic process technology.
Figure 1.

Phosphorylase cascade for the synthesis of COS from sucrose and glucose. Interconnected enzymatic reactions establishing a phosphate/αGlc1-P shuttle for the iterative β-1,4-glucosylation of glucose are shown. For the soluble COS (DP ≤ 6), n = 1–4. ScP, sucrose phosphorylase; CbP, cellobiose phosphorylase; CdP, cellodextrin phosphorylase.
Here, we demonstrate the soluble COS production at the 20 mL scale to ∼100 g/L. In terms of the product concentration, this represents a 2.4-fold intensification as compared to the earlier studies.29 A set of interrelated process factors (substrate loading, enzyme activity and enzyme ratio, reaction time) was examined, for the synthetic efficiency. Besides the product concentration, the distribution of DP in product, so as to avoid loss of COS to insoluble material, was an important additional criterion of that efficiency. To prevent elongation of the COS to longer chains (DP > 6) resulting in their precipitation, flux through the reaction steps required suitable control of the enzyme activity ratio to make the chain extension by CdP to be primarily rate limiting overall. We here describe a complete process comprised of efficient up- and downstream processing. The COS product was isolated from the reaction in gram scale with excellent purity (≥95%) and yield (≥90%). Its composition was reasonably balanced with respect to the individual degree of polymerization represented. The COS were assessed for growth promotion of a representative selection of probiotic bacterial strains.31 Referenced against established oligosaccharide prebiotics (trans-galacto-oligosaccharides, inulin) and cellobiose, the COS showed substantial (≤4.1-fold) stimulation of growth (in terms of maximal cell density reached) for Clostridium butyricum, Lactococcus lactis subsp. lactis, Lactobacillus paracasei subsp. paracasei, and Lb. rhamnosus. Interestingly, the COS were by far less efficient with strains of the genus Bifidobacterium (B. animalis, B. adolescentis). This study thus reveals the COS as selectively functional carbohydrates with significant prebiotic potential.
Materials and Methods
The materials used were of reagent grade. COS standards of DP 3–6 were from Megazyme (Wicklow, Ireland). Cellobiose (purity ≥ 99%) was from Pfeifer & Langen (Köln, Germany). TOS (Lot. TOS-100610-50g) was from YAKULT Pharmaceutical Ind. Co., Ltd. (Tokyo, Japan). Inulin from chicory (I2255-10G) was from Sigma-Aldrich (Vienna, Austria).
Enzymes
Sucrose phosphorylase from B. adolescentis (BaScP, GenBank identifier AF543301.1), cellobiose phosphorylase from Cellulomonas uda (CuCbP; GenBank identifier AAQ20920.1), and cellodextrin phosphorylase from Clostridium cellulosi (CcCdP; GenBank identifier CDZ24361.1) were prepared according to literature.29 Briefly, each enzyme was produced harboring N-terminal His-tag. The Escherichia coli strains producing enzymes were grown at 37 °C in LB medium (with 0.1 mg/mL ampicillin). Expression induced with 0.25 mM isopropyl β-d-1-thiogalactopyranoside was done overnight at 25 °C. Baffled shake flasks (1 L) containing 250 mL of medium were used. Agitation was at 120 rpm in a CERTOMAT (BS-1, Sartorius Stedim, Vienna, Austria). Approximately 1–1.2 g of dry cell per liter of culture was obtained. The specific activity (units/g cell dry weight) was approximately 2995 (BaScP), 1980 (CuCbP), and 3960 (CcCdP). After cell harvest and disruption, enzymes were purified aided by their N-terminal His-tag. In terms of activity recovered as purified enzyme, the yield was approximately 15% (BaScP), 23% (CuCbP), and 18% (CcCdP). Purified proteins were desalted using the Vivaspin Turbo 30 kDa cutoff concentrator tubes (Sartorius Stedim, Vienna, Austria) with MES buffer (50 mM, pH 7.0). Protein was measured with Roti-Quant reagent (Carl Roth, Karlsruhe, Germany) using BSA as standard. The enzymes used here had specific activities of 122 (BaScP), 32 (CuCbP), and 13 U/mg (CcCdP).
Enzyme activities were determined by reported methods.29 Briefly, the activities of CuCbP and CcCdP were determined at 45 °C and pH 7.0 in the direction of cellobiose and COS synthesis, respectively. A 50 mM MES buffer was used that contained the substrates 50 mM glucose (CuCbP) or 50 mM cellobiose (CcCdP) and 50 mM αGlc1-P. The phosphate released was measured. The activity of BaScP was determined in the direction of sucrose phosphorolysis (50 mM sucrose and phosphate; pH 7.0, 45 °C). The αGlc1-P released was determined using a continuous-coupled enzyme assay.32
COS Synthesis and Purification
All reactions were carried out at 45 °C. A MES buffer (50 mM, pH 7.0) was used. Substrate concentration was set as phosphate 50 mM, sucrose 0.5 M, and glucose 0.15 M. The volumetric activities of BaScP, CuCbP, and CcCdP were varied as indicated in the Results and Discussion. Purified enzymes were used in all reactions, and they were stable during the full reaction time course. Samples were periodically taken from the reactions, heated (95 °C, 5 min) to inactivate the enzymes, and analyzed by HPLC. Unless mentioned, the reactions were performed in a total volume of 1.0 mL. Incubations were done in a ThermoMixer C (Eppendorf, Vienna, Austria) with an agitation rate of 300 rpm. Scale up of the reaction volume was done at 20 mL. A 50 mL centrifuge tube (Sarstedt, Inc., NC, USA) was used and incubated in a shaking water bath (temperature controlled at 45 °C) with a shaking rate of 300 rpm.
The reaction mixture from the 20 mL reaction was purified in two steps. Yeast treatment of the heated (95 °C, 5 min) and centrifuged reaction mixture was the first step. Instant dry yeast (Dr. Oetker GmbH, Bielefeld, Germany) was added to 30 g/L in a 50 mL Sarstedt tubes equipped with perforated lids. Incubation was at 30 °C and 100 rpm in a CERTOMAT (BS-1, Sartorius Stedim, Vienna, Austria) for 24 h. Upon depletion of carbohydrates other than COS, in particular, d-fructose, the yeast was centrifuged off (5000 rpm, 4 °C, 20 min) and the supernatant was filtered (0.45 μm; Minisart NML, Sartorius AG, Göttingen, Germany). For solvent precipitation as the second purification step, the filtered solution was poured into cold acetone (1:9 by volume) with stirring and incubated at 4 °C overnight. Precipitate was collected (5000 rpm, 10 min) and washed several times with acetone. It was air dried, lyophilized, and weighed.
Analytics
The COS were quantified using a Hitachi LaChrom HPLC system (Merck, Darmstadt, Germany) equipped with a Luna 5 μm NH2 column (100 Å, 250 × 4.6 mm, Phenomenex, Aschaffenburg, Germany) operated at 40 °C. Acetonitrile–water (67.5:32.5, by volume) was used as eluent at a flow rate of 1.5 mL/min. Cellobiose was quantified using an Aminex HPX-87H Column (300 × 7.8 mm, Bio-Rad Laboratories, Vienna, Austria) operated at 60 °C. Sulfuric acid (5 mM) was used as eluent at a flow rate of 0.5 mL/min. Sucrose and cellobiose were quantified by a YMC-Pack Polyamine II/S-5 μm/12 nm column (250 × 4.6 mm, YMC America, Allentown, US) at room temperature. Acetonitrile–water (75:25, by volume) was used at a flow rate of 1.0 mL/min. Glucose and fructose were quantified using an Aminex HPX-87C Column (300 × 7.8 mm, Bio-Rad Laboratories, Vienna, Austria) operated at 80 °C. Milli-Q water was used as eluent at a flow rate of 0.4 mL/min. Refractive index detection was used. Calibration was done with authentic standards. Besides, free phosphate was determined by a colorimetric assay.33
The measured concentrations of substrates, intermediates, and products were assessed for internal consistency based on mass balance. The molar yield of the reaction was defined as the mole ratio (mol %) of the glucosyl units transferred into products to the sucrose substrate added. Considering reactions in which a substantial portion of products ended up insoluble, we defined a so-called soluble mole ratio (mol %). This is the ratio of total glucosyl units in products that remained soluble to the glucosyl units transferred from αGlc1-P in the overall reaction.
The 1H nuclear magnetic resonance (NMR) spectra of the purified COS product (lyophilized) in 4% NaOD/D2O (concentration 10 mg/mL) were recorded on a Varian Inova 500 NMR Spectrometer (Agilent Technologies, Santa Clara, CA) applying 32 scan cycles. In addition, wide-angle X-ray diffraction (WAXD) measurement of the purified COS (lyophilized) was done under ambient conditions using a Bruker AXS D8 Advance powder diffractometer in Bragg–Brentano geometry with a LynxEye Detector operated at 40 kV and 40 mA using Cu Kα radiation (λ = 1.54178 Å). Diffraction angles were measured from 5° to 50°.
Evaluation of COS in Microbial Growth Experiments
B. animalis subsp. lactis HN019/DR10, Lb. paracasei subsp. paracasei SHIROTA, and Lb. rhamnosus LGG were from the in-house culture collection of the Institute of Food Science. B. adolescentis DSM 20083 and C. butyricum DSM 10702 were from DSMZ (Deutsche Sammlung von Mikroorganismen and Zellkulturen, Braunschweig, Germany). Lc. lactis subsp. lactis LMG 6890 was from the LMG Bacteria Collection of the Belgian Coordinated Collections of Microorganisms (BCCM). Strain maintenance used the conditions slightly modified from the literature.34 Briefly, Bifidobacterium spp. and lactobacilli were maintained at −72 °C in MRS (de Man, Rogosa, and Sharpe) broth containing 0.5 g/L l-cysteine hydrochloride and 15% (w/v) glycerol. Lc. lactis was maintained in M17 broth with 15% (w/v) glycerol. C. butyricum was maintained in Reinforced Clostridial Medium (RCM) containing 15% (w/v) glycerol.
Frozen bifidobacteria, lactobacilli, and Lc. lactis subsp. lactis were activated by streaking onto MRS agar and anaerobically incubating at 37 °C for 24–48 h (80% N2, 10% H2, 10% CO2). C. butyricum was streaked onto RCM agar and anaerobically cultured at 37 °C for 24 h. Afterward, a single colony from each agar plate was picked and transferred into an appropriate medium: MRS broth for bifidobacteria, lactobacilli, and Lc. lactis subsp. lactis; RCM for C.butyricum. Strains were incubated anaerobically at 37 °C overnight. The optical densities of the fresh cultures were adopted to 0.08–0.10 with the relevant sugar-free sterile broth. Suspension cultures were then diluted 1:100 with sugar-free broth containing 4% Oxyrase (Oxyrase Inc., Mansfield, OH, USA). In each well of the honeycomb microtiter plate, 100 μL of the bacterial suspension was mixed with 150 μL of 2× sugar-free broth and 50 μL 3% (w/v) glucose/prebiotic solution. Finally, each well was covered with sterile mineral oil. The final concentration of glucose (set as positive control), cellobiose, and prebiotic oligosaccharides (COS, TOS, and inulin) in these media was 0.5% (w/v).
The inoculated honeycomb plates were placed in the reading chamber of Bioscreen C MBR (Labsystems, Vantaa, Finland) and incubated at 37 °C. The optical densities of the cultures were measured periodically for 48–72 h depending on the cultures. All of the measurements were carried out in biological triplicates.
Results and Discussion
Intensification of the COS Production
As demonstrated in our earlier studies, the three-enzyme cascade reaction shown in Figure 1 is promising for biocatalytic production of short-chain COS from sucrose and glucose. We previously identified key engineering parameters of the process output (substrate concentration and substrate ratio, enzyme activities and enzyme ratio, reaction time) and succeeded in disentangling their complex relationship for systematic process optimization. Using 0.2 M sucrose and 0.065 M glucose, we thus obtained a COS concentration of 39 g/L for a targeted conversion of sucrose of ∼95%.29 The COS yield on sucrose was 88 mol %. Using enzyme activity ratios within a suitable range (BaScP:CuCbP:CcCdP, 10:3:2 U/mL), the chain extension was controlled to largely (≤5%) prevent loss of overelongated COS into insoluble material. Considering the enzymatic productions of established oligosaccharide prebiotics at concentrations of ∼350 g/L (FOS) and ∼100 g/L (GOS),35 we here set forth to intensify the enzymatic COS production to a target concentration of ∼100 g/L so as to better meet the demands for industrial use of the COS.
We thus increased the sucrose concentration to 0.5 M and kept the glucose/sucrose mole ratio at 0.3. According to the earlier evidence, these conditions should yield COS product at the target concentration and in the desired sucrose conversion (∼90%.). Although glucose was reported to inhibit CbP36−38 as well as ScP,39 the effect of an increased glucose concentration (0.15 M compared to 0.065 M used previously) was unlikely to be vitally important. The phosphate concentration was kept at 50 mM considering the action of phosphate/αGlc1-P shuttle (Figure 1) that recycles phosphate to the reaction of BaScP. Temperature (45 °C) and pH (7.0) were left as previously found to be optimal for the three enzymes.29 Importantly, based on the earlier evidence,29 the enzyme activity ratio was kept at 10:3:2 (U/mL) for BaScP, CuCbP, and CcCdP.
The time course of COS production under these conditions is shown in Figure 2A. Release of total soluble COS increased almost linearly with time over the whole 6 h of reaction. Formation of the individual oligosaccharide showed a largely similar trend. A maximum product concentration was ∼80 g/L. The COS was composed mainly of G3 (cellotriose; 36 wt %) and G4 (cellotetraose; 33 wt %). The G5 (cellopentaose; 23 wt %) was less abundant, and a small amount of G6 (cellohexaose; 8 wt %) was present. Although the reaction was still progressing at 6 h (Figure 2A), we did not proceed in its analysis due to the incipient formation of insoluble material. The sucrose conversion was just 67 mol % at this point, so that further improvement of the synthesis was deemed to be necessary.
Figure 2.

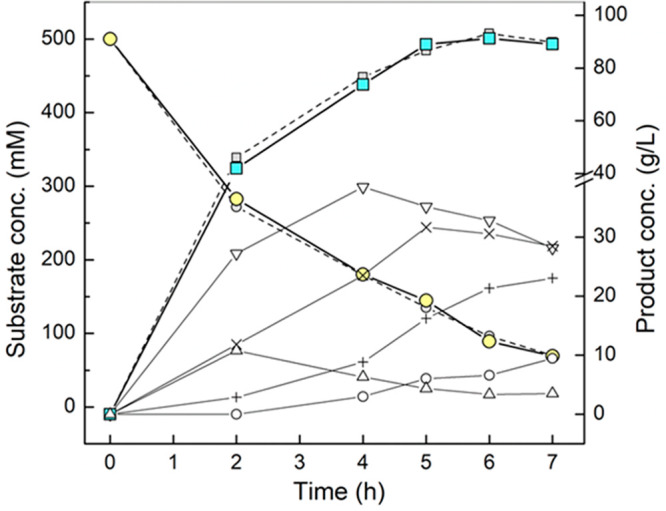
Time-course analysis of substrate conversion and soluble COS release in the reaction with varied enzyme loading ratios at 45 °C and pH 7.0. Substrate concentration as sucrose 0.5 M, glucose 0.15 M, and phosphate 50 mM was fixed. Enzyme activity ratio (BaScP:CuCbP:CcCdP) was set to (A) 10:3:2, (B) 20:6:4, (C) 15:5:2, and (D) 20:6:2 U/mL. (●) Sucrose, (■) total soluble COS, (▲) glucose, (Δ) G2, (▽) G3, (×) G4, (+) G5, (○) G6. Fructose release (not shown) parallels the sucrose consumption precisely (≤5% deviation). Data are from single representative time-course experiments but agree within typically ≤10% with replicates performed.
We considered that in order to enhance the sucrose conversion, it would be crucial to better separate the kinetic phases of soluble and insoluble products formation. We additionally considered that formation of the insoluble product due to self-assembly of longer chain oligosaccharides (DP > 6) is a spontaneous (uncatalyzed) process. An increase in the volumetric enzyme activity to shorten the time for cellulose chain polymerization might thus promote soluble product formation selectively. We thus performed the reaction at a doubled enzyme loading of 20:6:4 (U/mL). The corresponding time course profile is shown in Figure 2B. The sucrose conversion was accelerated (1.6-fold), and the maximum concentration of soluble COS was increased to 82 g/L after 5 h. The sucrose conversion was enhanced to 74 mol % at this point. The soluble product was comprised mainly of G3 (32 wt %), G4 (34 wt %), and G5 (26 wt %). G6 was in a small amount (8 wt %). Continued reaction to 6 h consumed more sucrose (83 mol %), but the soluble COS concentration decreased. A relatively large portion (29 mol %) of the total product was lost as insoluble material. Interestingly, the concentrations of the most soluble COS (G3, G4, G5) were decreased at 6 h. The concentration of G6 was increased slightly but not to an extent that would account for the concentration decrease of the other soluble COS. Rapid extension of G3, G4, and G5 into insoluble COS in the absence of a significant accumulation of G6 seems unlikely. We suggest that formation of insoluble material might result in partial coprecipitation of shorter COS. Evidence from earlier studies suggested that a limiting amount of cellobiose (G2) for elongation (Figure 2B) would lead to longer chains and hence insoluble products.29,40 We considered that further improvement of the COS synthesis might be obtained from selectively slowing down the chain extension reaction relative to the αGlc1-P and cellobiose forming reactions. We thus kept the CcCdP activity at a comparably low level (2 U/mL) and varied the associated BaScP and CuCbP activities. Reaction time courses are shown in Figure 2C and 2D.
An important result was that both conditions largely succeeded in preventing insoluble product formation (≤10 mol % at 8 h). The maximum COS concentration (85 g/L, Figure 2C; 93 g/L, Figure 2D) was obtained after 6 h. The product composition at this point was similar to the previous reactions (Figure 2A and 2B), for example, with G3 (33 wt %) and G4 (33 wt %) as the main product and G5 also prominently present (24 wt %) (Figure 2D). However, the time course in Figure 2D is interesting because it brings out more clearly than in the other reactions the dynamics of formation and further utilization of the individual oligosaccharides. Cellobiose was initially accumulated until 2 h and gradually converted. The G3 was the main product in the initial phase of the reaction up to 4 h. Later, the G3 concentration decreased, apparently to benefit formation of longer oligosaccharides. The G4 and G5 curves reflect a similar but somewhat dampened trend as compared to the G3 curve. The maximum concentrations of G4 and G5 were shifted to longer reaction times, as expected (Figure 2D). Reaction in Figure 2D gave a product yield from sucrose of 82 mol % (at 6 h). An interesting finding from Figure 2C and 2D is that by varying the reaction time in the range 5–8 h, it became possible to fine tune the product composition for an almost constant concentration of total soluble COS. For example, in Figure 2D the product composition at 5 h was 39 wt % G3, 35 wt % G4, 19 wt % G5, and 7 wt % G6. The total COS concentration was 87 g/L. At 8 h, however, the product composition was 26 wt % G3, 31 wt % G4, 29 wt % G5, and 14 wt % G6. The total COS concentration was however hardly changed (89 g/L).
In summary, the results demonstrate intensification of COS production by about 2.4-fold compared to previous reports.29 A final COS concentration was obtained that compares optimistically to the enzymatic production process for the established oligosaccharide prebiotics.35 However, compared to productions of GOS and FOS that rely on the use of just a single enzyme,35 the COS production requires three enzymes to be operated in cascade reactions. The additional complexity of the biotransformation requires careful attention, particularly when considered for large-scale production. Improving the overall eco-efficiency by avoiding the use of purified (or commercial) enzymes should be noted. To this end, a whole-cell or cell-free catalysis system41 based on enzymes coexpression is considered promising and has been in the plan for future application.
Scale up the Reaction and Purification of the COS
Using the reaction conditions from Figure 2D, we scaled up the enzymatic conversion to a 20 mL volume. The reaction time course at 1 and 20 mL was almost superimposable, as shown in Figure 3. Thus, ∼2 g of COS was synthesized. After removal of the enzymes, the supernatant was used for product isolation. A total volume of 20 mL was processed in the procedure described below and schematically shown in Figure 4A. The sample had a total carbohydrate content of around 200 g/L. Besides COS (95 g/L, including G2), it contained fructose (74 g/L), glucose (2 g/L), and sucrose (31 g/L).
Figure 3.
Time-course analysis of sucrose conversion and soluble COS release in the scaled-up production. Reaction was performed in 20 mL at 45 °C and pH 7.0 using the enzyme activity ratio (BaScP:CuCbP:CcCdP) of 20:6:2 U/mL. Substrate concentration as sucrose 0.5 M, glucose 0.15 M, and phosphate 50 mM was fixed. (●) Sucrose (gray circle, 1 mL reaction), (■) total soluble COS (gray square, 1 mL reaction), (Δ) G2, (▽) G3, (×) G4, (+) G5, (○) G6. Fructose release (not shown) parallels the sucrose consumption precisely (≤5% deviation). Data are from single representative time-course experiments but agree within typically ≤10% with replicates performed.
Figure 4.

Downstream processing of the enzymatic reaction mixture for isolation of COS product. (A) Graphical illustration showing the integration of upstream (COS biosynthesis) and downstream processing (purification) with each step indicated. (B) HPLC profile and (C) composition analysis of the mixtures before and after purification. Original material was obtained from the reaction using 0.5 M sucrose, 0.15 M glucose, and 50 mM phosphate and 20 U/mL BaScP, 6 U/mL CuCbP, and 2 U/mL CcCdP at 45 °C, pH 7.0 for 6 h. Ori, original material; Y-T, yeast treatment; Pr, product precipitation using 90% acetone (v/v). Data are from a single representative experiment but agree within typically ≤5% with replicates performed.
Selective fermentation by Saccharomyces cerevisiae of all carbohydrates except COS was recently shown as an efficient first step of COS purification.42 However, the challenge here was to demonstrate the applicability of the method to carbohydrate solutions as concentrated as the reaction mixture. The literature suggests limitations (inhibition, toxicity) to arise at >200 g/L of total carbohydrate dependent on composition.43,44 We were pleased that S. cerevisiae (30 g dry cell mass/L) converted the residual carbohydrates completely in 24 h (30 °C, pH 7.0), while it left the COS product essentially unaffected (Figure 4B and 4C). A slight increase in the COS concentration may be due to water evaporation (∼8%) during fermentation. We additionally noted that the COS solubility was improved substantially upon removal of the accompanying carbohydrates (Figure S1). Therefore, unless the COS are purified further, their storage after the yeast treatment is preferred.
As shown previously,29,45 COS precipitation with acetone (by 9 times the volume of sample) was used to isolate COS from the products of the yeast fermentation, in particular ethanol, glycerol, and acetic acid.46 The COS were precipitated quantitatively, and redissolution of the solid pellet in the original volume of water gave a concentration of 92 g/L. From HPLC analysis, the isolated COS had a purity of ∼98% (Figure 4B). The purification yield was almost quantitative (∼90%). A total amount of ∼2.0 g of COS product was thus obtained. The original composition of the COS product was mostly retained (Figure 4C). The purification procedure was successfully adapted to this highly concentrated product solution. We note that the acetone solvent used for the precipitation step could be recovered conventionally by distillation for reuse, thus improving the E-factor and the overall eco-efficiency of the COS downstream process. The purified product was lyophilized to additionally demonstrate a conveniently stored, solid product from the enzymatic production (Figure S2). The solid product was redissolved fully without a change in composition. Overall, we show the scale up of COS synthesis and demonstrate efficient integration of up- and downstream processing for multigram-scale production of pure COS product.
Besides HPLC analysis referenced against the authentic standards, the isolated COS were analyzed and their expected chemical structure verified by 1H NMR spectroscopy. The 1H NMR spectrum recorded from purified COS dissolved in strongly alkaline solution of D2O is shown in Figure 5A. The shown proton signals can be assigned from the literature.47 Signals at chemical shifts (δH) of 4.5 and 5.2 ppm are characteristic of the reducing-end β- and α-anomeric proton, respectively. The anomeric region showed a doublet at δH 4.25, which is assigned to the β-1,4-linked glucosyl monomers with a nonreducing end. The dominant doublet at δH 4.30 corresponds to the β-1,4-internal linkages. No unassigned signals were present in the full 1H NMR spectra. The COS product is therefore comprised of a single type of glycoside linkage, clearly assigned as β-1,4.
Figure 5.

Structural characterization of the purified COS. (A) 1H NMR spectrum and (B) WAXD patterns of the purified COS. 1H NMR spectra of the purified (lyophilized) COS dissolved in 4% NaOD/D2O (10 mg/mL) were recorded on a Varian Inova 500 NMR Spectrometer applying 32 scan cycles. WAXD data were recorded from the lyophilized COS product.
We also performed analysis with wide-angle X-ray diffraction of the isolated product obtained from the enzymatic reaction after the acetone precipitation and lyophilization. It was interesting to note that this insoluble but readily redissolvable material showed crystalline features (Figure 5B) quite similar to the precipitated (insoluble) products from enzymatic reaction (Figure S3). Three prominent diffraction peaks are observed (2θ at 12.3°, 20.0°, and 22.1°). The peaks can be assigned from the literature48 to the crystal faces 110, 110, and 020 of cellulose II allomorph. Formation of crystalline cellulose II allomorph was possibly due to the self-assembly of oligosaccharides chains in acetone-induced precipitation.49,50 Interestingly, the cellulose product obtained from acetone-precipitated and lyophilized COS was readily redissolved in water, whereas the products precipitated during enzymatic synthesis were not redissolved. We thus assume that small changes in the COS chain length determine the final properties of insoluble material regarding dissolution in water.
COS as Prebiotics: Evaluation of Growth Promotion among Probiotic Strains
The COS used had the following composition: G2, 2.4 wt %; G3, 34.5 wt %; G4, 34.3 wt %; G5, 22.5 wt %; and G6, 6.3 wt %. They were assessed for growth promotion of important probiotic bacteria. Unlike previous studies that used the COS in individual DP or COS from enzymatic hydrolysate containing a large amount of cellobiose (>90 wt %), the current study focused on the potential prebiotic effect of COS mixtures with DP centered at 3–6. Established prebiotic oligosaccharides (TOS, inulin)11,13 were used as benchmarks. Glucose and cellobiose were used as additional references. The strains used here (Bifidobacterium spp. and Lactobacillus spp.) are frequently considered in the studies that evaluate compound prebiotic potential.1 We additionally chose Lc. lactis subp. lactis and C. butyricum. The Lc. lactis subp. lactis strain was recommended as a probiotic claimed for the maintenance of intestinal microflora, stimulation of the immune system, and improvement of the nutritional value of foods.51,52C.butyricum is an emerging probiotic with established uses in Asia where this strain has been commercialized.53
Results of the growth course analysis by optical density (OD600) are summarized in Figure 6. Maximum OD600 values obtained with cellobiose, COS, TOS, or inulin as the sole carbon source are normalized to the OD600 obtained with glucose. Generally, except for Lc. lactis growing on COS (Figure 6A) and Lb. paracasei subsp. paracasei growing on cellobiose (Figure 6C), the OD600 was highest when glucose was used. Evidence from Figure 6 is used to categorize the six strains in two groups depending on whether COS was able to stimulate their growth.
Figure 6.

Influence of different oligosaccharides (prebiotics) on the growth of probiotic strains. Strains: (A) Lc. lactis subsp. lactis; (B) C. butyricum; (C) Lb. paracasei subsp. paracasei; (D) Lb. rhamnosus; (E) B. animalis spp. lactis; (F) B. adolescentis. Growth curves were corrected with eliminating the internal background from culture media (without inoculation). Concentration of positive control glucose, cellobiose, or prebiotic oligosaccharides (COS, TOS, and inulin) in these media was 0.5% (w/v). All of the measurements were carried out in biological triplicates.
The first group, comprising in particular Lc. lactis subsp. lactis and C. butyricum but also Lb. rhamnosus and Lb. paracasei subsp. paracasei, showed much better growth in terms of both growth rate and maximum OD600 reached on COS than TOS or inulin. Remarkably, the growth on COS was comparable to (Lc. lactis subsp. lactis, C. butyricum) or just slightly worse (Lb. rhamnosus, Lb. paracasei subsp. paracasei) than on glucose. As shown in Figure 6A–D, the maximum cell density was enhanced between 2.0- and 4.1-fold on COS compared to TOS and inulin. Generally, COS were similarly efficient as cellobiose. Lc. lactis subsp. lactis (Figure 6A) and C. butyricum (Figure 6B) grew faster and reached higher maximum OD600 on COS than cellobiose. Lb. paracasei subsp. paracasei and Lb. rhamnosus grew equally fast on COS and cellobiose. These strains reached a higher OD600 on cellobiose.
Comparatively, the group comprised of Bifidobacterium strains showed good growth on glucose, moderate growth on TOS, and relatively poor growth on COS, cellobiose, and inulin (Figure 6E and 6F). Among the oligosaccharide substrates offered, these strains showed clear preference toward TOS compared to COS and cellobiose (Figures 6 and 7A). Taking the whole set of data shown in a plot of the distribution of the cell densities obtained on oligosaccharide substrate relative to glucose (Figure 7B), COS was revealed to surpass TOS and inulin regarding the effect on growth promotion among the strains tested. This is worth noting because TOS and inulin have been widely considered to be powerful prebiotics for Lactobacillus strains.3,12,15 The COS showed a similar pattern and efficacy as cellobiose in stimulating growth. However, in terms of the other technological aspects of soluble dietary fibers (e.g., water binding capacity, viscosity and bulking properties, low sweetness), oligosaccharides seem to be clearly preferred over disaccharides for functional food use.54,55 We note that the compound prebiotic potential is determined by multiple factors. However, among these factors, the ability to promote the growth of probiotic organisms is a crucially essential one. Evidence presented here thus demonstrates that COS can exhibit favorable effects on the probiotic strains. The strains promoted best in their growth by the COS are known to release SFCA during growth on carbohydrates.2,53,56
Figure 7.

(A) Cell growth measured as OD600 at a stationary phase referenced against the OD600 of the positive control on glucose. Strain: Lb1, Lb. paracasei subsp. paracasei; Lb2, Lb. rhamnosus; Bf1, B. animalis spp. lactis; Bf2, B. adolescentis. All values shown are the means from three biological replicates. (B) Box-plot analysis of the relative cell growth (OD600) referenced against glucose to assess the potential prebiotic effect of each oligosaccharide. On each box, the line in the middle represents the median, the edges of the box are the 25th and 75th percentiles, the whiskers extend to the most extreme data points, and the + signs indicate the mean values.
The clear selectivity of COS in promoting the growth of certain microorganisms raised our immediate interest as to the molecular basis of the effect. We considered that in order to harness oligosaccharides for a substantial growth benefit, microorganisms often rely on dedicated uptake systems for a particular oligosaccharide class into the cell.57−59 The specificity of the uptake system determines the relative efficiency of microbial growth on different substrates. Microorganisms differ widely in regard to their oligosaccharide uptake systems available to them from the genome.60,61 For example, in cellulolytic microorganisms, most of the oligosaccharides are not saccharified in the extracellular environment but transported through specific proteins into the cytoplasm. There, they are further metabolized by the hydrolase or phosphorylase.62 Thus far, an increasing number of lactic acid and cellulolytic bacteria have been shown to metabolize cellobiose and short COS (up to DP 6),18,19,63,64 suggesting that these strains are equipped with the corresponding membrane transporters for cellobiose and COS (or similar oligosaccharides).21 Indeed, the ABC (ATP-binding cassette) transporter, capable of transporting the COS with DP 2–6, has been identified in bacteria, such as B. breve UCC2003, C. thermocellum, and Ruminiclostridium cellulolyticum (Table S1).20,65−69 Genome search (https://www.ncbi.nlm.nih.gov/) revealed that the strains stimulated by COS contain the genes for putative ABC transporter and catabolic enzymes (β-glucosidase or phosphorylase) that could be relevant for the uptake and/or degradation of COS substrates (Table S1).21,70−73 The corresponding (β-1,4-specific) transporters were rarely found in the Bifidobacterium strains tested.21,74 The observed growth of these strains on COS might be explained by the nonspecific uptake mediated by unrelated transporters (e.g., maltodextrin ABC transporter58) with the promiscuous specificities. Collectively, the presence of a system comprised of suitable transporter and/or catabolic enzymes may be required for bacteria to efficiently grow on the COS. Taken together, the current study demonstrates short-chain soluble COS with DP 3–6 as selectively functional carbohydrates with significant prebiotic potential. It additionally shows the efficient enzymatic production of such COS in high yield and purity from simple and expedient substrates.
Glossary
Abbreviations Used
- ABC
ATP-binding cassette
- CbP
cellobiose phosphorylase
- CdP
cellodextrin phosphorylase
- COS
cello-oligosaccharides
- DP
degree of polymerization
- FOS
d-fructo-oligosaccharides
- GOS
d-galacto-oligosaccharides
- αGlc1-P
α-d-glucose 1-phosphate
- MRS
de Man, Rogosa, and Sharpe
- NDO
nondigestible oligosaccharides
- NMR
nuclear magnetic resonance
- OD
optical densities
- RCM
reinforced clostridial medium
- SCFA
short-chain fatty acids
- ScP
sucrose phosphorylase
- TOS
trans-d-galacto-oligosaccharides
- WAXD
wide-angle X-ray diffraction
Supporting Information Available
The Supporting Information is available free of charge at https://pubs.acs.org/doi/10.1021/acs.jafc.0c02660.
Figures and table describing the production, storage stability, and purification of soluble COS; crystal structure of insoluble COS from enzymatic reaction; genomic searching of putative systems for COS utilization in bacteria (PDF)
This project received funding from the European Union’s Horizon 2020 Research and Innovation Program under grant agreement no. 761030 (CARBAFIN).
The authors declare no competing financial interest.
Notes
Data Accessibility Statement. Data obtained in the current study are available from 10.5281/zenodo.3833799.
Supplementary Material
References
- Fijan S. Microorganisms with claimed probiotic properties: an overview of recent literature. Int. J. Environ. Res. Public Health 2014, 11, 4745–4767. 10.3390/ijerph110504745. [DOI] [PMC free article] [PubMed] [Google Scholar]
- Markowiak P.; Śliźewska K. Effects of probiotics, prebiotics, and synbiotics on human health. Nutrients 2017, 9, 1021. 10.3390/nu9091021. [DOI] [PMC free article] [PubMed] [Google Scholar]
- Davani-Davari D.; Negahdaripour M.; Karimzadeh I.; Seifan M.; Mohkam M.; Masoumi S. J.; Berenjian A.; Ghasemi Y. Prebiotics: Definition, types, sources, mechanisms, and clinical applications. Foods 2019, 8, 92. 10.3390/foods8030092. [DOI] [PMC free article] [PubMed] [Google Scholar]
- Vieira A.; Teixeira M.; Martins F. The role of probiotics and prebiotics in inducing gut immunity. Front. Immunol. 2013, 4, 00445. 10.3389/fimmu.2013.00445. [DOI] [PMC free article] [PubMed] [Google Scholar]
- Vitetta L.; Briskey D.; Hayes E.; Shing C.; Peake J. A review of the pharmacobiotic regulation of gastrointestinal inflammation by probiotics, commensal bacteria and prebiotics. Inflammopharmacology 2012, 20, 251–266. 10.1007/s10787-012-0126-8. [DOI] [PubMed] [Google Scholar]
- Liu Y.; Chen J.; Tan Q.; Deng X.; Tsai P. J.; Chen P. H.; Ye M.; Guo J.; Su Z. Nondigestible oligosaccharides with anti-obesity effects. J. Agric. Food Chem. 2020, 68, 4–16. 10.1021/acs.jafc.9b06079. [DOI] [PubMed] [Google Scholar]
- Raman M.; Ambalam P.; Kondepudi K. K.; Pithva S.; Kothari C.; Patel A. T.; Purama R. K.; Dave J. M.; Vyas B. R. M. Potential of probiotics, prebiotics and synbiotics for management of colorectal cancer. Gut Microbes 2013, 4, 181–192. 10.4161/gmic.23919. [DOI] [PMC free article] [PubMed] [Google Scholar]
- Gibson G.; Scott K.; Rastall R.; Tuohy K.; Hotchkiss A.; Dubert-Ferrandon A.; Gareau M.; Murphy E.; Saulnier D.; Loh G.; Macfarlane S.; Delzenne N.; Ringel Y.; Kozianowski G.; Dickmann R.; Lenoir-Wijnkoop I.; Walker C.; Buddington R. Dietary prebiotics: Current status and new definition. Food Sci. Tech Bull. Funct Foods 2010, 7, 1–19. 10.1616/1476-2137.15880. [DOI] [Google Scholar]
- Gibson G. R.; Roberfroid M. B. Dietary modulation of the human colonic microbiota: introducing the concept of prebiotics. J. Nutr. 1995, 125, 1401–1412. 10.1093/jn/125.6.1401. [DOI] [PubMed] [Google Scholar]
- Gibson G. R.; Probert H. M.; Loo J. V.; Rastall R. A.; Roberfroid M. B. Dietary modulation of the human colonic microbiota: updating the concept of prebiotics. Nutr. Res. Rev. 2004, 17, 259–275. 10.1079/NRR200479. [DOI] [PubMed] [Google Scholar]
- Swennen K.; Courtin C. M.; Delcour J. A. Non-digestible oligosaccharides with prebiotic properties. Crit. Rev. Food Sci. Nutr. 2006, 46, 459–471. 10.1080/10408390500215746. [DOI] [PubMed] [Google Scholar]
- Roberfroid M. Prebiotics: The concept revisited. J. Nutr. 2007, 137, 830S–837S. 10.1093/jn/137.3.830S. [DOI] [PubMed] [Google Scholar]
- Mussatto S. I.; Mancilha I. M. Non-digestible oligosaccharides: A review. Carbohydr. Polym. 2007, 68, 587–597. 10.1016/j.carbpol.2006.12.011. [DOI] [Google Scholar]
- Grizard D.; Barthomeuf C. Non-digestible oligosaccharides used as prebiotic agents: mode of production and beneficial effects on animal and human health. Reprod., Nutr., Dev. 1999, 39, 563–588. 10.1051/rnd:19990505. [DOI] [PubMed] [Google Scholar]
- Slavin J. Fiber and prebiotics: mechanisms and health benefits. Nutrients 2013, 5, 1417–1435. 10.3390/nu5041417. [DOI] [PMC free article] [PubMed] [Google Scholar]
- Akpinar O.; Penner M. H. Preparation of cellooligosaccharides: comparative study. J. Food Agric. Environ. 2015, 6, 55–61. 10.1234/4.2008.1078. [DOI] [Google Scholar]
- Damme V.; Maximilienne I. B.. Low calorie food compositions. U.S. Patent 20180303120, 2018.
- Karnaouri A.; Matsakas L.; Krikigianni E.; Rova U.; Christakopoulos P. Valorization of waste forest biomass toward the production of cello-oligosaccharides with potential prebiotic activity by utilizing customized enzyme cocktails. Biotechnol. Biofuels 2019, 12, 285. 10.1186/s13068-019-1628-z. [DOI] [PMC free article] [PubMed] [Google Scholar]
- Okano K.; Zhang Q.; Yoshida S.; Tanaka T.; Ogino C.; Fukuda H.; Kondo A. d-Lactic acid production from cellooligosaccharides and β-glucan using L-LdH gene-deficient and endoglucanase-secreting Lactobacillus plantarum. Appl. Microbiol. Biotechnol. 2010, 85, 643–650. 10.1007/s00253-009-2111-8. [DOI] [PubMed] [Google Scholar]
- Pokusaeva K.; O’Connell-Motherway M.; Zomer A.; Macsharry J.; Fitzgerald G. F.; van Sinderen D. Cellodextrin utilization by Bifidobacterium breve UCC2003. Appl. Environ. Microbiol. 2011, 77, 1681–1690. 10.1128/AEM.01786-10. [DOI] [PMC free article] [PubMed] [Google Scholar]
- Vigsnaes L. K.; Nakai H.; Hemmingsen L.; Andersen J. M.; Lahtinen S. J.; Rasmussen L. E.; Hachem M. A.; Petersen B. O.; Duus J. O.; Meyer A. S.; Licht T. R.; Svensson B. In vitro growth of four individual human gut bacteria on oligosaccharides produced by chemoenzymatic synthesis. Food Funct. 2013, 4, 784–793. 10.1039/c3fo30357h. [DOI] [PubMed] [Google Scholar]
- Uyeno Y.; Kawashima K.; Hasunuma T.; Wakimoto W.; Noda M.; Nagashima S.; Akiyama K.; Tabata M.; Kushibiki S. Effects of cellooligosaccharide or a combination of cellooligosaccharide and live Clostridium butyricum culture on performance and intestinal ecology in Holstein calves fed milk or milk replacer. Livest Sci. 2013, 153, 88–93. 10.1016/j.livsci.2013.02.005. [DOI] [Google Scholar]
- Billès E.; Coma V.; Peruch F.; Grelier S. Water-soluble cellulose oligomer production by chemical and enzymatic synthesis: a mini-review. Polym. Int. 2017, 66, 1227–1236. 10.1002/pi.5398. [DOI] [Google Scholar]
- Nakai H.; Kitaoka M.; Svensson B.; Ohtsubo K. Recent development of phosphorylases possessing large potential for oligosaccharide synthesis. Curr. Opin. Chem. Biol. 2013, 17, 301–309. 10.1016/j.cbpa.2013.01.006. [DOI] [PubMed] [Google Scholar]
- Kadokawa J.-I.; Kobayashi S. Polymer synthesis by enzymatic catalysis. Curr. Opin. Chem. Biol. 2010, 14, 145–153. 10.1016/j.cbpa.2009.11.020. [DOI] [PubMed] [Google Scholar]
- Zhang Y. P.; Lynd L. R. Cellodextrin preparation by mixed-acid hydrolysis and chromatographic separation. Anal. Biochem. 2003, 322, 225–232. 10.1016/j.ab.2003.07.021. [DOI] [PubMed] [Google Scholar]
- Kobayashi S. Challenge of synthetic cellulose. J. Polym. Sci., Part A: Polym. Chem. 2005, 43, 693–710. 10.1002/pola.20662. [DOI] [Google Scholar]
- Zhong C.; Luley-Goedl C.; Nidetzky B. Product solubility control in cellooligosaccharide production by coupled cellobiose and cellodextrin phosphorylase. Biotechnol. Bioeng. 2019, 116, 2146–2155. 10.1002/bit.27008. [DOI] [PMC free article] [PubMed] [Google Scholar]
- Zhong C.; Nidetzky B. Three-enzyme phosphorylase cascade for integrated production of short-chain cellodextrins. Biotechnol. J. 2020, 15, 1900349. 10.1002/biot.201900349. [DOI] [PubMed] [Google Scholar]
- Puchart V. Glycoside phosphorylases: Structure, catalytic properties and biotechnological potential. Biotechnol. Adv. 2015, 33, 261–276. 10.1016/j.biotechadv.2015.02.002. [DOI] [PubMed] [Google Scholar]
- Ljungh A.; Wadstrom T. Lactic acid bacteria as probiotics. Curr. Issues Intest. Microbiol. 2006, 7, 73–89. [PubMed] [Google Scholar]
- Eis C.; Nidetzky B. Characterization of trehalose phosphorylase from Schizophyllum commune. Biochem. J. 1999, 341, 385–393. 10.1042/bj3410385. [DOI] [PMC free article] [PubMed] [Google Scholar]
- Saheki S.; Takeda A.; Shimazu T. Assay of inorganic phosphate in the mild pH range, suitable for measurement of glycogen phosphorylase activity. Anal. Biochem. 1985, 148, 277–281. 10.1016/0003-2697(85)90229-5. [DOI] [PubMed] [Google Scholar]
- Kittibunchakul S.; Maischberger T.; Domig K. J.; Kneifel W.; Nguyen H. M.; Haltrich D.; Nguyen T. H. Fermentability of a novel galacto-oligosaccharide mixture by Lactobacillus spp. and Bifidobacterium spp. Molecules 2018, 23, 3352. 10.3390/molecules23123352. [DOI] [PMC free article] [PubMed] [Google Scholar]
- Martins G. N.; Ureta M. M.; Tymczyszyn E. E.; Castilho P. C.; Gomez-Zavaglia A. Technological aspects of the production of fructo and galacto-oligosaccharides. Enzymatic synthesis and hydrolysis. Front Nutr 2019, 6, 00078. 10.3389/fnut.2019.00078. [DOI] [PMC free article] [PubMed] [Google Scholar]
- Nidetzky B.; Eis C.; Albert M. Role of non-covalent enzyme-substrate interactions in the reaction catalysed by cellobiose phosphorylase from Cellulomonas uda. Biochem. J. 2000, 351, 649–659. 10.1042/bj3510649. [DOI] [PMC free article] [PubMed] [Google Scholar]
- Nidetzky B.; Griessler R.; Schwarz A.; Splechtna B. Cellobiose phosphorylase from Cellulomonas uda: gene cloning and expression in Escherichia coli and application of the recombinant enzyme in a ‘glycosynthase-type’ reaction. J. Mol. Catal. B: Enzym. 2004, 29, 241–248. 10.1016/j.molcatb.2003.11.014. [DOI] [Google Scholar]
- Kitaoka M.; Sasaki T.; Taniguchi H. Synthetic reaction of Cellvibrio gilvus cellobiose phosphorylase. J. Biochem. 1992, 112, 40–44. 10.1093/oxfordjournals.jbchem.a123862. [DOI] [PubMed] [Google Scholar]
- Sprogøe D.; van den Broek L. A. M.; Mirza O.; Kastrup J. S.; Voragen A. G. J.; Gajhede M.; Skov L. K. Crystal structure of sucrose phosphorylase from Bifidobacterium adolescentis. Biochemistry 2004, 43, 1156–1162. 10.1021/bi0356395. [DOI] [PubMed] [Google Scholar]
- Petrovic D. M.; Kok I.; Woortman A. J.; Ciric J.; Loos K. Characterization of oligocellulose synthesized by reverse phosphorolysis using different cellodextrin phosphorylases. Anal. Chem. 2015, 87, 9639–9646. 10.1021/acs.analchem.5b01098. [DOI] [PubMed] [Google Scholar]
- Wachtmeister J.; Rother D. Recent advances in whole cell biocatalysis techniques bridging from investigative to industrial scale. Curr. Opin. Biotechnol. 2016, 42, 169–177. 10.1016/j.copbio.2016.05.005. [DOI] [PubMed] [Google Scholar]
- Nguyen T. H.; Haltrich D.. Microbial production of prebiotic oligosaccharides. In Microbial Production of Food Ingredients, Enzymes and Nutraceuticals; McNeil B., Archer D., Giavasis I., Harvey L., Eds.; Woodhead Publishing: Cambridge, 2013; Chapter 18, pp 494–530. [Google Scholar]
- Beerens K.; De Winter K.; Van de Walle D.; Grootaert C.; Kamiloglu S.; Miclotte L.; Van de Wiele T.; Van Camp J.; Dewettinck K.; Desmet T. Biocatalytic synthesis of the rare sugar kojibiose: process scale-up and application testing. J. Agric. Food Chem. 2017, 65, 6030–6041. 10.1021/acs.jafc.7b02258. [DOI] [PubMed] [Google Scholar]
- Yoon S.-H.; Mukerjea R.; Robyt J. F. Specificity of yeast (Saccharomyces cerevisiae) in removing carbohydrates by fermentation. Carbohydr. Res. 2003, 338, 1127–1132. 10.1016/S0008-6215(03)00097-1. [DOI] [PubMed] [Google Scholar]
- Katano H.; Noba S.; Sato K.; Kimoto H. Solubility-based separation and purification of long-chain chitin oligosaccharides with an organic-water mixed solvent. Anal. Sci. 2017, 33, 639–642. 10.2116/analsci.33.639. [DOI] [PubMed] [Google Scholar]
- Klein M.; Swinnen S.; Thevelein J. M.; Nevoigt E. Glycerol metabolism and transport in yeast and fungi: established knowledge and ambiguities. Environ. Microbiol. 2017, 19, 878–893. 10.1111/1462-2920.13617. [DOI] [PubMed] [Google Scholar]
- Isogai A. NMR analysis of cellulose dissolved in aqueous NaOH solutions. Cellulose 1997, 4, 99–107. 10.1023/A:1018471419692. [DOI] [Google Scholar]
- Hori R.; Wada M. The thermal expansion of cellulose II and IIIII crystals. Cellulose 2006, 13, 281–290. 10.1007/s10570-005-9038-8. [DOI] [Google Scholar]
- Pereira A.; Duarte H.; Nosrati P.; Gubitosi M.; Gentile L.; Romano A.; Medronho B.; Olsson U. Cellulose gelation in NaOH solutions is due to cellulose crystallization. Cellulose 2018, 25, 3205–3210. 10.1007/s10570-018-1794-3. [DOI] [Google Scholar]
- Han J.; Zhou C.; Wu Y.; Liu F.; Wu Q. Self-Assembling behavior of cellulose nanoparticles during freeze-drying: Effect of suspension concentration, particle size, crystal structure, and surface charge. Biomacromolecules 2013, 14, 1529–1540. 10.1021/bm4001734. [DOI] [PubMed] [Google Scholar]
- Liu M.; Zhang X.; Hao Y.; Ding J.; Shen J.; Xue Z.; Qi W.; Li Z.; Song Y.; Zhang T.; Wang N. Protective effects of a novel probiotic strain, Lactococcus lactis ML2018, in colitis: in vivo and in vitro evidence. Food Funct. 2019, 10, 1132–1145. 10.1039/C8FO02301H. [DOI] [PubMed] [Google Scholar]
- Nguyen T. L.; Chun W.-K.; Kim A.; Kim N.; Roh H. J.; Lee Y.; Yi M.; Kim S.; Park C.-I.; Kim D.-H. Dietary probiotic effect of Lactococcus lactis WFLU12 on low-molecular-weight metabolites and growth of olive flounder (Paralichythys olivaceus). Front. Microbiol. 2018, 9, 2059–2059. 10.3389/fmicb.2018.02059. [DOI] [PMC free article] [PubMed] [Google Scholar]
- Cassir N.; Benamar S.; La Scola B. Clostridium butyricum: from beneficial to a new emerging pathogen. Clin. Microbiol. Infect. 2016, 22, 37–45. 10.1016/j.cmi.2015.10.014. [DOI] [PubMed] [Google Scholar]
- Blackwood A. D.; Salter J.; Dettmar P. W.; Chaplin M. F. Dietary fibre, physicochemical properties and their relationship to health. J. R Soc. Promot Health 2000, 120, 242–247. 10.1177/146642400012000412. [DOI] [PubMed] [Google Scholar]
- Delzenne N. M.; Cani P. D.; Delmée E.; Neyrinck A. M.. Non-digestible oligosaccharides. In Novel food ingredients for weight control; Henry C. J. K., Ed.; Woodhead Publishing: Sawston, Cambridge, 2007; p 153. [Google Scholar]
- LeBlanc J. G.; Chain F.; Martín R.; Bermúdez-Humarán L. G.; Courau S.; Langella P. Beneficial effects on host energy metabolism of short-chain fatty acids and vitamins produced by commensal and probiotic bacteria. Microb. Cell Fact. 2017, 16, 79. 10.1186/s12934-017-0691-z. [DOI] [PMC free article] [PubMed] [Google Scholar]
- Sanz M. L.; Côté G. L.; Gibson G. R.; Rastall R. A. Influence of glycosidic linkages and molecular weight on the fermentation of maltose-based oligosaccharides by human gut bacteria. J. Agric. Food Chem. 2006, 54, 9779–9784. 10.1021/jf061894v. [DOI] [PubMed] [Google Scholar]
- Andersen J. M.; Barrangou R.; Abou Hachem M.; Lahtinen S. J.; Goh Y. J.; Svensson B.; Klaenhammer T. R. Transcriptional analysis of oligosaccharide utilization by Bifidobacterium lactis Bl-04. BMC Genomics 2013, 14, 312–312. 10.1186/1471-2164-14-312. [DOI] [PMC free article] [PubMed] [Google Scholar]
- Flint H. J.; Scott K. P.; Duncan S. H.; Louis P.; Forano E. Microbial degradation of complex carbohydrates in the gut. Gut Microbes 2012, 3, 289–306. 10.4161/gmic.19897. [DOI] [PMC free article] [PubMed] [Google Scholar]
- Goh Y. J.; Klaenhammer T. R. Genetic mechanisms of prebiotic oligosaccharide metabolism in probiotic microbes. Annu. Rev. Food Sci. Technol. 2015, 6, 137–156. 10.1146/annurev-food-022814-015706. [DOI] [PubMed] [Google Scholar]
- Abou Hachem M.; Andersen J. M.; Barrangou R.; Møller M. S.; Fredslund F.; Majumder A.; Ejby M.; Lahtinen S. J.; Jacobsen S.; Lo Leggio L.; Goh Y. J.; Klaenhammer T. R.; Svensson B. Recent insight into oligosaccharide uptake and metabolism in probiotic bacteria. Biocatal. Biotransform. 2013, 31, 226–235. 10.3109/10242422.2013.828048. [DOI] [Google Scholar]
- Desvaux M. Unravelling carbon metabolism in anaerobic cellulolytic bacteria. Biotechnol. Prog. 2006, 22, 1229–1238. 10.1021/bp060016e. [DOI] [PubMed] [Google Scholar]
- Tarraran L.; Mazzoli R. Alternative strategies for lignocellulose fermentation through lactic acid bacteria: the state of the art and perspectives. FEMS Microbiol Lett. 2018, 365, 365. 10.1093/femsle/fny126. [DOI] [PubMed] [Google Scholar]
- Adsul M.; Khire J.; Bastawde K.; Gokhale D. Production of lactic acid from cellobiose and cellotriose by Lactobacillus delbrueckii mutant Uc-3. Appl. Environ. Microbiol. 2007, 73, 5055–5057. 10.1128/AEM.00774-07. [DOI] [PMC free article] [PubMed] [Google Scholar]
- Nataf Y.; Yaron S.; Stahl F.; Lamed R.; Bayer E. A.; Scheper T. H.; Sonenshein A. L.; Shoham Y. Cellodextrin and laminaribiose ABC transporters in Clostridium thermocellum. J. Bacteriol. 2009, 191, 203–209. 10.1128/JB.01190-08. [DOI] [PMC free article] [PubMed] [Google Scholar]
- Zhang Y.-H. P.; Lynd L. R. Cellulose utilization by Clostridium thermocellum: bioenergetics and hydrolysis product assimilation. Proc. Natl. Acad. Sci. U. S. A. 2005, 102, 7321–7325. 10.1073/pnas.0408734102. [DOI] [PMC free article] [PubMed] [Google Scholar]
- Fosses A.; Maté M.; Franche N.; Liu N.; Denis Y.; Borne R.; de Philip P.; Fierobe H.-P.; Perret S. A seven-gene cluster in Ruminiclostridium cellulolyticum is essential for signalization, uptake and catabolism of the degradation products of cellulose hydrolysis. Biotechnol. Biofuels 2017, 10, 250. 10.1186/s13068-017-0933-7. [DOI] [PMC free article] [PubMed] [Google Scholar]
- Schlosser A.; Jantos J.; Hackmann K.; Schrempf H. Characterization of the binding protein-dependent cellobiose and cellotriose transport system of the cellulose degrader Streptomyces reticuli. Appl. Environ. Microbiol. 1999, 65, 2636–2643. 10.1128/AEM.65.6.2636-2643.1999. [DOI] [PMC free article] [PubMed] [Google Scholar]
- Spiridonov N. A.; Wilson D. B. Cloning and biochemical characterization of bglC, a β-glucosidase from the cellulolytic actinomycete Thermobifida fusca. Curr. Microbiol. 2001, 42, 295–301. 10.1007/s002840110220. [DOI] [PubMed] [Google Scholar]
- Barrangou R.; Azcarate-Peril M. A.; Duong T.; Conners S. B.; Kelly R. M.; Klaenhammer T. R. Global analysis of carbohydrate utilization by Lactobacillus acidophilus using cDNA microarrays. Proc. Natl. Acad. Sci. U. S. A. 2006, 103, 3816–3821. 10.1073/pnas.0511287103. [DOI] [PMC free article] [PubMed] [Google Scholar]
- Siezen R. J.; Starrenburg M. J. C.; Boekhorst J.; Renckens B.; Molenaar D.; van Hylckama Vlieg J. E. T. Genome-scale genotype-phenotype matching of two Lactococcus lactis isolates from plants identifies mechanisms of adaptation to the plant niche. Appl. Environ. Microbiol. 2008, 74, 424–436. 10.1128/AEM.01850-07. [DOI] [PMC free article] [PubMed] [Google Scholar]
- Gänzle M.; Follador R. Metabolism of oligosaccharides and starch in Lactobacilli: A review. Front. Microbiol. 2012, 3, 00340. 10.3389/fmicb.2012.00340. [DOI] [PMC free article] [PubMed] [Google Scholar]
- Zhang Y.-H. P.; Lynd L. R. Kinetics and relative importance of phosphorolytic and hydrolytic cleavage of cellodextrins and cellobiose in cell extracts of Clostridium thermocellum. Appl. Environ. Microbiol. 2004, 70, 1563–1569. 10.1128/AEM.70.3.1563-1569.2004. [DOI] [PMC free article] [PubMed] [Google Scholar]
- Barrangou R.; Briczinski E. P.; Traeger L. L.; Loquasto J. R.; Richards M.; Horvath P.; Coûté-Monvoisin A.-C.; Leyer G.; Rendulic S.; Steele J. L.; Broadbent J. R.; Oberg T.; Dudley E. G.; Schuster S.; Romero D. A.; Roberts R. F. Comparison of the complete genome sequences of Bifidobacterium animalis subsp. lactis DSM 10140 and Bl-04. J. Bacteriol. 2009, 191, 4144–4151. 10.1128/JB.00155-09. [DOI] [PMC free article] [PubMed] [Google Scholar]
Associated Data
This section collects any data citations, data availability statements, or supplementary materials included in this article.