

This study shows how RCAN1, a key protein in Down syndrome and Alzheimer’s disease, modulates CN function.
Abstract
Regulator of calcineurin 1 (RCAN1) is an endogenous inhibitor of the Ser/Thr phosphatase calcineurin (CN). It has been shown that excessive inhibition of CN is a critical factor for Down syndrome and Alzheimer’s disease. Here, we determined RCAN1’s mode of action. Using a combination of structural, biophysical, and biochemical studies, we show that RCAN1 inhibits CN via multiple routes: first, by blocking essential substrate recruitment sites and, second, by blocking the CN active site using two distinct mechanisms. We also show that phosphorylation either inhibits RCAN1-CN assembly or converts RCAN1 into a weak inhibitor, which can be reversed by CN via dephosphorylation. This highlights the interplay between posttranslational modifications in regulating CN activity. Last, this work advances our understanding of how active site inhibition of CN can be achieved in a highly specific manner. Together, these data provide the necessary road map for targeting multiple neurological disorders.
INTRODUCTION
Calcineurin (CN, PP2B, and PP3) is a Ca2+-dependent Ser/Thr phosphatase with critical functions in many physiological processes, including development, cardiac function, and the immune response (1, 2). Calcium-activated CN dephosphorylates many substrates, including the nuclear factor of activated T cell (NFAT) transcription factors (3). Once dephosphorylated, the NFATs translocate into the nucleus and initiate NFAT-regulated gene transcription. In 2006, Crabtree and co-workers (4) demonstrated that Nfatc2−/− and Nfatc4−/− knockout mice have facial characteristics similar to those observed in patients with Down syndrome (DS; also known as trisomy 21), suggesting that the disruption of NFAT signaling, potentially via CN, plays a central role in this disease. Consistent with this observation, mice with forebrain-specific deletions of CNB, a subunit of CN responsible for making CN activation sensitive to Ca2+, also exhibit defects in learning and memory, both established hallmarks of DS (5). Studies during the last two decades have revealed that deletions of CNB render CN incapable of forming the LxVP-binding pocket, which is essential for NFAT dephosphorylation and, in turn, prevents NFAT translocation to the nucleus.
Individuals with DS have three copies of chromosome 21, resulting in a 1.5× dosage of these genes. Studies of patients with incomplete trisomy 21 led to the identification of the Down syndrome critical region (DSCR), the chromosomal fragment of chromosome 21 that is hypothesized to contain the genes responsible for the major DS phenotypes. The protein product of one of these genes, DSCR1 (Adapt78, MCIP1, RCN1, and calcipressin; now known as RCAN1; Fig. 1A), was found to be an inhibitor of CN (6–8). Consistent with this, overexpression of both full-length and a C-terminal fragment (amino acids 115 to 197) of RCAN1 in calcium-stimulated human cells prevented NFAT translocation to the nucleus (6), suggesting that RCAN1 overexpression may contribute to DS by blocking NFAT signaling. Supporting this hypothesis, Northern blots showed that the levels of RCAN1 mRNA in DS brain tissue were significantly higher compared to tissue from non-DS patients (6). Together, these data suggest that RCAN1, via its ability to inhibit CN and in turn disrupt NFAT signaling, contributes to DS phenotypes.
Fig. 1. RCAN1 interacts extensively with CN.

(A) RCAN1 domain structure showing the N-terminal RRM domain (yellow, amino acids 6 to 82; PDB ID 1WEY), the LxVP motif (green, amino acids 96 to 99), the SPPASPP motif (cyan, amino acids 108 to 114), the PxIxIT motif (orange, amino acids 154 to 159), and the TxxP motif (purple, amino acids 186 to 189). Partially populated helices α1 and α2 [gray cylinders; see (D)] and the regions that remain flexible when bound to CN [dotted circles; flex1 and flex2; see (C)] are also indicated. Constructs used in this study are shown below, with mutations shown in red letters. Sequence alignment of multiple RCAN1 species (amino acids 89 to 197), with the residues corresponding to motifs highlighted; * indicates residues phosphorylated by active p38α. RCAN1 orthologs used in sequence alignment are described in Materials and Methods. RCAN1 residue numbers are labeled according to human RCAN1 isoform 2. (B) Cartoon diagram of calcineurin (CN), with CNA shown as a white surface, CNB shown as a gray surface, the PxIxIT motif–binding pocket shown in orange, the LxVP motif–binding pocket shown in green, and the location of the active site indicated. (C) Overlay of the 2D [1H,15N] HSQC spectra of 15N-labeled RCAN1 in the absence (black) and presence (red) of CN. Peaks that do not interact directly with CN are labeled. (D) Secondary-structure propensity data plotted against RCAN1 residue numbers. These data indicate regions with transient secondary structure (SSP > 0, α helix; SSP < 0, β strand). (E) Overlay of the 2D [1H,15N] HSQC spectra of 15N-labeled RCAN1 (black) and 15N-labeled RCAN1core (blue).
RCAN1 is also overexpressed in patients with Alzheimer’s disease (AD), where RCAN1 levels are ~3-fold higher than in nondiseased individuals (9, 10). DS and AD are linked diseases, as it is well established that many patients with DS who reach middle age (40s) suffer from early-onset AD (11–13). One of the hallmarks of AD is neurofibrillary tangles composed of hyperphosphorylated tau protein. Many Ser/Thr and Tyr phosphatases are critical for maintaining tau in a proper (healthy) phosphorylation state (14, 15). Because CN is highly enriched in the neuronal tissues, making up 1% of the total protein in brain, CN plays an especially critical role in the control of tau dephosphorylation (16). Consistent with this, overexpression of RCAN1 in mice increased tau phosphorylation (17). Thus, excess inhibition of CN due to increased levels of RCAN1 has profound consequences on the brain. However, despite extensive efforts (18–21), very little is known about how RCAN1 binds and regulates CN at a molecular level.
Recently, it was shown that CN (composed of subunits A and B, CNA and CNB, respectively; Fig. 1B) recruits regulators, inhibitors, and substrates using two short linear motifs (SLiMs), the PxIxIT and the LxVP motif (22, 23). These SLiMs are typically found in intrinsically disordered proteins/regions (IDPs/IDRs) and bind to the corresponding PxIxIT- and LxVP-binding pockets in CN. The PxIxIT motif binds the catalytic domain of CNA (22), whereas the LxVP motif binds to a hydrophobic cleft at the interface of the CNA and B subunits (23). While it has been known for more than a decade that RCAN1 contains a PxIxIT motif, a number of studies have suggested that additional motifs (21, 24, 25), both N- and C-terminal to the noncanonical PxIxIT motif, play a key role in RCAN function and CN activity (inhibition), including a TxxP motif, which we have recently shown is critical for CN active site substrate recruitment (26). In Nhe1, the TxxP motif binds CN in an identical manner to the previous determined autoinhibitory domain (AID), which blocks the CN active site (27). Upon an increase in [Ca2+], the AID dissociates from the catalytic site, allowing for phosphatase activity.
Here, using a combination of structural and biochemical methods, we determined how, at a molecular level, RCAN1 binds and inhibits CN. We found that RCAN1 interacts extensively with CN, at both the canonical PxIxIT- and LxVP-binding pockets but also beyond these regions, including the catalytic site. Further, we found that CN binding leads to a folding-upon-binding event, which creates a novel extended PxIxIT-type interaction that defines the central core of the RCAN1:CN interaction. We also found that in addition to physically blocking substrate binding by binding the PxIxIT and LxVP binding pockets, RCAN1 also inhibits CN activity directly by binding and blocking its active site via two mechanisms. Last, both the activity and the binding of RCAN1 to CN are regulated by phosphorylation, providing an example of how SLiM interactions are actively regulated by phosphorylation. Together, these data reveal how RCAN1 controls CN activity and, by extension, how RCAN1-mediated inhibition disrupts CN signaling, ultimately leading to hyperphosphorylation of CN substrates.
RESULTS
The CN interaction domain of RCAN1 is intrinsically disordered
RCAN1 is a two-domain protein with a structured N-terminal RNA-recognition motif (RRM) domain that binds mRNA (amino acids 1 to 88; Fig. 1A) and a C-terminal domain that is responsible for CN binding (amino acids 89 to 197, the RCAN1 CN-binding domain; hereafter referred to as RCAN1; Fig. 1A). The two-dimensional (2D) [1H,15N] heteronuclear single-quantum coherence (HSQC) spectrum of RCAN1 exhibits very little chemical-shift dispersion in the 1HN dimension, indicating that the CN-binding domain is an IDR (Fig. 1C). To gain structural insights, we used chemical shift analysis (CSI/SSP) to test for preferred secondary structure in RCAN1. Two regions with preferred α-helical secondary structure (helix α1, amino acids 129 to 137, ~40% populated; helix α2, amino acids 168 to 178, ~55% populated; Fig 1D) were identified. Consistently, these regions also have reduced fast time scale dynamics as determined using a 15N-{1H} nuclear Overhauser effect (15N-{1H}NOE) experiment (fig. S1A). Together, these data show that the CN-binding domain of RCAN1 is intrinsically disordered with two partially populated α-helices.
RCAN1 binds CN tightly, with a KD of ~10 nM [isothermal titration calorimetry (ITC); the thermogram is atypical, with two independent binding events that have differing enthalpy changes; fig. S1B]. Given the atypical ITC results, we used surface plasmon resonance (SPR) spectroscopy as a complementary approach, which reported a similar KD of ~1 nM (Table 1, table S1, and fig. S1B). As ITC does not report time-dependent events, the easiest interpretation for the atypical biphasic thermogram is two sequential processes that lead to CN binding, i.e., the first binding event is an RCAN1 rearrangement (i.e., possibly due to charge:charge interactions within RCAN1) and, upon successful rearrangement, the second binding event reports the interaction with CN, which we used to extract KD values. To identify the RCAN1 residues that bind directly to CN, we used nuclear magnetic resonance (NMR) spectroscopy. We formed the RCAN1:CN complex, in which only RCAN1 was 15N-labeled. Because free RCAN1 lacks any significant long-range intramolecular interactions, the CN-bound and CN-unbound residues of RCAN1 will have significantly different NMR relaxation properties. As a consequence, RCAN1 residues that bind directly to CN will be invisible in a 2D [1H,15N] HSQC spectrum, while unbound RCAN1 residues will retain their original positions in the 2D [1H,15N] HSQC spectrum, allowing all nonbinding residues to be identified (Fig. 1C). Using this well-established procedure, we found that most RCAN1 residues interact directly with CN (amino acids 89 to 110, 128 to 164, and 180 to 197), many more than expected on the basis of previously described SLiM-based interactions with CN. However, there are also RCAN1 regions that remain flexible and unbound, including amino acids 111 to 124 (flex1) and 168 to 178 (flex2) (Fig. 1, A and C); the latter flexible region, flex2, overlaps with helix α2, demonstrating that this helix does not bind CN.
Table 1. ITC measurements of RCAN1 variants with CN.
| RCAN1 variant | Titrant | KD (nM) | ΔH (kcal/mol) | TΔS (kcal/mol) |
| RCAN189–197 | ||||
| RCAN189–197* | CN391 | 16 ± 5 | −30.7 ± 0.8 | −20.1 ± 0.9 |
| p-RCAN189–197*,† | CN391 | 429 ± 85 | −32.4 ± 1.6 | −23.7 ± 1.7 |
| RCAN189–197 T153A* | CN391 | 73 ± 3 | −28.8 ± 0.6 | −19.1 ± 0.6 |
| p-RCAN189–197 T153A*,† | CN391 | 77 ± 1 | −21.0 ± 1.8 | −11.3 ± 1.8 |
| RCAN189–197 LxVPdead‡ | CN391 | 16 ± 1 | −20.7 ± 0.3 | −10.2 ± 0.3 |
| RCAN189–197 PxlxlTdead‡ | CN391 | 2308 ± 375 | −24.5 ± 4.0 | −16.8 ± 4.1 |
| RCAN189–197 TxxPdead* | CN391 | 46 ± 11 | −25.6 ± 0.4 | −15.6 ± 0.5 |
| RCAN1core | ||||
| RCAN1core WT* | CN391 | 161 ± 7 | −18.8 ± 0.4 | −9.5 ± 0.4 |
| RCAN1core PSVVIT* | CN391 | 42 ± 4 | −18.9 ± 0.3 | −8.9 ± 0.9 |
*Measurements were carried out using an Affinity-ITC microcalorimeter.
†RCAN1 proteins that are phosphorylated (p-).
‡Measurements were carried out using a VP-ITC microcalorimeter.
Residues 128 to 164 constitute the core CN-binding domain of RCAN1
The RCAN1 regions that bind directly to CN include the putative LxVP (96LAPP99), PxIxIT (154PSVVVH159), and TxxP (186TRRP189) motifs (Fig. 1A). To determine which motifs contribute to CN binding, we generated three RCAN1 variants in which the canonical residues of the putative motifs were mutated to alanines (RCAN1LxVPdead, HLAPP➔AAAAA; RCAN1PxlxlTdead, PSVVVH➔ASAVAA; RCAN1TxxPdead TRRP➔AAAA) and measured the affinity of the variants for CN using either ITC or SPR. The data showed that the LxVP motif only minimally contributes to CN binding, as the KD of the RCAN1LxVPdead variant for CN is essentially unchanged. In contrast, both the TxxP and especially the PxIxIT motifs contribute significantly to binding, as the KD values of the corresponding “dead” variants increase (RCAN1TxxPdead variant, ~3-fold increase in KD; RCAN1PxlxlTdead, ~145-fold increase in KD; fig. S1B, Table 1, and table S1).
Together, the NMR and ITC data suggest that residues 128 to 164 constitute the core CN-binding domain of RCAN1, as this region is between the two flexible domains that do not bind to CN and also includes the tightly binding RCAN1 PxIxIT motif. ITC shows that RCAN128–164 binds strongly to CN, albeit more weakly than RCAN189–197 (Table 1 and fig. S1B). To facilitate our structural NMR studies (note that all other studies are performed with wt-RCAN1), we converted the RCAN1 PxIxIT motif to a strong PxIxIT sequence [~4-fold change; PSVVVH ➔ PSVVIT (22); hereafter referred to as RCAN1core; Table 1 and fig. S1B]. To confirm that RCAN1core behaves identically to the same domain within the context of the full RCAN1 CN-binding domain (RCAN1), we used NMR spectroscopy. First, an overlay of the 2D [1H,15N] HSQC spectra of free RCAN1 with free RCAN1core revealed that no chemical shift perturbations (CSPs) are observed for corresponding peaks, beyond those expected at the RCAN1core N and C termini (Fig. 1E and fig. S1C). This demonstrates that the free state of RCAN1core is identical to that present within the context of the full CN-binding domain. Second, a CSI/SSP analysis performed after completing the sequence-specific backbone assignment of RCAN1core showed that helix 1 is ~45% populated (Fig. 2A). This is identical to what was observed for the same helix in RCAN1 (Fig. 1D). These data demonstrate that the residues that define the RCAN1core behave identically in both constructs (RCAN1core and RCAN1).
Fig. 2. RCAN1core domain, amino acids 128 to 164, folds-upon-binding CN.
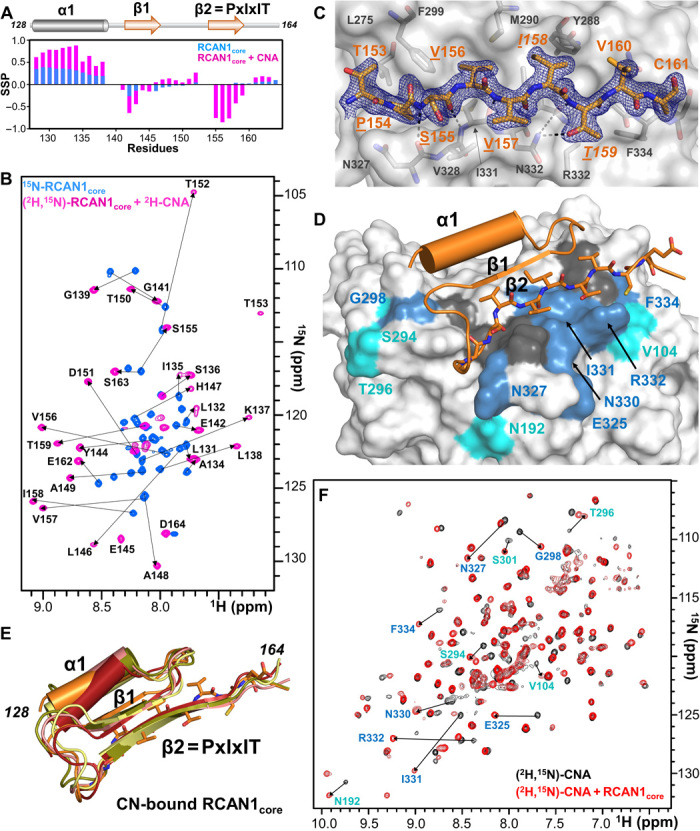
(A) Secondary-structure propensity data plotted against RCAN1core residue numbers (SSP > 0, α helix; SSP < 0, β strand). RCAN1core, blue; CNA-bound RCAN1core, pink. (B) Overlay of the 2D [1H,15N] TROSY spectrum of free 15N-labeled RCAN1core (blue) with the 2D [1H,15N] TROSY spectrum of (2H,15N)-labeled RCAN1core bound to (2H)-labeled CNA (pink). Arrows indicate the peak shifts in RCAN1core upon binding CN. (C) 2mFo − DFc electron density map (blue) contoured at 1σ corresponding to the RCAN1core PxIxIT motif (orange sticks; PxIxIT motif residues underlined) bound to CN (gray). CN residues that form the PxIxIT motif hydrophobic docking pocket shown as sticks and labeled. (D) Structure of RCAN1core:CNA complex obtained using NMR and x-ray data corefinement. RCAN1core, orange (PxIxIT motif shown as sticks; strand β1, arrow, helix α1, cylinder); CNA, white surface with the CNA residues that experience CSPs upon RCAN1core binding shown in blue (>2σ SD) or light blue (>1σ SD); dark gray surface corresponds to unassigned residues. Residues that experience CSPs are also labeled. (E) Overlay of the five lowest-energy corefined structures. (F) Overlay of the 2D [1H,15N] TROSY spectra of (2H,15N)-labeled CNA in the absence (black) and presence (red) of the RCAN1core. Peaks that shift in the presence of the RCAN1core are shown with arrows and labels. Label colors correspond to chemical shift perturbation deviation magnitudes [see (D)].
The RCAN1core domain undergoes a folding-upon-binding transition upon CN binding
The interaction of the RCAN1core domain with the CNA was then examined using NMR spectroscopy. In this experiment, both RCAN1core and CNA are isotopically labeled (2H,15N-labeled RCAN1core; 2H-labeled CNA), allowing all peaks to be detected. The data showed that RCAN1core folds upon CNA binding, as the dispersion of the peaks in the 1HN dimension widened significantly, owing to the formation of new hydrogen bonds in novel secondary-structure elements (Fig. 2B). Repeating this experiment using RCAN1 and CN (CNA/B) showed an identical folding pattern (fig. S2A), confirming that the RCAN1core binds identically to both CN and CNA and that the RCAN1core domain folds-upon-binding in a manner identical to that of RCAN1 (fig. S2A). To understand this conformational change in molecular detail, we completed the CNA-bound RCAN1core sequence-specific backbone assignment (2H,13C,15N-labeled RCAN1core, 2H-labeled CNA; 47-kDa complex; Fig. 2B). The CSI/SSP analysis showed that when RCAN1core is bound to CNA, most of the partially populated helix α1 becomes 100% populated, with the final turn being slightly lower populated. Further, two new β strands are formed, β1 (amino acids 142 to 145) and β2 (amino acids 155 to 159; Fig. 2A).
To determine the RCAN1core:CNA 3D structure, we first used x-ray crystallography. The structure of the RCAN1core:CNA complex was determined by molecular replacement and refined to 1.85 Å resolution (table S2). Strong difference electron density was observed for the PxIxIT motif and adjacent residues, allowing RCAN1 residues 153TPSVVITVC161 to be readily modeled (Fig. 2C). The RCAN1 PxlxlT motif binds CN in an extended β strand conformation, burying ~495 Å2 of solvent accessible surface area. As observed in other CN:PxIxIT complexes (fig. S2B), the RCAN1 PxIxIT motif β strand hydrogen bonds with CNA β strand β14 in a parallel arrangement, extending one of CNA’s two central β sheets (Fig. 2A and fig. S2C). In addition to the electron density corresponding to the PxIxIT sequence, weak difference density corresponding to a short β strand was observed just above the PxIxIT motif β strand, further extending the CNA central β sheet by one more strand (fig. S2D). The presence of a second β strand is consistent with the CSI/SSP NMR data that showed two β strands form when RCAN1core binds CNA (Fig. 2A). Despite extensive efforts, no electron density was identified for RCAN1 residues 128 to 140, likely due to the fact that the PxIxIT binding pocket is located at a crystal contact and, as a consequence, displaced these residues in the crystal (fig. S2E).
The structure of the RCAN1core:CN complex
To determine the structure of the RCAN1core:CNA complex, we used a hybrid structural biology approach, integrating the NMR and crystallographic data. First, we determined the solution structure of RCAN1core bound to CNA using chemical shift–based dihedral angle restraints and NOE distance restraints, the latter of which were derived from 13C-ILV-methyl-methyl resolved [1H,1H] NOESY (NOE spectroscopy), 13C-methyl-ILV-15N resolved [1H,1H] NOESY, and 15N-resolved [1H,1H] NOESY spectra. A total of 84 NOE restraints were detected and used for structure determination (table S4). Next, we developed a corefinement protocol that used both the NMR-derived (NOE) and crystallographic-derived (H-bond) restraints with established protein stereochemical restraints to refine the structure of the CNA:RCAN1core complex (Fig. 2, D and E). Atoms allowed to change during corefinement included the atoms from all RCAN1core residues and CNA residues belonging to CNA β strand 14. The ensemble of RCAN1core domains adopted a compact conformation defined by the secondary structures of a single α helix (α1, 129YDLLYAISKL138), two β strands (β1, 142EKYE145; β2, PxIxIT motif, 154PSVVIT159), and two turns. The β strands bind one another in an antiparallel manner, with the helical axis of the α helix aligning parallel and adjacent to both strands (because of the limited number of NOE restraints, the α helix adopted a small range of orientations relative to the two-stranded β sheet). The compact tertiary structure is stabilized by a central hydrophobic core defined by RCAN1 residues Leu131, Ile135, Leu138, Val156, and Ile158. The RCAN1core is anchored to CNA via its PxIxIT motif. This ordering of RCAN1core PxIxIT residues (including Val156 and Ile158), together with the CNA PxIxIT-binding pocket residues (especially Met290 and Ile331), provides a hydrophobic platform that enhances the stability of the folded conformation of the RCAN1core. The observation that the entire RCAN1core folds-upon-binding CNA has never been observed for any other CN-regulator.
To confirm the experimental accuracy of the NMR and crystallographically corefined structure, we performed an additional NMR experiment. Namely, we formed the RCAN1core:CNA complex using 2H,13C,15N-labeled CNA and unlabeled RCAN1core and completed the sequence-specific backbone assignment of CNA in its RCAN1core-bound conformation of most detectable NH cross peaks (Fig. 2F). Because of incomplete H/D back exchange (as commonly observed for proteins expressed in D2O), the backbone assignment of CNA is ~30% [this percentage is about the same as the published NMR backbone assignment of free CNA (28)]. Overlaying the 2D [1H,15N] TROSY (Transverse relaxation optimized spectroscopy) spectra of 2H,15N-labeled CNA in the presence and absence of unlabeled RCAN1core showed, as expected, that many CSPs belong to the residues corresponding to the CN PxIxIT-binding pocket (residues Val104, Asn192, Glu325, Asn327, Asn330-Arg332, and Phe334). However, CSPs were also observed beyond the expected PxIxIT CN–binding pocket including residues Ser294, Thr296, Gly298, and Ser301, in a pocket in which the N terminus of the RCAN1core engages CNA, confirming the structure of the RCAN1core:CN complex (Fig. 2, D to F).
The RCAN1 TxxP motif is critical for CN inhibition
Previous studies have shown that CN activity can be inhibited by distinct mechanisms. First, CN can be competitively inhibited by binding and blocking the active site (27); this is how the CN AID inhibits CN before Ca2+ activation. Second, CN can be inhibited by blocking substrate binding; this is how the viral protein inhibitor A238L inhibits CN, as it binds CN and blocks both the PxIxIT- and LxVP-binding pockets (23). To understand how RCAN1 regulates CN, we measured CN activity using para-nitrophenylphosphate (pNPP; a small substrate mimic that reports active site inhibition) in the presence and absence of RCAN1 and a series of RCAN1 motif variants. The data show that RCAN1 potently inhibits CN activity against pNPP (Fig. 3, A and B, and table S3). Mutating the primary SLiM motifs (LxVP; PxIxIT; Figs. 1A and 3B) in RCAN1 alters CN inhibition in a manner consistent with their role in CN binding. Namely, the loss of the LxVP motif (RCAN1LxVPdead), which contributes very little to CN binding, has no effect on the RCAN1-mediated inhibition of CN phosphatase activity against pNPP. In contrast, the loss of the PxIxIT motif (RCAN1PxIxITdead), which is essential for CN binding, significantly reduced the RCAN1-mediated inhibition of CN phosphatase activity (Fig. 3, A and B). Together, these data show that although RCAN1 binds to both CN-specific SLiM-binding pockets (LxVP and PxIxIT), it must also bind and block the CN active site, and this interaction requires binding via the PxIxIT motif.
Fig. 3. RCAN1 TxxP and SPP motifs inhibit CN by binding and blocking the active site.
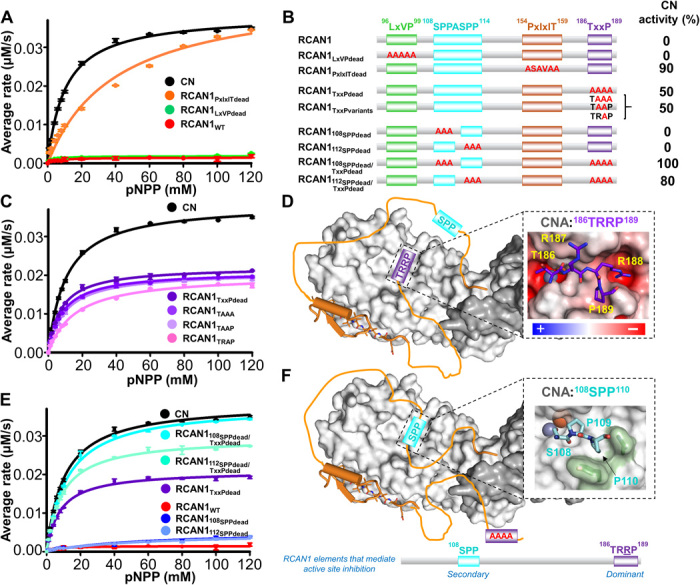
(A) Enzymatic activity of CN in the absence (black) and presence of RCAN1 (red) and its SLiM-binding motif variants (PxIxITdead, orange; LxVPdead, green); pNPP assays; ±SE, n = 3. (B) RCAN1 domain diagram illustrating the RCAN1 mutants tested with the corresponding CN activity (relative to free CN). (C) Same as (A) but with RCAN1 TxxP variants. (D) Cartoon illustrating how the TxxP motif engages the CN active site. Inset: Model of the RCAN1 TxxP (TRRP; purple) motif bound to CN based on the structure of the CNA AID domain (27); CN is shown as an electrostatic potential energy surface. (E) Same as (A) but with RCAN1 SSPASSP and TxxP variants. (F) Same as (D), illustrating CN inhibition in the absence of a functional TxxP motif. Inset: Model of the RCAN1 108SPP (cyan) motif bound to CN based on the structure of the CNA AID domain.
Two additional motifs have previously been suggested to facilitate RCAN1-mediated inhibition of CN: the 108SPPASPP114 motif, which resembles NFAT substrate sequences (25), and the 186TxxP189 motif, which we recently showed is critical for active site substrate recruitment (26). To determine whether the RCAN1 TxxP motif contributes to the RCAN1-mediated inhibition of CN, we measured CN activity when bound to the RCAN1TxxPdead variant (Fig. 3C). Although mutating this motif has only a minor effect on CN binding (threefold), it strongly reduced the RCAN1-mediated inhibition of pNPP dephosphorylation (29), resulting in a 50% increase in CN activity (Fig. 3, B and C); this suggests that the TxxP motif interacts directly with the catalytic site. Using the crystal structure of CN bound to the AID as a model for TxxP binding (AID residues 481ERMP484; Glu481 carboxyl binds the CN active site metals), it became evident that the RCAN1 i+2 arginine (TRRP) is perfectly poised to bind a negatively charged pocket formed by the side chains of CN residues Cys153 and Glu220 and the peptide carboxyls from residues Asn150 and Pro221 (Fig. 3D, inset). To test whether Arg188 is important for RCAN1-mediated inhibition of CN, we generated a TxxP motif variant in which only this residue is mutated to alanine, RCAN1TRAP (Fig. 3, B and C). This single amino acid change results in a 50% reduction in RCAN1-mediated inhibition of CN. Inclusion of additional mutations in this motif (TAAP; TAAA) had only minor effects (Fig. 3, B and C). Together, the data show that the TxxP motif is critical for the RCAN1-mediated inhibition of CN at the active site, with TxxP residue Arg188 playing a key role in TxxP motif binding (Fig. 3D).
Although the TxxP motif is critical for the RCAN1-mediated inhibition of CN, the RCAN1TxxPdead variant does not allow CN activity to return to RCAN1-free levels, demonstrating that additional elements of RCAN1 also contribute to CN inhibition. Previous studies suggested that the RCAN1 108SPPASPP114 motif may function as an NFAT-like pseudosubstrate inhibitor of CN activity (25). To test this, we again used mutagenesis coupled with pNPP activity assays (Fig. 3, B to E). First, mutation of either the 108SPP or 112SPP motif to AAA did not alter RCAN1-mediated inhibition of CN. We hypothesized that this may be due to the presence of the 186TRRP189 motif, which may play a dominant role in CN inhibition. Thus, we generated the same mutants in the RCAN1TxxPdead variant, i.e., 108SPPdead/TxxPdead and 112SPPdead/TxxPdead. The data show that in the absence of a functional TxxP motif, mutating the 112SPP motif led to a further ~20% reduction in RCAN1-mediated CN inhibition. Mutating the 108SPP motif completely abolished the RCAN1-mediated inhibition of CN, rendering CN fully active. These data demonstrate that both the RCAN1 TxxP motif and the RCAN1 108SPP pseudosubstrate sequence are responsible for the RCAN1-mediated inhibition at the CN active site (Fig. 3, D to F). To confirm these results, we formed the 2H,15N-RCAN1TXXPdead:2H-CN complex and recorded a 2D [1H,15N] TROSY spectrum (fig. S3). The NMR data showed that upon deletion of the TxxP motif in RCAN1, residues that are part of or surrounding the 108SPPASPP114 motif are missing or shifted (e.g., Ser112, Gly116, Lys118, and Thr124), directly showing that these residues are now in a different chemical environment, i.e., binding the CN active site (as indicated by the activity assays).
RCAN1 phosphorylation regulates CN binding
RCAN1 has eight serine and six threonine residues (Fig. 1A). Of these, Ser93, Ser94, Ser108, Ser112, Thr124, Ser136, Thr153, Ser163, Thr186, and Thr192 have been experimentally identified to be phosphorylated in vivo (16, 30, 31), suggesting that they may be important for regulating RCAN1 binding to and/or inhibition of CN. Consistent with this, a subset of these residues are part of and/or adjacent to known RCAN1 motifs (Ser94, LxVP motif; Ser108/Ser112, SPPASPP pseudosubstrate motif; Thr153/Ser163, PxIxIT motif; Thr186/Thr192, TxxP motif; Fig. 1A). To determine how phosphorylation of RCAN1 alters its ability to bind and inhibit CN, we incubated 15N-labeled RCAN1 with MKK6-activated p38α (pp38) (32), a proline-directed kinase that has been shown to phosphorylate RCAN1 (31, 33). An overlay of the nonphosphorylated and phosphorylated 2D [1H,15N] HSQC spectra reveals large CSPs for several peaks, indicative of phosphorylation (fig. S4A). After completing the sequence-specific backbone assignment of p38-phosphorylated RCAN1 (p-RCAN1), we determined that Ser108, Ser112, Thr124, Thr153, and Thr192 are phosphorylated (pS108, pS112, pT124, pT153, and pT192; pT152 also becomes partially phosphorylated, although much more slowly, suggesting that it is nonspecific). CSI/SSP analysis shows that p-RCAN1 maintains the same secondary-structure preferences as nonphosphorylated RCAN1 (RCAN1), and thus, p-RCAN1 is identical to RCAN1 in solution (fig. S4B). Despite this, p-RCAN1 binds CN ~30-fold more weakly than RCAN1 (ITC; fig. S1B and Table 1), demonstrating that RCAN1 phosphorylation negatively affects CN binding.
We reasoned that the reduction in affinity was due to the phosphorylation of Thr153, which is in a loop connecting RCAN1core β strands β1 and β2 and immediately N-terminal to the RCAN1 PxIxIT motif, which is essential for CN binding (Figs. 1A and 2D). To test this, we generated the RCAN1T153A variant and phosphorylated it using pp38α. The same residues, with the exception of Thr153 (now T153A), were phosphorylated; further, no nonspecific phosphorylation of Thr152 was observed (Fig. 4A). However, in contrast to p-RCAN1, the p-RCAN1T153A variant binds CN with the same affinity as nonphosphorylated RCAN1T153A (fig. S1B and Table 1), both of which are nearly identical to RCAN1. Together, these data show that phosphorylation of Thr153 in RCAN1 is a key mechanism regulating RCAN1:CN complex formation and, in turn, the ability of RCAN1 to inhibit CN.
Fig. 4. RCAN1 phosphorylation regulates CN binding and inhibition.
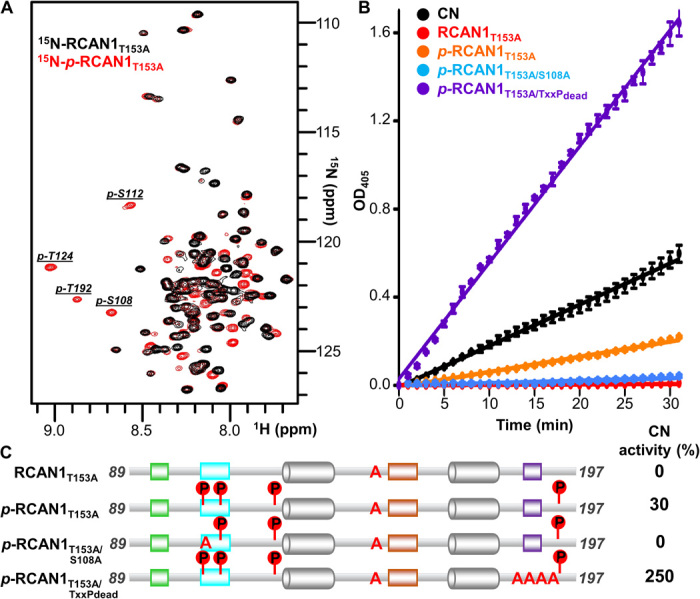
(A) Overlay of the 2D [1H,15N] HSQC spectra of free 15N-labeled RCAN1T153A with 15N-labeled p-RCAN1T153A. Peaks corresponding to phosphorylated residues in p-RCAN1T153A are labeled. (B) Progress curves monitoring the dephosphorylation of pNPP for the indicated p-RCAN1T153A:CN complexes. (C) Cartoon diagrams of the RCAN1 variants tested in (B), with the indicated phosphorylated residues and resulting CN activity at the 30-min time point relative to CN alone.
RCAN1 phosphorylation and CN inhibition
Next, we investigated how RCAN1 phosphorylation affects the ability of RCAN1 to inhibit CN. To exclude any effects from a change in RCAN1:CN binding affinity, RCAN1T153A was used throughout these studies. pNPP was used as a model substrate and its dephosphorylation was monitored over time. As expected, RCAN1T153A completely inhibited CN activity (Fig. 4, B and C). In contrast, p-RCAN1T153A showed a ~30% reduction in inhibition, demonstrating that phosphorylation of either Ser108, Ser112, Thr124, or Thr192 negatively affects the ability of RCAN1 to inhibit CN (Fig. 4, B and C). Since our results showed that the 108SPPASPP114 motif, especially 108SPP, plays a key role in the RCAN1-mediated inhibition of CN, we reasoned that the loss of inhibition was due to the phosphorylation of Ser108. To test this, we repeated the activity assay using a variant of RCAN1 in which both residues were mutated to alanine and subsequently phosphorylated by pp38α (p-RCAN1T153A/S108A). Preventing Ser108 phosphorylation restored the ability of RCAN1 to inhibit CN, demonstrating that phosphorylated pS108 relieves 108SPP-mediated inhibition (Fig. 4, B and C).
Last, we tested the importance of the TxxP motif in p-RCAN1-mediated inhibition. Thus, we measured the activity of CN bound to p-RCAN1T153A in the TxxPdead background, i.e., p-RCAN1T153A/TxxPdead. The data show that this variant completely lost its ability to inhibit CN. Moreover, the CN activity increased threefold in the presence of p-RCAN1T153A/TxxPdead (Fig. 4, B and C). This result is consistent with previous studies that have shown that the activity of CN increases in the presence PxIxIT- and LxVP-containing CN-specific regulators, due to stabilization of the enzyme (23). Together, these data not only confirmed the key role of the TxxP motif in the RCAN1-mediated inhibition of CN independent of the RCAN1 phosphorylation state but also revealed that phosphorylation of either Thr153 or Ser108 reduces RCAN1-mediated inhibition either by weakening the affinity of RCAN1 for CN (pT153) or by preventing the SPPASPP pseudosubstrate motif from engaging and blocking the catalytic site (pS108).
RCAN1 is also a CN substrate
Next, we used NMR spectroscopy to determine whether p-RCAN1 is also a CN substrate. Because the affinity of CN for p-RCAN1, but not p-RCAN1T153A, is considerably weaker than the corresponding nonphosphorylated variant, we again used the RCAN1T153A variant for these experiments. The data show that all p-RCAN1 residues phosphorylated by pp38α are dephosphorylated by CN, with pS108 and pT192 being the residues most rapidly dephosphorylated (Fig. 5A; pS112 is also dephosphorylated, but the dephosphorylation does not go to completion).
Fig. 5. RCAN1 LxVP motif is required for dephosphorylation of the pseudosubstrate SPPASPP motif.

(A) Dephosphorylation of p-RCAN1T153A residues pS108, pS112, pT124, and pT192. (B) Dephosphorylation of p-RCAN1T153A/LxVPdead residues pS108, pS112, pT124, and pT192. (C) Dephosphorylation of p-RCAN1T153A/S108A residues pS112, pT124, and pT192. (D) Dephosphorylation of p-RCAN1T153A/TxxPdead residues pS108, pS112, pT124, and pT192.
The 108SPPASPP114 motif is C-terminal to the RCAN1 96LxVP99 motif. Our NMR, ITC, and SPR data show that while the RCAN1 LxVP motif binds CN, it does not contribute significantly to its affinity. This weaker affinity of the LxVP versus PxIxIT motif in RCAN1 has also been observed in other CN substrates, which has led to the hypothesis that LxVP motifs facilitate CN-mediated dephosphorylation of specific substrate residues. To test this hypothesis for RCAN1, we repeated the NMR-based dephosphorylation experiments using an RCAN1 variant in which the LxVP motif was nonfunctional (RCAN1LxVPdead) (Fig. 5B). The data show that the dephosphorylation rates for the phosphorylated residues either slowed (pT124 and pT192) or went to zero (pS108 and pS112). Thus, the residue that is most rapidly dephosphorylated in wild-type (WT) p-RCAN1, pS108, is unable to be dephosphorylated in the absence of the LxVP motif (p-RCAN1LxVPdead). These data strongly support the hypothesis that, in at least a subset of CN substrates, the LxVP functions to optimally position phosphosites for rapid dephosphorylation by CN. Inhibiting Ser108 phosphorylation using p-RCAN1T153A/108SPPdead also completely prevented the partial dephosphorylation of pS112, demonstrating the inability of this residue to effectively engage the active site in the absence of the 108SPP110 motif (Fig. 5C). Last, we also measured RCAN1 dephosphorylation using a variant with an inactive TxxP motif: pRCAN1T153A/TxxPdead. As expected, the dephosphorylation rates increased markedly, demonstrating that the TxxP motif functions limit access to the active site, fully consistent with our molecular and inhibition data (Fig. 5D).
DISCUSSION
Over 20 years ago, RCAN1 was found to be a potent, endogenous inhibitor of CN; however, how RCAN1 interacted with and regulated the activity of CN has remained elusive. This lack of mechanistic knowledge has limited our ability to effectively combat RCAN1-mediated inhibition to enhance NFAT dephosphorylation in syndromes and diseases associated with RCAN1 up-regulation, including DS and AD. Here, we show that the RCAN1 CN-interaction domain, which is intrinsically disordered, forms a tight complex with CN via its multiple SLiMs, including the LxVP, PxIxIT, and TxxP motifs (Fig. 6A). Unexpectedly, we found that the RCAN1 PxlxlT interaction is distinct from canonical PxlxlT:CN interactions, as PxIxIT motif binding to CN causes its 30 N-terminal residues to undergo a folding-upon-binding event. This results in the formation of a stable, tertiary domain stabilized by an extensive network of hydrophobic residues from both CN and RCAN1. This observation is important for multiple reasons. First, this unique example highlights the emerging diversity of SLiM-based interactions, demonstrating that even “established” interactions like that of the PxIxIT with CN can be augmented and their interaction strengths can be modulated by additional protein stabilization interactions. It will be interesting to see whether similar extended interactions exist for other SLiMs. Second, detecting this folding-upon-binding event and determining the folded structure required a hybrid approach that integrated NMR and crystallographic data, highlighting the importance of using both methods, but especially NMR spectroscopy, for the study of IDP:protein interactions.
Fig. 6. RCAN1 is both a potent inhibitor of CN and a substrate.
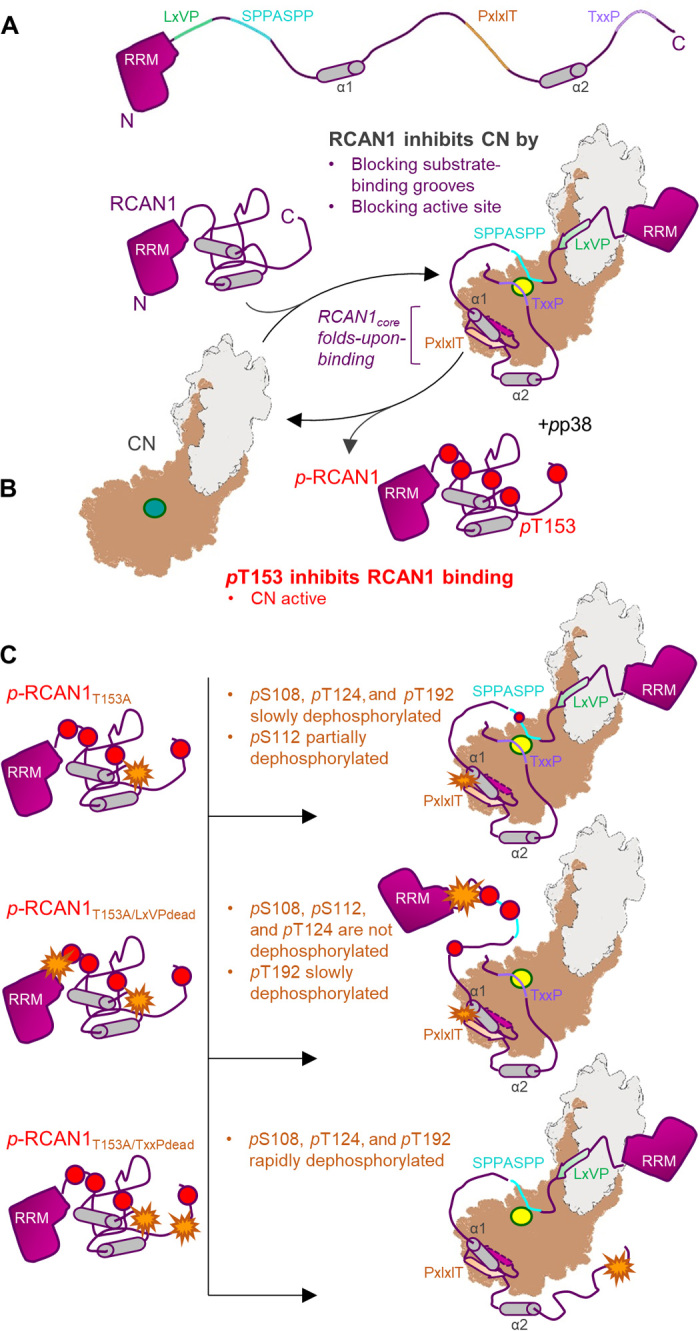
(A) RCAN1 is a potent CN inhibitor. RCAN1 (magenta, with key sequence and structural features indicated) binds and inhibits CN (gray/beige; active site in yellow) via two mechanisms. First, RCAN1 blocks CN-specific substrate LxVP and PxIxIT interaction grooves by binding these pockets using its LxVP and especially its PxIxIT motifs. This prevents canonical CN substrates, like the NFATs, from binding CN. Second, RCAN1 directly blocks the CN active site via its TxxP motif and, to a lesser extent, its SPPASSP motif. This further reduces CN activity against its endogenous substrates. The RCAN1core folds upon binding CN. (B) Phosphorylation of RCAN1 T153 (pT153) inhibits CN binding. Active p38 phosphorylates RCAN1 on pS108, pS112, pT124, pT153, and pT192. Phosphorylation of RCAN1 T153 (pT153), which is immediately N-terminal to the PxIxIT motif, lowers the affinity of RCAN1 for CN, leading to dissociation of the complex and increased CN activity. (C) Phosphorylated RCAN1 (pRCAN1) is weakly dephosphorylated by CN. In the absence of phosphorylation at T153 (pRCAN1T153A; T153A represented as an orange start), pRCAN1 is able to bind CN with strong affinity. This results in the slow dephosphorylation of pS108, pT124, and pT192, with pS112 becoming partially dephosphorylated (top). However, with the exception of pT192, these dephosphorylation events require the presence of the nearby LxVP motif. That is because, in the LxVPdead mutant (T153A and LxVPdead represented as orange stars), pS108, pS112, and pT124 remain phosphorylated, even after 20 hours (middle). Last, if the inhibitory TxxP sequence is inactivated (TxxPdead; T153A and TxxPdead represented as orange stars), the ability of CN to dephosphorylate pRCAN1 is substantially enhanced, with dephosphorylation rates increasing ~10-fold (bottom).
We also found that this novel RCAN1 interaction domain is the target of posttranslational modifications, namely, phosphorylation. Thr153 is a proline-directed kinase phosphorylation site that is readily phosphorylated by activated p38. As we show, phosphorylation of Thr153 reduces the binding affinity of RCAN1 for CN by more than 30-fold, which greatly attenuates its ability to bind, and, in turn, inhibit CN. Others have reported that phosphorylation of a nearby RCAN1 residue, Ser136, also transforms RCAN1 from an inhibitor to an “activator,” which enhances CN-NFAT signaling via NFAT translocation to the nucleus (34). Our new structural data show that Ser136 is located at the center of the newly formed PxIxIT domain, strongly suggesting that phosphorylation of Ser136 also destabilizes the RCAN1:CN interaction in a manner similar to that observed for Thr153. Together, these data show how phosphorylation functions as a molecular switch to convert RCAN1 from a potent to a weak inhibitor (sometimes called activator) of CN.
Our data reveal why RCAN1 is such a potent inhibitor of CN. Namely, it uses a combination of distinct yet complementary inhibitory mechanisms. First, RCAN1 binds to and blocks the PxIxIT and LxVP substrate-binding sites. This is the same mechanism used by the potent swine flu viral inhibitor A238L (23) and the blockbuster immunosuppressant drugs FK-506/cyclosporin-A (27, 35); that is, RCAN1 sterically occludes other substrates from binding the PxIxIT and LxVP substrate-binding pockets, which, in turn, prevents them from being dephosphorylated. The efficacy of FK-506/cyclosporin-A in preventing CN-mediated NFAT dephosphorylation demonstrates the effectiveness of this inhibitory strategy (36). However, RCAN1 also uses a second mechanism to inhibit CN activity. Namely, it binds and blocks the active site directly. Recently, we showed that S/TxxP motif substrate phosphosites are directly recruited to the CN active site (26). It is exactly such a motif, TRRP in RCAN1, which binds and blocks the CN active site, inhibiting its ability to dephosphorylate both small substrate mimetics (pNPP) and protein substrates (pRCAN1). In particular, we showed that the “RP” residues in TRRP are key for the local interaction at the active site and thus the potent inhibition of CN. Our data also showed that RCAN1 engages the active site using a second motif, one that was originally proposed to mimic known dephosphorylation sites in NFAT, SPPASPP (108SPPA112SPP). Thus, in addition to binding and sterically blocking known CN substrate interaction motifs, RCAN1 also exploits two distinct pseudosubstrate motifs to bind and inhibit the CN active site directly, demonstrating why RCAN1 potently inhibits CN activity.
What can we learn from these mechanisms of CN binding and inhibition by RCAN1 for CN inhibition and substrate selection? First, diffusion-controlled small-molecule dephosphorylation (e.g., for pNPP) and protein substrate dephosphorylation are different because the latter has the advantage of tethering via the CN-specific substrate interaction motifs (PxIxIT and LxVP). This tethering markedly increases the local substrate (phosphosite) concentration, which, in turn, enhances its dephosphorylation. This is why pNPP dephosphorylation by CN is completely inhibited by RCAN1, while substrate-like engagements, e.g., by p-RCAN1, leads to dephosphorylation, albeit exceedingly slowly (as we show, a functional TxxP motif greatly slows CN-mediated dephosphorylation of p-RCAN1). Furthermore, we show that for effective substrate dephosphorylation, the LxVP motif is critical, as, without it, the phosphosites immediately C-terminal to the LxVP motif are no longer dephosphorylated. Recently, we showed that the LxVP binding affinity for CN strictly depends on its on-rate (kon), i.e., how accessible the LxVP motif is in the ensemble of structures formed by RCAN1 in solution (37). Despite the fact that the RCAN1 LxVP site (LAPP) engages CN only very weakly, these data show that the LxVP is still essential for the specific and efficient dephosphorylation of 108SPPA112SPP, with a preference for 108SPP (the preference suggests that a PPA sequence N-terminal to a dephosphorylation site is unfavorable for dephosphorylation by CN). Together, these results reveal how RCAN1 inhibits CN and how this inhibition is regulated by phosphorylation. The mode of active site engagement is likely mirrored by CN substrates and thus this work also provides molecular insights into substrate engagement with the CN active site.
Last, these data also provide the essential molecular details needed to develop therapeutics that disrupt RCAN1-mediated inhibition of CN in syndromes and disorders associated with RCAN1 overexpression. Namely, RCAN1 dissociation can be achieved by specifically limiting the formation of the hydrophobic network necessary to form the extended PxIxIT interaction, e.g., by small molecules. Furthermore, up-regulation of kinases that allow for RCAN1 phosphorylation on residues Ser136 and Thr153 are equally good routes to limit the effectiveness of this interaction and thus ultimately CN inhibition. Last, identification and inhibition of the necessary phosphatases for Ser136 and Thr153 will be another possibility for inhibition release. While none of these are short-term projects, the molecular insights presented here lay the foundation for these important efforts.
MATERIALS AND METHODS
Protein expression and purification
DNA coding the human RCAN1 CN-binding domain (residues 89 to 197) was subcloned into pTHMT (His6MBP-TEV-) as previously described (38). RCAN1 variants [RCAN1core (residues 128 to 164), 108SPPdead (S108A/P109A/P110A), 112SPPdead (S112A/P113A/P114A), TxxPdead (T186A/R187A/R188A/P189A), 108SPPdead/TxxPdead, 112SPPdead/TxxPdead, LxVPdead (H95A/L96A/P98A/P99A), PxlxlTdead (P154A/V156A/V158A/H159A), T153A, T153A/S108A, T153A/LxVPdead, and T153A/TxxPdead] were generated using site-directed mutagenesis following recommended protocols (QuikChange; Agilent). CNA (residues 27 to 348DD; for NMR; CN α isoform was used throughout the study) and CNA (residues 27 to 339; for crystallography) were subcloned into pRP1B, containing an N-terminal His6-tag. CN391 (CNA1–391/CNB1–170) and CN370 (CNA1–370/CNB1–170) were cloned into the p11 bicistronic bacterial expression vector as a single cassette, which contains an N-terminal His6-tag followed by a TEV (Tobacco etch virus) protease cleavage site, as previously described (23). These CN constructs do not contain the AID. For protein expression, plasmid DNAs were transformed into Escherichia coli BL21 (DE3) RIL cells (Agilent). Cells were grown in Luria broth in the presence of selective antibiotics at 37°C to an OD600 (optical density at 600 nm) of ~1.0, and expression was induced by the addition of 1 mM isopropyl-β-d-thiogalactopyranoside. Induction proceeded for ~4 hours at 37°C or overnight at 18°C before harvesting by centrifugation at 8000g. Cell pellets were stored at −80°C until purification.
For NMR measurements, expression of uniformly (1H,15N)-, (2H,15N)-, (1H,15N,13C)-, or (2H,15N,13C)-labeled proteins was achieved by growing cells in H2O- or D2O-based M9 minimal media containing 15NH4Cl (1 g/liter) and/or [1H,13C]- or [2H,13C]-d-glucose [4 g/liter; CIL (Cambridge Isotope Laboratories) or Isotec] as the sole nitrogen and carbon sources, respectively, using established protocols (39). Selectively γ/δ-[13CH3, 12CD3]-Val/Leu, δ-[13CH3]-Ile, [U]-2H,15N-labeled RCAN1 were prepared in D2O-based M9 minimal media containing 15NH4Cl (1 g/liter) and/or [2H,12C]-d-glucose (4 g/liter) through addition, 1 hour before induction, of α-ketoisovaleric acid (120 mg/liter; CDLM-7317; Cambridge Isotope Laboratories) and α-ketobutyric acid (60 mg/liter; CDLM-7318; Cambridge Isotope Laboratories).
Cell pellets were lysed in lysis buffer [25 mM tris (pH 8.0), 500 mM NaCl, 5 mM imidazole, and 0.1% Triton X-100] containing EDTA-free protease inhibitor cocktail (Roche) using high-pressure homogenization (Avestin C3). The lysate was clarified by centrifugation at 42,000g and filtered through a 0.22-μm PES (polyethersulfone) filter before loading onto a His-trap HP column (GE Healthcare). Bound proteins were washed with buffer A [50 mM tris (pH 8.0), 500 mM NaCl, and 5 mM imidazole] and eluted with increasing amounts of buffer B [50 mM tris (pH 8.0), 500 mM NaCl, and 500 mM imidazole] using a 5 to 500 mM imidazole gradient. Peak fractions were pooled and dialyzed overnight at 4°C in high-salt dialysis buffer [50 mM tris (pH 8.0), 500 mM NaCl, and 0.5 mM TCEP] with 5:1 volume ratio of TEV protease overnight for RCAN1 or low-salt dialysis buffer [50 mM tris (pH 8.0), 50 mM NaCl, 0.5 mM TCEP, and 1 mM CaCl2] for CN. The next day, a “subtraction” His6-tag purification was performed to remove TEV and the cleaved His6-tag. RCAN1 was concentrated to ~6 ml; 5 mM (final concentration) DTT was added and further heat-purified (80°C; 10 min). RCAN1 was further purified using size exclusion chromatography (Superdex 75 26/60) in either assay buffer [150 mM Hepes (pH 7.5), 150 mM NaCl, 0.5 mM TCEP, 1 mM CaCl2, and 0.5 mM MgCl2] or NMR buffer [20 mM Hepes (pH 6.8), 50 mM NaCl, 0.5 mM TCEP, and 1 mM CaCl2]. Cleaved CN was further purified using a HiTrap Q HP anion exchange column (GE Healthcare). Purified protein was either used immediately or flash-frozen in liquid nitrogen for storage at −80°C.
CN activity assay
The activities of freshly prepared CN in complex with RCAN1 and variants were measured in assay buffer containing varying concentrations of pNPP (0 to 120 mM). CN (0.1 μM) and 0.5 μM RCAN1s were incubated with the substrate at 30°C for 30 min. The reaction was stopped using 1 M NaOH, and the absorbance was measured at 405 nm using a plate reader (BioTek). The rate of pNPP dephosphorylation was determined using the molar extinction coefficient for pNPP of 18,000 M−1 cm−1 and an optical path length of 0.3 cm (96-well plates). Km and Vmax were determined by fitting to the Michaelis-Menten equation, y = Vmax*x/(Km + x); kcat was extracted using y = Et*kcat*x/(Km + x). The catalytic efficiency was obtained as kcat/Km. SigmaPlot 12.5 was used for data analysis including the statistical analysis. The activities of freshly prepared CN in complex with p-RCAN1 and p-RCAN1 variants were measured in assay buffer containing 100 mM pNPP. CN (0.1 μM) with 0.5 μM p-RCAN1s were incubated with the substrate at 30°C; the absorbance at 405 nm was measured every 30 s for 30 min. All experiments were carried out in triplicate.
NMR spectroscopy
NMR data were collected on either Bruker NEO 600- and 800-MHz spectrometers or a Bruker Avance III HD 850-MHz spectrometer equipped with TCI HCN z-gradient cryoprobes at 298 K. NMR measurements of RCAN1 were recorded using (1H,15N)-, (2H,15N)-, (1H,15N,13C)-, or selectively γ/δ-[13CH3, 12CD3]-Val/Leu, δ-[13CH3]-Ile, [U]-2H,15N-labeled protein at a final concentration of 0.6 mM in NMR buffer and 90% H2O/10% D2O. The sequence-specific backbone assignments of RCAN1 and variants, as well as CN-bound RCAN1 were achieved using 3D triple-resonance experiments including 2D [1H,15N] HSQC/TROSY, 3D HNCA, 3D HN(CO)CA, 3D HN(CO)CACB, and 3D HNCACB. All NMR data were processed using TopSpin 4.05 (Bruker BioSpin) and analyzed using CARA (http://cara.nmr.ch) and/or CcpNMR (40). 2D [1H,13C]-HMQC, 3D 13C-ILV-methyl-methyl resolved [1H,1H] NOESY, 13C-methyl-ILV-15N resolved [1H,1H] NOESY, and 15N-resolved [1H,1H] NOESY spectra were recorded with a mixing time (TM) of 120 ms using the selectively γ/δ-[13CH3, 12CD3]-Val/Leu, δ-[13CH3]-Ile, [U]-2H,15N-labeled RCAN1 and [U]-2H-labeled CNA complex. The NOE data were also used to assign the chemical shifts of γ/δ-CH3 of Val/Leu, δ-[CH3]-Ile.
NMR dephosphorylation
Dephosphorylation was initiated by the addition of unlabeled active CN (CN activity was always tested using pNPP as a substrate before its use in NMR experiments) with 50 μM 15N-labeled RCAN1 (and variants) with a molar excess of CN:RCAN1 of 1:10 or 1:20. A reference 2D [1H,15N] HSQC spectrum was recorded before the addition of CN. Dephosphorylation was monitored by extracting the intensities from a series of 2D [1H,15N] HSQC spectra. Apparent rates of dephosphorylation were extracted from global nonlinear least square fits of disappearing phosphorylated peaks and/or reporting neighbor peaks to single exponentials in SigmaPlot.
Crystallization, data collection, and structure determination
Purified CNA27–339 and RCAN1core were incubated together on ice in a 1:1.2 molar ratio for 6 hours before complex purification using size exclusion chromatography in complex buffer [10 mM tris (pH 7.4), 50 mM NaCl, and 1 mM dithiothreitol (DTT)]. The peak corresponding to the complex was pooled and concentrated to 10.3 mg/ml. The CNA:RCAN1core complex crystallized in 0.1 M sodium cacodylate (pH 5.5), 12% polyethylene glycol 8000, and 0.1 M calcium acetate (sitting drop vapor diffusion). Crystals were cryoprotected using a 15-s soak in mother liquor supplemented with 30% (v/v) glycerol and immediately flash-frozen in liquid nitrogen. Data were collected at the APS GM/CAT 23ID-D and processed using HKL3000 (41). The structure was phased using the CNA subunit of Protein Data Bank (PDB) ID 4F0Z as a search model [PHASER as implemented in Phenix (42)]. A solution was obtained in space group P212121; clear electron density for the RCAN1 PxIxIT motif was observed in the initial maps. The initial models of the complex were built without RCAN1core using AutoBuild, followed by iterative rounds of refinement in Phenix and manual building using Coot (43). The RCAN1core PxIxIT sequence was then modeled, followed by additional rounds of refinement and model building. The final model includes RCAN1 residues 153 to 161. Additional electron density, corresponding to ~4 amino acids, was immediately adjacent to the RCAN1 residues at a crystal contact; however, no residues were built due to a lack of features that allowed the sequence or chain direction to be confidently determined. Data collection and refinement details are provided in table S2. Molecular figures were generated using PyMOL (44).
Structure calculations
RCAN1128–164 structures in complex with CNA were calculated using a corefinement protocol closely following that described in (45) and implemented using version 2.50 of Xplor-NIH (46). Interproton distances derived from NOEs were represented by restraints allowing a distance range of 1.8 to 6 Å. The dihedral angles Φ and Ψ were calculated using TALOS (chemical shifts of HN, HA, HB, CA, and CB) (47). Xplor-NIH’s PosDiffPot term was used to restrain the Cα coordinates to values determined in the crystal structure of CNA bound to the RCAN1128–164 PxlxlT strand (amino acids 153 to 161) with 0.5 Å root mean square deviation allowed with zero energy penalty. In addition to the PosDiffPot term, the HBPot energy (48) term was included to form and improve any hydrogen bonding geometry. RCAN1 atoms, all CNA side-chain atoms, and all atoms of CNA’s interfacial residues (amino acids 327 to 336, 318, 286, 288, 290, 293, 299, and 300) were allowed torsion angle degrees of freedom during simulated annealing and all degrees of freedom during a final Cartesian minimization. Backbone atoms of the noninterfacial CNA atoms were held rigid throughout. RCAN1128–164 was folded from randomized extended coordinates in the initial step of refinement. An initial temperature of 3500 K and a final temperature of 25 K were used for simulated annealing. A total of 100 complex structures were calculated during the first cofold step and 10 structures with the lowest energies were used as inputs for a refinement step. A total of five refinement iterations were performed, and 10 conformers with the lowest energies were used to represent the structure of RCAN1128–164 when bound to CN. For the final ensemble of RCAN1128–164 structures, no distance violations more than 0.5 Å and no torsion angle violation more than 3° were identified.
p38α phosphorylation
Expression and purification of human p38α and MKK6 were carried out as previously described (32). Phosphorylated p38 was produced by p38α incubation with constitutively active MKK6S207E/S211E (1:40 molar ratio). The reaction components were added to a 50-ml conical tube in the following order to achieve the reported final concentrations in a 30-ml volume: 20 mM Hepes (pH 7.5), 0.5 mM EDTA, 2 mM DTT, 20 mM MgCl2, 0.05 μM MKK6S207E/S211E, 2 μM p38α, and 4 mM adenosine 5′-triphosphate (ATP). The mixture was mixed by pipetting up/down several times and was incubated at 27°C for 5 min before adding ATP (Roche). After the addition of ATP, the reaction was incubated in a water bath at 27°C for 5 hours. Following incubation, the mixture was exchanged into buffer A [20 mM tris (pH 7.6), 75 mM NaCl, and 0.5 mM TCEP (tris(2-carboxyethyl)phosphine)] to remove ATP using an Amicon Ultra-15 filter (Millipore). Upon ATP removal, the solution was filtered and loaded onto a Mono Q 5/50 GL column (GE Healthcare) pre-equilibrated in buffer A and eluted with a linear gradient of 0 to 100% buffer B [20 mM tris (pH 7.6), 0.4 M NaCl, and 0.5 mM TCEP]. RCAN1 variants were phosphorylated by pp38α in buffer [20 mM Hepes (pH 7.5), 20 mM MgCl2, 1 mM DTT, and 4.8 mM ATP]. pp38α (0.05 μM) was added to 2 μM RCAN1 and variants. The phosphorylation reaction was incubated at 27°C for 24 hours and stopped by heating at 65°C for 10 min.
ITC measurements
Protein concentration of CN and RCAN1 variants was measured in triplicate using either the Pierce 660 (Thermo Fisher Scientific) or the AccuOrange Protein Quantitation assays (Biotium). CN and RCAN1 variants were equilibrated in 20 mM tris (pH 7.5), 150 mM NaCl, 1 mM CaCl2, and 0.5 mM TCEP. RCAN1 variants (80 to 100 μM, syringe) were titrated into CN (5 to 10 μM, cell) using a VP-ITC microcalorimeter (Malvern) or an Affinity-ITC microcalorimeter (TA Instruments) with a 250-s interval at 25°C. Twenty-five injections were delivered during each experiment over a period of 20 s (VP-ITC microcalorimeter) or 10 s (Affinity-ITC microcalorimeter), and the solution in the sample cell was stirred at 307 rpm (VP-ITC microcalorimeter) or 125 to 200 rpm (Affinity-ITC microcalorimeter) to ensure rapid mixing. All ITC data were analyzed using NITPIC (49) and fitted to a single-site binding model using SEDPHAT (50); figures were generated using GUSSI (51). To distinguish between the different transitions, we defined a ΔΔH ≤0.35 kcal/mol as baseline, which allows for a completely unbiased data analysis.
SPR measurements
SPR measurements were performed at 25°C and a sampling rate of 5 Hz using a four-channel Reichert 4SPR instrument fitted with an autosampler and a degassing pump (Reichert Technologies). SPR buffers containing 20 mM tris (pH 7.5), 500 mM NaCl, 1 mM CaCl2, 0.5 mM TCEP, and 0.05% Tween were sterile-filtered and degassed in autoclaved glassware. Running buffers were used to prime and run both the sample and syringe pump reservoirs before each experiment. Gold sensor chips modified with Ni-NTA–functionalized dextran (NiD50L) were installed and equilibrated under flow conditions (100 μl/min) for ≥60 min. Surface contaminants were cleared by a pair of 120-μl injections of 10 mM NaOH during equilibration. Experiments were initiated by injecting 120 μl of His6-CN370 (200 nM) diluted in 20 mM tris (pH 7.5), 500 mM NaCl, 1 mM CaCl2, 0.5 mM TCEP, and 0.05% Tween onto channels 1, 2, and 3 for 120 s at 50 μl/min, which resulted in between 450 and 500 μRIU of surface loading (channel 4 was used as reference surfaces). The sensor chip was allowed to equilibrate for 20 min at 50 μl/min before beginning the experiments. Purified RCAN1 variants were diluted into running buffer to final concentrations of 1.25, 2.5, 5, 10, and 20 nM. A single 60-μl RCAN1 injection was applied for 60 s at 50 μl/min followed by a dissociation step of 180 s. For each concentration of RCAN1 injection, chip surface was prepared with stripping with 350 mM EDTA (pH 8), reconditioning the surface with 10 mM NaOH to remove nonspecifically bound CN aggregates, charging the surface with 40 mM NiSO4, and reloading fresh CN onto the surface. For all experiments, two buffer blank injections were included to achieve double-referencing. Technical replicates were obtained by using three channels per chip. Kinetic parameters were determined by curve-fitting using TraceDrawer software (Ridgeview Instruments AB) fit with a one-to-one model using local Bmax.
Sequence alignment
Multiple sequence alignment was performed using RCAN1 C-terminal CN-binding domains from human (Hs), Ovis aries (Oa), Bos taurus (Bt), Canis lupus dingo (Cl), Mus musculus (Mm), Rattus norvegicus (Rn), Xenopus tropicalis (Xt), Danio rerio (Dr), Drosophila novamexicana (Dn), Apis mellifera (Am), and Caenorhabditis elegans (Ce).
Supplementary Material
Acknowledgments
We are grateful to A. Oot for help at the beginning stages of this project, and we thank T. Moon for help with SPR data collection and evaluation. We thank M. Cyert for CN discussions. Funding: This work was supported by grant R01NS091336 from the National Institute of Neurological Disorders and Stroke to W.P. and grant R01GM098482 from the National Institute of General Medicine to R.P. Crystallographic data were collected on beamline 23-ID-D at APS, Argonne National Laboratory. This research used resources of the Advanced Photon Source, a U.S. Department of Energy (DOE) Office of Science User Facility operated for the DOE Office of Science by Argonne National Laboratory under contract no. DE-AC02-06CH11357. CDS was supported by the Intramural Research Program of the Center for Information Technology at the National Institutes of Health. The funders had no role in study design, data collection and analysis, decision to publish, or preparation of the manuscript. Author contributions: W.P., R.P., and Y.L. developed the concept. Y.L. designed, optimized, and performed in vitro phosphorylation and dephosphorylation experiments using NMR spectroscopy. S.G. performed RCAN189-197 backbone assignment, SSP, and hetNOE analysis. Y.L. performed CN and all other RCAN1 variant NMR backbone assignments and NMR studies. R.P. and S.R.S. designed, optimized, and performed crystallization and structure determination experiments. Y.L. and S.G. performed and analyzed ITC experiments. Y.L. performed SPR measurements and analysis and CN activity experiments and analysis. Y.L. and C.D.S. performed structure corefinement. W.P., R.P., and Y.L. wrote the manuscript with comments and inputs from all coauthors. Competing interests: The authors declare that they have no competing interests. Data and materials availability: All data needed to evaluate the conclusions in the paper are present in the paper and/or the Supplementary Materials. Additional data related to this paper may be requested from the authors. All NMR chemical shifts have been deposited in the BioMagResBank (BMRB: 27801, 27994, 27995, 27996, and 27997). Atomic coordinates and structure factors have been deposited in the Protein Data Bank (PDB: 6UUQ).
SUPPLEMENTARY MATERIALS
Supplementary material for this article is available at http://advances.sciencemag.org/cgi/content/full/6/27/eaba3681/DC1
REFERENCES AND NOTES
- 1.Klee C. B., Crouch T. H., Krinks M. H., Calcineurin: A calcium- and calmodulin-binding protein of the nervous system. Proc. Natl. Acad. Sci. U.S.A. 76, 6270–6273 (1979). [DOI] [PMC free article] [PubMed] [Google Scholar]
- 2.Rusnak F., Mertz P., Calcineurin: Form and function. Physiol. Rev. 80, 1483–1521 (2000). [DOI] [PubMed] [Google Scholar]
- 3.Aramburu J., Rao A., Klee C. B., Calcineurin: From structure to function. Curr. Top. Cell. Regul. 36, 237–295 (2000). [DOI] [PubMed] [Google Scholar]
- 4.Arron J. R., Winslow M. M., Polleri A., Chang C.-P., Wu H., Gao X., Neilson J. R., Chen L., Heit J. J., Kim S. K., Yamasaki N., Miyakawa T., Francke U., Graef I. A., Crabtree G. R., NFAT dysregulation by increased dosage of DSCR1 and DYRK1A on chromosome 21. Nature 441, 595–600 (2006). [DOI] [PubMed] [Google Scholar]
- 5.Zeng H., Chattarji S., Barbarosie M., Rondi-Reig L., Philpot B. D., Miyakawa T., Bear M. F., Tonegawa S., Forebrain-specific calcineurin knockout selectively impairs bidirectional synaptic plasticity and working/episodic-like memory. Cell 107, 617–629 (2001). [DOI] [PubMed] [Google Scholar]
- 6.Fuentes J. J., Genescà L., Kingsbury T. J., Cunningham K. W., Pérez-Riba M., Estivill X., de la Luna S., DSCR1, overexpressed in Down syndrome, is an inhibitor of calcineurin-mediated signaling pathways. Hum. Mol. Genet. 9, 1681–1690 (2000). [DOI] [PubMed] [Google Scholar]
- 7.Fuentes J. J., Pritchard M. A., Planas A. M., Bosch A., Ferrer I., Estivill X., A new human gene from the Down syndrome critical region encodes a proline-rich protein highly expressed in fetal brain and heart. Hum. Mol. Genet. 4, 1935–1944 (1995). [DOI] [PubMed] [Google Scholar]
- 8.Rothermel B., Vega R. B., Yang J., Wu H., Bassel-Duby R., Williams R. S., A protein encoded within the Down syndrome critical region is enriched in striated muscles and inhibits calcineurin signaling. J. Biol. Chem. 275, 8719–8725 (2000). [DOI] [PubMed] [Google Scholar]
- 9.Ermak G., Morgan T. E., Davies K. J., Chronic overexpression of the calcineurin inhibitory gene DSCR1 (Adapt78) is associated with Alzheimer’s disease. J. Biol. Chem. 276, 38787–38794 (2001). [DOI] [PubMed] [Google Scholar]
- 10.Harris C. D., Ermak G., Davies K. J. A., RCAN1-1L is overexpressed in neurons of Alzheimer’s disease patients. FEBS J. 274, 1715–1724 (2007). [DOI] [PubMed] [Google Scholar]
- 11.Cook C. N., Hejna M. J., Magnuson D. J., Lee J. M., Expression of calcipressin1, an inhibitor of the phosphatase calcineurin, is altered with aging and Alzheimer’s disease. J. Alzheimers Dis. 8, 63–73 (2005). [DOI] [PubMed] [Google Scholar]
- 12.Head E., Powell D., Gold B. T., Schmitt F. A., Alzheimer’s disease in Down syndrome. Eur. J. Neurodegener. Dis. 1, 353–364 (2012). [PMC free article] [PubMed] [Google Scholar]
- 13.Lai F., Williams R. S., A prospective study of Alzheimer disease in Down syndrome. Arch. Neurol. 46, 849–853 (1989). [DOI] [PubMed] [Google Scholar]
- 14.Billingsley M. L., Kincaid R. L., Regulated phosphorylation and dephosphorylation of tau protein: Effects on microtubule interaction, intracellular trafficking and neurodegeneration. Biochem. J. 323 (Pt 3), 577–591 (1997). [DOI] [PMC free article] [PubMed] [Google Scholar]
- 15.Braithwaite S. P., Stock J. B., Lombroso P. J., Nairn A. C., Protein phosphatases and Alzheimer’s disease. Prog. Mol. Biol. Transl. Sci. 106, 343–379 (2012). [DOI] [PMC free article] [PubMed] [Google Scholar]
- 16.Jung M.-S., Park J.-H., Ryu Y. S., Choi S.-H., Yoon S.-H., Kwen M.-Y., Oh J. Y., Song W.-J., Chung S.-H., Regulation of RCAN1 protein activity by Dyrk1A protein-mediated phosphorylation. J. Biol. Chem. 286, 40401–40412 (2011). [DOI] [PMC free article] [PubMed] [Google Scholar]
- 17.Poppek D., Keck S., Ermak G., Jung T., Stolzing A., Ullrich O., Davies K. J. A., Grune T., Phosphorylation inhibits turnover of the tau protein by the proteasome: Influence of RCAN1 and oxidative stress. Biochem. J. 400, 511–520 (2006). [DOI] [PMC free article] [PubMed] [Google Scholar]
- 18.Aramburu J., Garcia-Cózar F., Raghavan A., Okamura H., Rao A., Hogan P. G., Selective inhibition of NFAT activation by a peptide spanning the calcineurin targeting site of NFAT. Mol. Cell 1, 627–637 (1998). [DOI] [PubMed] [Google Scholar]
- 19.Aubareda A., Mulero M. C., Pérez-Riba M., Functional characterization of the calcipressin 1 motif that suppresses calcineurin-mediated NFAT-dependent cytokine gene expression in human T cells. Cell. Signal. 18, 1430–1438 (2006). [DOI] [PubMed] [Google Scholar]
- 20.Chan B., Greenan G., McKeon F., Ellenberger T., Identification of a peptide fragment of DSCR1 that competitively inhibits calcineurin activity in vitro and in vivo. Proc. Natl. Acad. Sci. U.S.A. 102, 13075–13080 (2005). [DOI] [PMC free article] [PubMed] [Google Scholar]
- 21.Mulero M. C., Aubareda A., Orzáez M., Messeguer J., Serrano-Candelas E., Martínez-Hoyer S., Messeguer A., Pérez-Payá E., Pérez-Riba M., Inhibiting the calcineurin-NFAT (nuclear factor of activated T cells) signaling pathway with a regulator of calcineurin-derived peptide without affecting general calcineurin phosphatase activity. J. Biol. Chem. 284, 9394–9401 (2009). [DOI] [PMC free article] [PubMed] [Google Scholar]
- 22.Li H., Zhang L., Rao A., Harrison S. C., Hogan P. G., Structure of calcineurin in complex with PVIVIT peptide: Portrait of a low-affinity signalling interaction. J. Mol. Biol. 369, 1296–1306 (2007). [DOI] [PubMed] [Google Scholar]
- 23.Grigoriu S., Bond R., Cossio P., Chen J. A., Ly N., Hummer G., Page R., Cyert M. S., Peti W., The molecular mechanism of substrate engagement and immunosuppressant inhibition of calcineurin. PLOS Biol. 11, e1001492 (2013). [DOI] [PMC free article] [PubMed] [Google Scholar]
- 24.Martínez-Martínez S., Genescà L., Rodríguez A., Raya A., Salichs E., Were F., López-Maderuelo M. D., Redondo J. M., de la Luna S., The RCAN carboxyl end mediates calcineurin docking-dependent inhibition via a site that dictates binding to substrates and regulators. Proc. Natl. Acad. Sci. U.S.A. 106, 6117–6122 (2009). [DOI] [PMC free article] [PubMed] [Google Scholar]
- 25.Vega R. B., Yang J., Rothermel B. A., Bassel-Duby R., Williams R. S., Multiple domains of MCIP1 contribute to inhibition of calcineurin activity. J. Biol. Chem. 277, 30401–30407 (2002). [DOI] [PubMed] [Google Scholar]
- 26.Hendus-Altenburger R., Wang X., Sjøgaard-Frich L. M., Pedraz-Cuesta E., Sheftic S. R., Bendsøe A. H., Page R., Kragelund B. B., Pedersen S. F., Peti W., Molecular basis for the binding and selective dephosphorylation of Na+/H+ exchanger 1 by calcineurin. Nat. Commun. 10, 3489 (2019). [DOI] [PMC free article] [PubMed] [Google Scholar]
- 27.Kissinger C. R., Parge H. E., Knighton D. R., Lewis C. T., Pelletier L. A., Tempczyk A., Kalish V. J., Tucker K. D., Showalter R. E., Moomaw E. W., Crystal structures of human calcineurin and the human FKBP12-FK506-calcineurin complex. Nature 378, 641–644 (1995). [DOI] [PubMed] [Google Scholar]
- 28.Takeuchi K., Sun Z.-Y. J., Li S., Gal M., Wagner G., NMR resonance assignments of the catalytic domain of human serine/threonine phosphatase calcineurin in unligated and PVIVIT-peptide-bound states. Biomol. NMR Assign. 9, 201–205 (2015). [DOI] [PMC free article] [PubMed] [Google Scholar]
- 29.Zhang Z. Y., VanEtten R. L., Pre-steady-state and steady-state kinetic analysis of the low molecular weight phosphotyrosyl protein phosphatase from bovine heart. J. Biol. Chem. 266, 1516–1525 (1991). [PubMed] [Google Scholar]
- 30.Hornbeck P. V., Chabra I., Kornhauser J. M., Skrzypek E., Zhang B., PhosphoSite: A bioinformatics resource dedicated to physiological protein phosphorylation. Proteomics 4, 1551–1561 (2004). [DOI] [PubMed] [Google Scholar]
- 31.Pan C., Olsen J. V., Daub H., Mann M., Global effects of kinase inhibitors on signaling networks revealed by quantitative phosphoproteomics. Mol. Cell. Proteomics 8, 2796–2808 (2009). [DOI] [PMC free article] [PubMed] [Google Scholar]
- 32.Kumar G. S., Clarkson M. W., Kunze M. B. A., Granata D., Wand A. J., Lindorff-Larsen K., Page R., Peti W., Dynamic activation and regulation of the mitogen-activated protein kinase p38. Proc. Natl. Acad. Sci. U.S.A. 115, 4655–4660 (2018). [DOI] [PMC free article] [PubMed] [Google Scholar]
- 33.Ma L., Tang H., Ren Y., Deng H., Wu J., Wang Z., p38α MAP kinase phosphorylates RCAN1 and regulates its interaction with calcineurin. Sci. China Life Sci. 55, 559–566 (2012). [DOI] [PubMed] [Google Scholar]
- 34.Liu Q., Busby J. C., Molkentin J. D., Interaction between TAK1-TAB1-TAB2 and RCAN1-calcineurin defines a signalling nodal control point. Nat. Cell Biol. 11, 154–161 (2009). [DOI] [PMC free article] [PubMed] [Google Scholar]
- 35.Jin L., Harrison S. C., Crystal structure of human calcineurin complexed with cyclosporin A and human cyclophilin. Proc. Natl. Acad. Sci. U.S.A. 99, 13522–13526 (2002). [DOI] [PMC free article] [PubMed] [Google Scholar]
- 36.Clipstone N. A., Crabtree G. R., Identification of calcineurin as a key signalling enzyme in T-lymphocyte activation. Nature 357, 695–697 (1992). [DOI] [PubMed] [Google Scholar]
- 37.Brauer B. L., Moon T. M., Sheftic S. R., Nasa I., Page R., Peti W., Kettenbach A. N., Leveraging new definitions of the LxVP SLiM to discover novel calcineurin regulators and substrates. ACS Chem. Biol. 14, 2672–2682 (2019). [DOI] [PMC free article] [PubMed] [Google Scholar]
- 38.Peti W., Page R., Strategies to maximize heterologous protein expression in Escherichia coli with minimal cost. Protein Expr. Purif. 51, 1–10 (2007). [DOI] [PubMed] [Google Scholar]
- 39.Peti W., Page R., NMR spectroscopy to study MAP kinase binding to MAP kinase phosphatases. Methods Mol. Biol. 1447, 181–196 (2016). [DOI] [PubMed] [Google Scholar]
- 40.R. L. J. Keller, The Computer Aided Resonance Assignment Tutorial (CANTINA Verlag, 2004). [Google Scholar]
- 41.Otwinowski Z., Minor W., Processing of x-ray diffraction data collected in oscillation mode. Meth. Enzymol. 276, 307–326 (1997). [DOI] [PubMed] [Google Scholar]
- 42.Adams P. D., Afonine P. V., Bunkóczi G., Chen V. B., Davis I. W., Echols N., Headd J. J., Hung L.-W., Kapral G. J., Grosse-Kunstleve R. W., McCoy A. J., Moriarty N. W., Oeffner R., Read R. J., Richardson D. C., Richardson J. S., Terwilliger T. C., Zwart P. H., PHENIX: A comprehensive Python-based system for macromolecular structure solution. Acta Crystallogr. D Biol. Crystallogr. 66, 213–221 (2010). [DOI] [PMC free article] [PubMed] [Google Scholar]
- 43.Emsley P., Lohkamp B., Scott W. G., Cowtan K., Features and development of Coot. Acta Crystallogr. D Biol. Crystallogr. 66, 486–501 (2010). [DOI] [PMC free article] [PubMed] [Google Scholar]
- 44.W. L. DeLano, The PyMOL molecular graphics system, in PyMOL (Schoredinger, LLC, 2002). [Google Scholar]
- 45.Bermejo G. A., Schwieters C. D., Protein structure elucidation from NMR data with the program Xplor-NIH. Methods Mol. Biol. 1688, 311–340 (2018). [DOI] [PMC free article] [PubMed] [Google Scholar]
- 46.Schwieters C. D., Bermejo G. A., Clore G. M., Xplor-NIH for molecular structure determination from NMR and other data sources. Protein Sci. 27, 26–40 (2018). [DOI] [PMC free article] [PubMed] [Google Scholar]
- 47.Cornilescu G., Delaglio F., Bax A., Protein backbone angle restraints from searching a database for chemical shift and sequence homology. J. Biomol. NMR 13, 289–302 (1999). [DOI] [PubMed] [Google Scholar]
- 48.Schwieters C. D., Bermejo G. A., Clore G. M., A three-dimensional potential of mean force to improve backbone and sidechain hydrogen bond geometry in Xplor-NIH protein structure determination. Protein Sci. 29, 100–110 (2019). [DOI] [PMC free article] [PubMed] [Google Scholar]
- 49.Scheuermann T. H., Brautigam C. A., High-precision, automated integration of multiple isothermal titration calorimetric thermograms: New features of NITPIC. Methods 76, 87–98 (2015). [DOI] [PMC free article] [PubMed] [Google Scholar]
- 50.Zhao H., Piszczek G., Schuck P., SEDPHAT—A platform for global ITC analysis and global multi-method analysis of molecular interactions. Methods 76, 137–148 (2015). [DOI] [PMC free article] [PubMed] [Google Scholar]
- 51.Brautigam C. A., Calculations and publication-quality illustrations for analytical ultracentrifugation data. Meth. Enzymol. 562, 109–133 (2015). [DOI] [PubMed] [Google Scholar]
Associated Data
This section collects any data citations, data availability statements, or supplementary materials included in this article.
Supplementary Materials
Supplementary material for this article is available at http://advances.sciencemag.org/cgi/content/full/6/27/eaba3681/DC1