

Abstract

Janus nanoparticles could exhibit a higher interfacial activity and adsorb stronger to fluid interfaces than homogeneous nanoparticles of similar sizes. However, little is known about the interfacial diffusion of Janus nanoparticles and how it compares to that of homogeneous ones. Here, we employed fluorescence correlation spectroscopy to study the lateral diffusion of ligand-grafted Janus nanoparticles adsorbed at water/oil interfaces. We found that the diffusion was significantly slower than that of homogeneous nanoparticles. We carried out dissipative particle dynamic simulations to study the mechanism of interfacial slowdown. Good agreement between experimental and simulation results has been obtained only provided that the flexibility of ligands grafted on the nanoparticle surface was taken into account. The polymeric ligands were deformed and oriented at an interface so that the effective radius of Janus nanoparticles is larger than the nominal one obtained by measuring the diffusion in bulk solution. These findings highlight further the critical importance of the ligands grafted on Janus nanoparticles for applications involving nanoparticle adsorption at an interface, such as oil recovery or two-dimensional self-assembly.
Keywords: Brownian diffusion, Janus nanoparticles, fluorescence correlation spectroscopy, Stokes−Einstein equation, interfacial phenomena
Particle adsorption at liquid interfaces is found ubiquitously in nature.1 The phenomenon is of considerable interest because it can be used to stabilize multiphase fluid mixtures and is important for various applications ranging from oil recovery to two-dimensional self-assembly.1,2 For many of these applications, the size and surface chemistry (ligand) of adsorbed particles are of key importance. If the two hemispheres of a particle surface are decorated with hydrophilic and hydrophobic ligands, i.e., in the form of Janus particles, adsorption at a water/oil interface allows both regions to be in contact with their preferred phases.3−5 As a result, the adsorption of Janus particles is expected to be significantly stronger than that of particles with a chemically homogeneous surface, as predicted by theory6 and corroborated by experiments and simulations.7−13
Many applications rely not only on the ability of particles to adsorb on an interface but also on their interfacial mobility after adsorption, which, however, often exhibits anomalies and is not yet fully understood. For example, it was shown that such particles took untenably long to reach equilibrium after adsorption to a liquid interface.14,15 Furthermore, the translational and rotational diffusions of adsorbed particles were often found to be slower than the predictions of the Stokes–Einstein relation and hydrodynamic theories,16−25 whereas the underlying mechanisms were not captured by the simulations.26,27 Some reasons for the slow diffusion of micron-sized particles have been suggested such as the ubiquitous surface “defects” that induce multiple metastable pinning of the three-phase contact line,28−30 producing an extra reverse random force to slow diffusion.19 However, according to the Young–Laplace equation, contact line deformation should be vanishingly small when the particle size is ∼10 nm.31 Therefore, whether the contact line deformation mechanism works for nanoparticles remains unknown. This scenario may be even more complicated for amphiphilic Janus nanoparticles (JNPs) because the boundary between the chemically distinct regions is expected to be an intrinsic defect, supposedly causing strong pinning. Thus, precise experimental data directly comparing the interfacial diffusion of small amphiphilic JNPs to that of homogeneous nanoparticles (HNPs) of similar sizes are needed in order to properly understand the underlying physical phenomena.
In this work, we studied the diffusion of small (∼10 nm) JNPs and HNPs at water/alkane interfaces as a function of the viscosity of the aqueous and the alkane phases. We found that the two-dimensional diffusion of JNPs at water/oil interfaces was slower compared to that of HNPs and to the predictions of a modified Stokes–Einstein equation using the friction coefficient of spherical particles. We performed dissipative particle dynamic simulation to explore the mechanisms of interfacial slowdown and found out that it can be attributed to the orientation of ligands on a nanoparticle surface.
Results and Discussion
Enabling the Quantification of the Individual JNPs’ Diffusion at a Water/Oil Interface
The JNPs were synthesized through a method combining “solid-state grafting-to” and “grafting-from” using CdSe quantum dots with a mean radius of about 3.6 nm as seeds.32 Thiol-terminated poly(ethylene glycol) (PEG, molecular weight [Mw] 5 kg/mol) single crystals were used as a solid substrate that was able to adsorb the native quantum dots. The side that had contact with the substrate was grafted with PEG via the ligand exchange reaction to irreversibly displace the native oleate ligands on the quantum dot surface. The oleate ligands on the other side were exchanged with 1-dodecanethiol. After dissolving the single-crystal substrates, JNPs were obtained. HNPs were prepared by functionalizing the same quantum dots with thiol-terminated PEG on the entire surface. Because JNPs can be dispersed only in dichloromethane, we determined the hydrodynamic radius (RH) by measuring diffusion in a dilute dichloromethane dispersion; the resulting RH’s of JNPs and HNPs are 5.0 and 6.4 nm, respectively, as shown in Figure S6 in the Supporting Information.
JNPs dissolve neither in an aqueous medium nor in alkane. Therefore, we cannot disperse them into one phase and wait for them to adsorb to the interface spontaneously. In order to circumvent this difficulty, a small amount (about 4–10 μL) of JNPs’ dichloromethane dispersion at a concentration of 10–10 M was gently placed upon a water surface using an Eppendorf adjustable-volume (0.5–10 μL) pipet. Although the density of dichloromethane (1.33 g/cm3 at 25 °C) is greater than that of water (1.00 g/cm3 at 25 °C), the dichloromethane would spread at the water/air interface provided that the volume is sufficiently small because of the high interfacial tension between water and air (71.99 mN/m at 25 °C). The dichloromethane solvent was allowed to evaporate for typically 15 s. Afterward, the alkane phase was added carefully on top of the water surface. The resulting surface coverage of the NPs was around 1–2 μm2 per particle.
Although a large number of experimental techniques can be used to study translational diffusion, very few can measure precisely the interfacial diffusion with a high spatial/temporal resolution. Here we chose fluorescence correlation spectroscopy (FCS) that is very well suited for such a task.33−35 This is because the concept of FCS is based on monitoring the fluorescence fluctuations originating from fluorescent species diffusing in and out of a very small (<1 μm3) confocal volume (Figure 1b). In a representative experiment, the confocal volume was first scanned across the water/alkane interface with adsorbed nanoparticles to find its precise location at the position of the maximum detected fluorescence (Figure 1c). The confocal volume was then positioned at the interface, and the fluctuations in detected fluorescence intensity F(t) caused by the lateral diffusion of the nanoparticles were measured and used to compute an experimental autocorrelation function, G(τ) = 1 + ⟨δF(t) δF(t + τ)⟩/⟨F(t)⟩2 where δF(t) = F(t) – ⟨F(t)⟩. Representative autocorrelation functions of JNPs and HNPs at a water/decane interface are illustrated in Figure 1d. Finally, the experimental autocorrelation function was fitted with the analytical equation36,37
| 1 |
to obtain the average number of diffusing species N and their mean diffusion time (τD), which is directly related to the two-dimensional diffusion coefficient via Dexp,|| = r02/4τD, where r0 is the radial dimension of the confocal volume. Here r0 = 220 nm is the lateral dimension of the confocal detection volume. This value was obtained by measuring the diffusion time of rhodamine 6G molecules with a known hydrodynamic radius in a dilute aqueous solution.
Figure 1.

(a) Schematic representation of ligand-grafted JNPs at a water/oil interface. The yellow sphere and green and blue strings denote the quantum dot core, 1-dodecanethiol, and PEG, respectively. (b) Schematic representation of the FCS experiments at the water/oil interface. (c) Fluorescence intensity scan through the water/decane interface with adsorbed JNPs. (d) Representative autocorrelation curves (symbols) and their fits with eq 1 (solid lines) for JNPs (black squares) and HNPs (red circles) at water/decane interfaces. Dexp,||versus viscosity of the (e) alkane and (f) aqueous phases at interfaces with adsorbed JNPs (circles) and HNPs (squares). The viscosity of the aqueous phase was controlled by mixing water with glycerol.
Interfacial Diffusion Measured by FCS
For a spherical particle straddling a liquid–liquid interface, the viscous drag can be approximated according to the particle’s cross-sectional area immersed by the respective fluid phases using a generalized Stokes–Einstein relation:38,39DSE,|| = 2πkbT/(6πRH(2πηw + (ηa – ηw)(2Θ – sin 2Θ))). Here, DSE,|| is the theoretical diffusion coefficient; Θ, ηw, and ηa, are the contact angle and the viscosities of the aqueous and alkane phases, respectively. It is difficult to determine Θ of nanoparticles.29,30,40,41 Therefore, we first measured the diffusion at a water/decane interface because the viscosities of water (1 cP) and decane (0.92 cP) at 20 °C are almost identical. In this scenario, the diffusion coefficient does not depend on Θ and can be approximated using the classic Stokes–Einstein form DSE,|| ≈ kbT/6πRHηw. Figure 1d shows representative autocorrelation curves (ACCs) and their fits for diffusion of JNPs and HNPs at a water/decane interface. We found a noticeably higher average diffusion time through the FCS observation volume for JNPs than for HNPs, indicating that the Janus character plays a role in interfacial diffusion. Furthermore, the experimental values of the diffusion coefficient, Dexp,||, calculated from the diffusion times of both nanoparticles were much smaller than DSE,||: Dexp,||/DSE,|| ≈ 0.35 for JNPs and Dexp,||/DSE,|| ≈ 0.77 for HNPs.
We further measured Dexp,|| of both nanoparticles versus the viscosities of the aqueous and alkane phases (Figure 1e,f). We found that the interfacial diffusion coefficient decreases with increasing the viscosity of both aqueous and alkane phases, indicating that the particles are partially immersed in both phases. It is noteworthy that the interfacial diffusion of JNPs is slower than that of HNPs at all conditions.
It is important to consider and exclude potential fallibilities that could affect the accuracy of the experimental results. For example, the presence of nanoparticle aggregates, which are larger than individual nanoparticles, could lead to a longer diffusion time. This possibility was excluded because aggregates are easily recognized in FCS experiments as anomalously bright spikes in the intensity—time trace. Another possible source of error could be desorption from the interface42−44 because the FCS technique relies on detection of diffusion into and out of a confocal volume shaped like an erect ellipse (Figure 1b). Under such circumstances, desorbed NPs could potentially take longer than the laterally diffusing ones to exit the confocal volume, producing a false appearance of slow diffusion. Although we cannot exclude this possibility for HNPs, this scenario is not possible for JNPs that are not dispersible either in water or in alkanes. Finally, we have ruled out the possibility of contamination as a source of the slowdown, because the addition of several types of surfactants, including sodium dodecyl sulfate, cetrimonium bromide, and tetraethylene glycol monooctyl ether (C8E4), at a concentration of 10–5 M in the aqueous solution did not cause a decrease in Dexp,|| within the experimental uncertainty. Thus, after a series of control experiments, we concluded that the experimentally observed slowdown in the interfacial diffusion is not originated from artifacts.
Stepwise Analysis toward the Mechanism of Interfacial Slowdown by Using the Dissipative Particle Dynamics (DPD) Simulation
Next, we attempt to interpret the observed diffusional slowdown of the studied nanoparticles at water/oil interfaces. We note two pioneering theories that describe well the interfacial diffusion slowdown for homogeneous microparticles. One of these theories considers the hydrodynamic interactions,39,45−51 and the other takes the contact line fluctuation into account.19,21 However, because of the JNPs’ surface heterogeneity, it is difficult to analytically describe the interfacial diffusion of JNPs. To overcome this difficulty, the DPD simulation52 was selected, after screening many other simulation methods, because of its suitability to involve the hydrodynamic interaction, relatively low computational loading, and our ability to enable the large-scale parallel computing for this method.52 These advantages allowed us to rapidly test the diffusion of a series of simulated model nanoparticles at an interface between immiscible liquids, to explore the dominant mechanism in the interfacial diffusion of JNPs, and to understand why it is even slower than that of HNPs.
The DPD simulations were carried out in NVT ensembles. The simulation time of a single trajectory is typically 107τ, with a time step Δt = 0.02τ where τ = 6.9 ps. The simulation method is described in the Methods section. A full version is given in the Supporting Information. The simulation setting was calibrated by measuring the diffusion of a smooth nanoparticle in bulk media. This simulated result is consistent with the prediction of the Stokes–Einstein equation, justifying the fitness of the simulation parameters.
We examined a series of simulated model nanoparticles to make a stepwise determination in exploring the key factor that is responsible for the measured phenomena. The diameters of the rigid core of all simulated nanoparticles were set to be 5 (corresponding to 5 nm in real units). For these simulated model nanoparticles, we calculated the ensemble-averaged translational diffusion coefficient either in dilute dispersion (DDPD,bulk) or at interfaces (DDPD,||) via DDPD = MSD/4Δt, where MSD denotes the mean squared displacement.
We used a single-site model to produce a smooth nanoparticle by expanding a DPD bead. The size was tuned by a parameter d; herein, d = 1 for solvent bead and d = 5 for the expanded nanoparticle. DPD forces have three terms, namely, the conservative force, random force, and dissipative force, respectively, as explained in the Methods section. The conservative force formula for the smooth nanoparticle system is rewritten as
 |
2 |
where α is an additional parameter and Δ = di + dj – 1 represents the size of two beads with diameter di and dj, respectively. Other parameters are explained in the Methods section. For two solvent beads with di = di = 1, Δ = 0; the conservative force returns to normal expression.
We simulated the diffusion of a smooth NP at a liquid/liquid interface and compared it to bulk diffusion, as shown in Figure 2a. The purpose of studying a smooth NP is to eliminate the effect of contact line pinning. The resulting DDPD,||/DDPD,bulk is equal to 0.94; this result is irrespective of the surface chemistry. We hypothesized that the small difference is caused by hydrodynamic interaction. To quantify this effect, we placed a smooth nanoparticle in a position close to the liquid/liquid interface and quantified the distance-dependent diffusion coefficient to the interface. We found a gradual decrease in DDPD,|| as a function of proximity to the interface (Figure S4 in the Supporting Information); the diffusion coefficient in a position close to the interface is comparable to DDPD,||, which is consistent with a scenario of hydrodynamic coupling between a spherical particle and a planar liquid/liquid interface.50 The hydrodynamic coupling may play a role in interface diffusion of HNPs, but cannot interpret the diffusional behavior of JNPs.
Figure 2.

Snapshots of (a) a smooth nanoparticle, (b) a homogeneous nanoparticle that has a rough surface, (c) a Janus nanoparticle that has a rough surface. Mean squared displacement (MSD) of (d) a smooth nanoparticle, (e) a homogeneous nanoparticle that has a rough surface, (f) a Janus nanoparticle that has a rough surface in bulk dispersion and at an interface.
We further explored the effect of contact line pinning on the diffusion. The adsorption of nanoparticles at a liquid/liquid interface may cause local interfacial deformation at the triple line. Such deformation may be associated with the interfacial capillary waves, particle wettability, and particle size/weight.19,53 The wetting-driven interfacial deformations may drive the system to deviate from equilibrium. Thus far, the scenario involving contact line pinning of JNPs and its possible influence on the diffusion remain elusive. Thus, we exploit the DPD simulation to explore this effect in detail with appropriate nanoparticle models. Because the contact line pinning can be induced by surface defects,54 we constructed an HNP (Figure 2b) and a JNP (Figure 2c) that have a rough surface by stacking a bundle of DPD beads into a sphere. The integration of the sphere for motion and rotation is achieved by a rigid body method. If the DPD beads of different hemispheres were assigned to different values of αij (the parameter to determine the magnitude of the repulsive force between particles i and j), a JNP takes shape, as shown in Figure 2c. If αij of all DPD beads of the sphere is identical, the sphere is an HNP (Figure 2b). The presence of topographic caves could act as a free energy metastable minimum to transiently lock the three-phase contact line.27 Using such nanoparticle models, we successfully observed contact line pinning in a simulation run (Figure S5 in the Supporting Information), but this phenomenon did not cause a noticeable decrease in the diffusion coefficient. The resulting DDPD,||/DDPD,bulk of JNPs and HNPs was 0.91 and 0.92, as fit by the MSD data shown in Figure 2e. These results are consistent with recent simulation results,27 indicating that contact line fluctuation is likely not the key mechanism for the slowing down of JNPs at interfaces.
The failure of the aforementioned two models signified that these models overlooked a key feature causing an anomalous increase of the drag coefficient. Previous studies showed that the flexible polymer ligands grafted on a nanoparticle can control the nanoparticles’ properties at a water/oil interface.43,55−62 Inspired by these studies, we hypothesized that PEG deformation and reorientation on a JNP make the effective radius at an interface larger than the nominal one measured in bulk diffusion. Comparatively, PEG ligands on an HNP were expected to rearrange asymmetrically, because PEG collapses in oil.57 To test this hypothesis, we designed ligand-grafted model JNPs and HNPs. A group of DPD beads, denoted as type G, was stacked to form a sphere. A rigid body method was used to make the sphere a rigid object. We modeled the grafted PEG by a hybrid scheme involving two types of DPD beads, denoted as A and B, respectively. The group B, comprising three carbon and two oxygen atoms, is more hydrophilic than group A, which included four carbon atoms and one oxygen heavy atom (see Figure S1 in the Supporting Information for details). A 5 kg/mol PEG chain was modeled as a hybrid bead string that consisted of 42 beads: 28 A and 14 B. The 1-dodecane was modeled as a string of three A beads. To model a ligand-grafted Janus nanoparticle, 60 PEG chains were grafted on one hemisphere and 60 1-dodecane chains on the other. To model a ligand-grafted homogeneous nanoparticle, 120 PEG chains were grafted uniformly on the nanoparticle surface. The beads were connected via harmonic springs that are described in the Methods section with k = 4.0 and r0 = 0. The core of a ligand-grafted nanoparticle consisted of 192 beads to make the nanoparticle density comparable to that of the solvent matrix. The cutoff distance rc is 1. The pairwise conserve force parameters α are given in Table S2 in the Supporting Information.
Using this model, the simulation showed collapse of the PEG chain on the JNP and HNP surface in bulk solution (Figure 3a,c), mimicking the behavior of PEG in dichloromethane. After a JNP was adsorbed at a liquid/liquid interface, most of the PEG ligands were swollen and oriented parallel to the interface, and only a few remained in the bulk phase (Figure 3b). This is further demonstrated in Figure S7, which shows the one-dimensional radial density profile of a JNP in simulated bulk “water” and at a liquid/liquid interface. We found that the density profile in bulk water decays more rapidly than that at an interface, corroborating polymer swelling when a ligand-grafted JNP was adsorbed at a liquid/liquid interface. Next, we quantified the normalized one-dimensional PEG density profiles in the x- and z-directions and two-dimensional PEG density mapping of an adsorbed JNP and HNP at a liquid/liquid interface, as shown in Figure 3e–h. The mapping of the adsorbed JNP and HNP was taken along the transversal section of the Janus boundary and the three-phase contact line, respectively.
Figure 3.
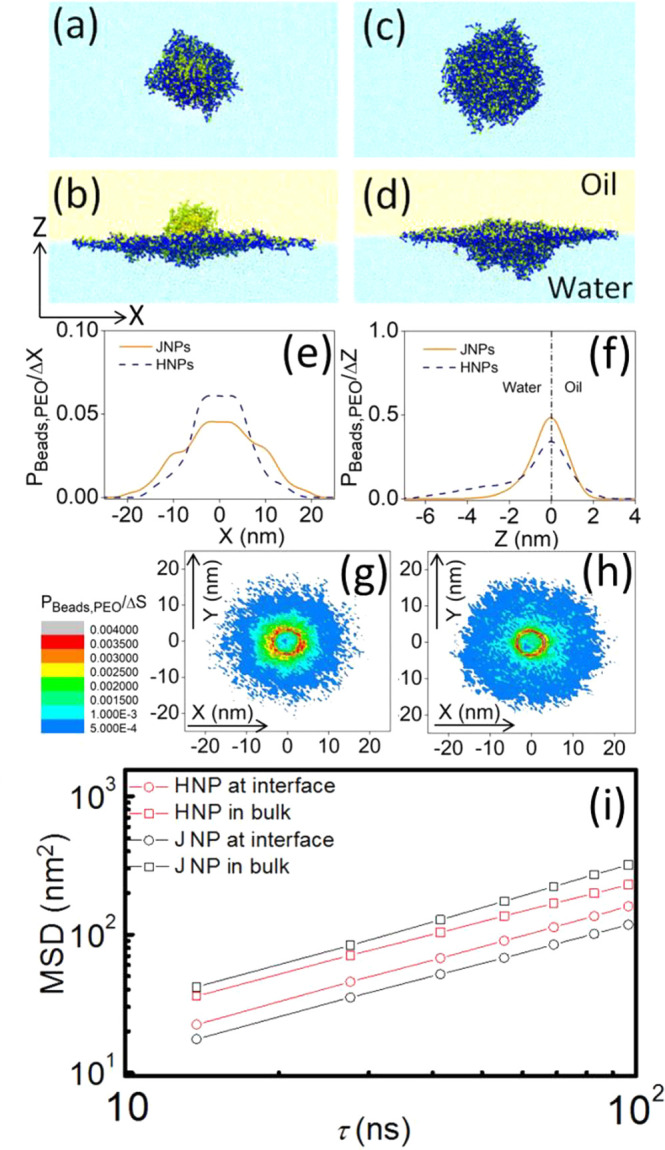
Snapshot of a ligand-grafted JNP (a) in bulk and (b) at an interface. Snapshot of a ligand-grafted HNP (c) in bulk and (d) at an interface. A coordinate near panel (b) denotes the x- and z-directions. Normalized one-dimensional PEG density profiles of adsorbed HNP and JNP at a liquid/liquid interface in (e) x- and (f) z-directions. Two-dimensional PEG density mapping of (g) adsorbed HNP and (h) JNP at a liquid/liquid interface. The mapping of the adsorbed JNP and HNP was taken along the transversal section of the Janus boundary and the three-phase contact line, respectively. (i) Mean squared displacement of JNPs and HNPs in bulk dispersion and at an interface.
We begin with the analysis of the one-dimensional PEG density profiles. For a JNP, the density profile in the z-direction is nearly symmetric and decays rapidly with the distance from the interface, indicating that most of PEG chains are enriched at the interfacial boundary. However, for HNPs, the density profile in the z-direction is asymmetric; it decays much more slowly than that found for JNPs in the simulated “water” phase, indicating that many PEG chains were still dispersed in the bulk “water” phase. The interfacial enrichment of grafted PEG on a JNP’s surface relative to an HNP’s surface (Figure 3d) causes a slower decay of the PEG density profile in the x-direction (Figure 3e) and a more extended interfacial occupation (Figure 3g,h). The enrichment may be attributed to the decreased steric interaction at the Janus boundary because only short ligands were grafted onto the other half of the particle.
Next, we calculated the MSDs and the diffusion coefficients of JNPs and HNPs in bulk dispersion and at an interface as shown in Figure 3i. The resulting DDPD,||/DDPD,bulk ≈ 0.72 for HNPs and DDPD,||/DDPD,bulk ≈ 0.35 for JNPs were in good agreement with the experimental FCS observations.
Taken together, these results confirm the hypothesis that PEG deformation and reorientation on the nanoparticles is the reason for the slower interfacial diffusion. Indeed, we found that on the HNP surface the PEG ligands are swollen only near the interface. The deformation of PEG ligands makes the nanoparticle adopt a stretched oblate shape, consistent with previous simulation results involving ligand-grafted and hydrogel-made nanoparticles at liquid/liquid interfaces.63−65 This causes overall a small increase in the effective radius (decrease in the diffusion coefficient) when an HNP moves from bulk to an interface. On other hand, for a JNP all surface ligands are swollen when it is adsorbed at an interface, resulting in a noticeable increase in the effective radius and thus slower interfacial diffusion.
To highlight further the significance of polymer conformation, we studied the effect of the relative sizes of the hard-core and the soft ligands on the interfacial diffusion. In doing so, we took ligand-grafted model JNPs as shown in Figure 3a,b; the length of hydrophobic ligands is deliberately set to be the same as that of PEG ligands on the other hemisphere. Using these model nanoparticles, we performed DPD simulation and calculated the DDPD,||/DDPD,bulk of JNPs and HNPs as a function of the PEG length. Due to the limitation of computational capability, the longest length of grafted PEG that we simulated was 15 kg/mol. We found that DDPD,||/DDPD,bulk of both JNPs and HNPs decreases monotonously with increasing the PEG length (Figure S9). Notability, values of DDPD,||/DDPD,bulk of JNPs are much smaller than that of HNPs over the studied range of PEG length. These results confirm that the surface ligands play a dominant role in the interfacial diffusion.
Variation of the Interfacial Tension Influences the Interfacial Diffusion
Despite having achieved excellent simulation–experiment consistency by taking the ligand flexibility into account, we sought to confirm that this model correctly captured the underlying mechanism rather than a phenomenological coincidence. The deformation of the polymer shell around the inorganic core of a nanoparticle is expected to be stronger at a water/oil interface of higher interfacial tension. This is because, at such an interface, the energy gain of extending the polymer chains is greater since more surface area can be covered.6 Therefore, decreasing the interfacial tension is expected to result in faster diffusion of ligand-grafted nanoparticles. This simple argument was confirmed by both experiments and simulations.
We first studied whether the interfacial tension can influence the surface activity of polymeric ligands by comparing the adsorption isotherm at water/octane and water/toluene interfaces, respectively. The viscosities of octane (0.54 cP) and toluene (0.59 cP) at 20 °C are comparable, but the interfacial tension of a water/octane interface (52 mN/m) far exceeds that of a water/toluene interface (36 mN/m). Therefore, we can isolate the effect of interfacial tension by directly comparing the behavior at these two interfaces. The surface excess Γ of the adsorbed component (PEG) can be calculated using the Gibbs equation:
| 3 |
Here, R, T, a, and γ are the molar gas constant, temperature, interfacial activity, and interfacial tension, respectively. Equation 3 shows that Γ is closely associated with ∂γ/∂a that is determined by the surface activity of individual adsorbents and the number of adsorbents in the dilute limit. As a rough approximation, we can replace the activity a with the surface concentration c with ∂γ/∂a ≈ Δγ/Δc. Therefore, to describe Γ of individual adsorbents, one could measure the gradient of the adsorption isotherm for c → 0.
Figure S8 shows experimental data of equilibrated interfacial tension versus the bulk PEG concentration for c → 0 at different interfaces. PEG can indeed lower the interfacial tension more efficiently at a water/octane interface than at a water/toluene interface. Applying a linear fit to the γ–c data, we found that values of Δγ/Δc are equal to 1.3 × 10⁷ and 4.3 × 10⁶ Nm–1 M–1 at water/octane and water/toluene interfaces, respectively. As expected, the value of Δγ/Δc obtained in the dilute limit is greater at a water/octane interface than at a water/toluene, evidently indicating that the interfacial tension could influence the surface excess of individual PEG chains. On one hand, these measurements verified that varying the interfacial tension can cause a change in the PEG conformation; on the other hand, the γ-dependent polymer conformational change can provide a means to examine whether the concept of polymer deformation is responsible for the interfacial slowdown.
Next, we performed FCS experiments to compare the diffusion of JNPs at water/octane and water/toluene interfaces. We found that the variation of interfacial tension did influence diffusion. ACCs at a water/toluene interface decay more rapidly than at a water/octane interface, reflecting an increase of D|| from 2.3 × 10⁻¹¹ to 3.6 × 10⁻¹¹ m2/s (Figure 4a). The DPD simulation showed a similar trend with decreasing the interfacial tension (Figure 4b). Taken together, these observations further indicated that polymer conformational change plays a dominant role in changing the D|| of JNPs.
Figure 4.

(a) Representative autocorrelation curves and their corresponding fits with eq 1 (solid lines) for JNPs at water/toluene (black squares) and water/octane (red circles) interfaces. (b) Simulated mean squared displacement versus lag time τ for ligand-grafted JNPs at interfaces with varying αOW (proportional to interfacial tension).
Conclusions
In summary, we used fluorescence correlation spectroscopy to measure and directly compare the translational diffusion of ligand-grafted JNPs and HNPs at water/oil interfaces. We found that the Janus character, originating from ligand asymmetry, can influence interfacial diffusion. D|| of JNPs was smaller than D|| of HNPs. Stepwise analysis using the DPD simulation revealed that these phenomena can be understood in the framework of normal Brownian motion. The polymeric ligands on a nanoparticle surface were deformed and oriented so that they occupy more surface area than the rigid particle, resulting in a larger effective radius than the nominal RH obtained by measuring the diffusion in bulk solution. These results indicate that the Janus ligand arrangement not only strengthens adhesion to the interface as found previously but also affects interfacial diffusion.
Methods
Janus and Homogeneous Nanoparticles
Thiol-terminated PEG, with a mean molecular weight of 5 kg/mol, was crystallized into lamellar single crystals that were able to adsorb native quantum dots. The side that had contact with the single crystals was grafted with PEG via the ligand exchange reaction. Next, 1-dodecanethiol was added to replace the oleate ligands on the quantum dots’ surface that was not covered by the PEG. The surface of a resulting Janus nanoparticle was, therefore, compartmentalized by two portions that had ligands of opposite wettabilities. For comparison, chemically homogeneous nanoparticles were prepared by functionalizing quantum dots with thiol-terminated PEG on the whole surface via the ligand exchange reaction.
Sample Preparation for the FCS Studies
The source and purification of water and alkane are described in the Supporting Information. The water/n-alkane interfaces were prepared in an Attofluor cell chamber (Invitrogen, Leiden, Netherlands) equipped with a 150 μm thick microscope cover glass slide as the bottom. An aluminum foil O-ring with an inner diameter of 0.5 cm and a thickness of approximately 0.3 mm was glued on the glass slide to restrict the sample volume for the aqueous phase. To prepare a water/n-alkane interface suspended with nanoparticles, a defined amount of water was added into the cell. Then we added a nanoparticle dichloromethane solution on top of the aqueous solution. The dichloromethane was allowed to evaporate for typically 15 s. Finally, alkane was added carefully on top of the water surface. The resulting surface coverage of tracer nanoparticles was around 1–2 μm2 per particle.
Fluorescence Correlation Spectroscopy
FCS measurements were conducted on a commercial setup comprising the module ConfoCor2 and an Axiovert 200 inverted microscope. The fluorescent particles were excited by an Ar laser (488 nm) focused by a water immersion microscope objective (C-Apochromat 40×, NA 1.2, Carl Zeiss, Germany). The fluorescent light was collected by the same objective, passed a LP530 long-pass emission filter and a confocal pinhole, and was finally directed to an avalanche photodiode detector that enabled single-photon counting. This arrangement resulted in the formation of a confocal detection volume Vd around the laser focus. The detection volume has a 3D Gaussian shape and typical dimensions of ∼200–250 nm in the radial direction and 1–1.5 μm in the axial direction. Only the fluorescence originating from species within Vd can be delivered to and detected by the avalanche photodiode detector.
For each measurement, more than 20 independent autocorrelation curves were recorded on different days. The experiments were repeated at least three times on different days with freshly prepared samples, and the experimental uncertainty was less than 10%.
Description of the DPD Method
We employed a computational DPD method to investigate the diffusion of nanoparticles. The DPD method was proven to be an effective mesoscopic simulation tool to study events occurring on millisecond time scales and micrometer length scales via tracking the motion of coarse-grained particles (composed of a group of atoms or molecules). The fundamental equation in the DPD method is the Newton’s equation of motion. For a particle i, each DPD bead is subjected to three types of forces described as follows:
| 4 |
where F⃗ijC, F⃗ij, and F⃗ijD are the conservative force, the pairwise random force, and the dissipative force, respectively. The force acting on a particle is summed over all interbead forces between particles i and j. The conservative force is weakly repulsive and given by
 |
5 |
where rij is the distance between particles i and j, rij = |r⃗ij| = |r⃗i – r⃗j|, e⃗ij = r⃗ij/rij. Here, αij is a parameter to determine the magnitude of the repulsive force between particles i and j, and rc is the cutoff distance. Random force (F⃗ijR) and dissipative force (F⃗ij) are given by
 |
6 |
where v⃗ij = v⃗i – v⃗j, σ is the noise parameter, γ is the friction parameter, and ζij is the random number based on the Gaussian distribution. Here ωR and ωD are rij-dependent weight functions, which are given by
 |
7 |
The temperature is controlled by a combination of dissipative and random forces. The noise parameter σ and friction parameter γ are connected to each other by the fluctuation–dissipation theorem in the following equation:
| 8 |
where T is the temperature and kB is the Boltzmann constant.
The spring force (F⃗ijS) between two bonded particles was given by
| 9 |
where k is the spring constant and r0 is the equilibrium bond distance.
Acknowledgments
This work was supported by the National Natural Science Foundation of China (Grants Nos. 21873094, 21833008, 21790344), International Science and Technology Cooperation Program of Jilin, China (Grant No. 20180414007GH), the Scientific Instrument Developing Project of the Chinese Academy of Sciences (Grant No. YJKYYQ20190084), and Key Research Program of Frontier Sciences, Chinese Academy of Sciences (Grants Nos. ZDBS-LY-SLH033 and QYZDY-SSW-SLH027).
Supporting Information Available
The Supporting Information is available free of charge at https://pubs.acs.org/doi/10.1021/acsnano.0c03291.
Additional material information, procedure to rule out the effect of contamination; details of dissipative particle dynamics simulations; effect of interfacial tension on interfacial diffusion; spatial-dependent diffusion coefficient as a function of proximity to the liquid/liquid interface; contact line pinning of rough nanoparticles; Figures S6–S9 (PDF)
Author Contributions
⊥ D.W. and Y.Z. contributed equally to this work.
The authors declare no competing financial interest.
Supplementary Material
References
- Bleibel J.; Domínguez A.; Oettel M. Colloidal Particles at Fluid Interfaces: Effective Interactions, Dynamics and a Gravitation-Like Instability. Eur. Phys. J.: Spec. Top. 2013, 222, 3071–3087. 10.1140/epjst/e2013-02076-9. [DOI] [Google Scholar]
- Shi S.; Russell T. P. Nanoparticle Assembly at Liquid-Liquid Interfaces: From the Nanoscale to Mesoscale. Adv. Mater. 2018, 30, e1800714 10.1002/adma.201800714. [DOI] [PubMed] [Google Scholar]
- Rezvantalab H.; Shojaei-Zadeh S. Capillary Interactions between Spherical Janus Particles at Liquid–Fluid Interfaces. Soft Matter 2013, 9, 3640–3650. 10.1039/c3sm27380f. [DOI] [Google Scholar]
- Park B. J.; Lee D. Equilibrium Orientation of Nonspherical Janus Particles at Fluid-Fluid Interfaces. ACS Nano 2012, 6, 782–790. 10.1021/nn204261w. [DOI] [PubMed] [Google Scholar]
- Rezvantalab H.; Drazer G.; Shojaei-Zadeh S. Molecular Simulation of Translational and Rotational Diffusion of Janus Nanoparticles at Liquid Interfaces. J. Chem. Phys. 2015, 142, 014701 10.1063/1.4904549. [DOI] [PubMed] [Google Scholar]
- Binks B. P.; Fletcher P. D. I. Particles Adsorbed at the Oil-Water Interface: A Theoretical Comparison between Spheres of Uniform Wettability and ″Janus″ Particles. Langmuir 2001, 17, 4708–4710. 10.1021/la0103315. [DOI] [Google Scholar]
- Glaser N.; Adams D. J.; Boker A.; Krausch G. Janus Particles at Liquid-Liquid Interfaces. Langmuir 2006, 22, 5227–5229. 10.1021/la060693i. [DOI] [PubMed] [Google Scholar]
- Cheung D. L.; Bon S. A. F. Stability of Janus Nanoparticles at Fluid Interfaces. Soft Matter 2009, 5, 3969–3976. 10.1039/b908462b. [DOI] [Google Scholar]
- Luu X. C.; Yu J.; Striolo A. Nanoparticles Adsorbed at the Water/Oil Interface: Coverage and Composition Effects on Structure and Diffusion. Langmuir 2013, 29, 7221–7228. 10.1021/la304828u. [DOI] [PubMed] [Google Scholar]
- Fernandez-Rodriguez M. A.; Song Y.; Rodríguez-Valverde M. A. N.; Chen S.; Cabrerizo-Vilchez M. A.; Hidalgo-Alvarez R. Comparison of the Interfacial Activity between Homogeneous and Janus Gold Nanoparticles by Pendant Drop Tensiometry. Langmuir 2014, 30, 1799–1804. 10.1021/la404194e. [DOI] [PubMed] [Google Scholar]
- Ruhland T. M.; Groschel A. H.; Ballard N.; Skelhon T. S.; Walther A.; Muller A. H. E.; Bon S. A. F. Influence of Janus Particle Shape on Their Interfacial Behavior at Liquid-Liquid Interfaces. Langmuir 2013, 29, 1388–1394. 10.1021/la3048642. [DOI] [PubMed] [Google Scholar]
- Park B. J.; Brugarolas T.; Lee D. Janus Particles at an Oil-Water Interface. Soft Matter 2011, 7, 6413–6417. 10.1039/c1sm05460k. [DOI] [Google Scholar]
- Fernandez-Rodriguez M. A.; Rodriguez-Valverde M. A.; Cabrerizo-Vilchez M. A.; Hidalgo-Alvarez R. Surface Activity of Janus Particles Adsorbed at Fluid-Fluid Interfaces: Theoretical and Experimental Aspects. Adv. Colloid Interface Sci. 2016, 233, 240–254. 10.1016/j.cis.2015.06.002. [DOI] [PubMed] [Google Scholar]
- Kaz D. M.; McGorty R.; Mani M.; Brenner M. P.; Manoharan V. N. Physical Ageing of the Contact Line on Colloidal Particles at Liquid Interfaces. Nat. Mater. 2012, 11, 138–142. 10.1038/nmat3190. [DOI] [PubMed] [Google Scholar]
- Wang A.; Rogers W. B.; Manoharan V. N. Effects of Contact-Line Pinning on the Adsorption of Nonspherical Colloids at Liquid Interfaces. Phys. Rev. Lett. 2017, 119, 108004. 10.1103/PhysRevLett.119.108004. [DOI] [PubMed] [Google Scholar]
- Wang D.; Yordanov S.; Paroor H. M.; Mukhopadhyay A.; Li C. Y.; Butt H. J.; Koynov K. Probing Diffusion of Single Nanoparticles at Water-Oil Interfaces. Small 2011, 7, 3502–3507. 10.1002/smll.201101823. [DOI] [PubMed] [Google Scholar]
- Stocco A.; Mokhtari T.; Haseloff G.; Erbe A.; Sigel R. Evanescent-Wave Dynamic Light Scattering at an Oil-Water Interface: Diffusion of Interface-Adsorbed Colloids. Phys. Rev. E 2011, 83, 011601 10.1103/PhysRevE.83.011601. [DOI] [PubMed] [Google Scholar]
- Du K.; Liddle J. A.; Berglund A. J. Three-Dimensional Real-Time Tracking of Nanoparticles at an Oil-Water Interface. Langmuir 2012, 28, 9181–9188. 10.1021/la300292r. [DOI] [PubMed] [Google Scholar]
- Boniello G.; Blanc C.; Fedorenko D.; Medfai M.; Mbarek N. B.; In M.; Gross M.; Stocco A.; Nobili M. Brownian Diffusion of a Partially Wetted Colloid. Nat. Mater. 2015, 14, 908–911. 10.1038/nmat4348. [DOI] [PubMed] [Google Scholar]
- Nelson A.; Wang D. P.; Koynov K.; Isa L. A Multiscale Approach to the Adsorption of Core-Shell Nanoparticles at Fluid Interfaces. Soft Matter 2015, 11, 118–129. 10.1039/C4SM01881H. [DOI] [PubMed] [Google Scholar]
- Boniello G.; Stocco A.; Gross M.; In M.; Blanc C.; Nobili M. Translational Viscous Drags of an Ellipsoid Straddling an Interface between Two Fluids. Phys. Rev. E: Stat. Phys., Plasmas, Fluids, Relat. Interdiscip. Top. 2016, 94, 012602 10.1103/PhysRevE.94.012602. [DOI] [PubMed] [Google Scholar]
- Ortega F.; Ritacco H.; Rubio R. G. Interfacial Microrheology: Particle Tracking and Related Techniques. Curr. Opin. Colloid Interface Sci. 2010, 15, 237–245. 10.1016/j.cocis.2010.03.001. [DOI] [Google Scholar]
- Wang X.; In M.; Blanc C.; Wurger A.; Nobili M.; Stocco A. Janus Colloids Actively Rotating on the Surface of Water. Langmuir 2017, 33, 13766–13773. 10.1021/acs.langmuir.7b02353. [DOI] [PubMed] [Google Scholar]
- Stocco A.; Chollet B.; Wang X.; Blanc C.; Nobili M. Rotational Diffusion of Partially Wetted Colloids at Fluid Interfaces. J. Colloid Interface Sci. 2019, 542, 363–369. 10.1016/j.jcis.2019.02.017. [DOI] [PubMed] [Google Scholar]
- Zhong Y.; Zhao L.; Tyrlik P. M.; Wang G. Investigating Diffusing on Highly Curved Water–Oil Interface Using Three-Dimensional Single Particle Tracking. J. Phys. Chem. C 2017, 121, 8023–8032. 10.1021/acs.jpcc.7b01721. [DOI] [Google Scholar]
- Song Y.; Luo M.; Dai L. L. Understanding Nanoparticle Diffusion and Exploring Interfacial Nanorheology Using Molecular Dynamics Simulations. Langmuir 2010, 26, 5–9. 10.1021/la901902t. [DOI] [PubMed] [Google Scholar]
- Koplik J.; Maldarelli C. Diffusivity and Hydrodynamic Drag of Nanoparticles at a Vapor-Liquid Interface. Phys. Rev. Fluids 2017, 2, 024303 10.1103/PhysRevFluids.2.024303. [DOI] [Google Scholar]
- Colosqui C. E.; Morris J. F.; Koplik J. Colloidal Adsorption at Fluid Interfaces: Regime Crossover from Fast Relaxation to Physical Aging. Phys. Rev. Lett. 2013, 111, 028302 10.1103/PhysRevLett.111.028302. [DOI] [PubMed] [Google Scholar]
- Razavi S.; Kretzschmar I.; Koplik J.; Colosqui C. E. Nanoparticles at Liquid Interfaces: Rotational Dynamics and Angular Locking. J. Chem. Phys. 2014, 140, 014904 10.1063/1.4849135. [DOI] [PubMed] [Google Scholar]
- Wang D. P.; Hu R. F.; Skaug M. J.; Schwartz D. K. Temporally Anticorrelated Motion of Nanoparticles at a Liquid Interface. J. Phys. Chem. Lett. 2015, 6, 54–59. 10.1021/jz502210c. [DOI] [PubMed] [Google Scholar]
- Megens M.; Aizenberg J. Like-Charged Particles at Liquid Interfaces. Nature 2003, 424, 1014–1014. 10.1038/4241014a. [DOI] [PubMed] [Google Scholar]
- Wang B.; Li B.; Zhao B.; Li C. Y. Amphiphilic Janus Gold Nanoparticles via Combining ″Solid-State Grafting-To″ and ″Grafting-From″ Methods. J. Am. Chem. Soc. 2008, 130, 11594–11595. 10.1021/ja804192e. [DOI] [PubMed] [Google Scholar]
- Cristofolini L.; Orsi D.; Isa L. Characterization of the Dynamics of Interfaces and of Interface-Dominated Systems via Spectroscopy and Microscopy Techniques. Curr. Opin. Colloid Interface Sci. 2018, 37, 13–32. 10.1016/j.cocis.2018.06.001. [DOI] [Google Scholar]
- Yang J.; Zhao J.; Han C. C. Lateral Mobility of Single Chains at a Liquid Polymer Interface. Macromolecules 2008, 41, 7284–7286. 10.1021/ma8015135. [DOI] [Google Scholar]
- Papadakis C. M.; Košovan P.; Richtering W.; Wöll D. Polymers in Focus: Fluorescence Correlation Spectroscopy. Colloid Polym. Sci. 2014, 292, 2399–2411. 10.1007/s00396-014-3374-x. [DOI] [Google Scholar]
- Koynov K.; Butt H.-J. Fluorescence Correlation Spectroscopy in Colloid and Interface Science. Curr. Opin. Colloid Interface Sci. 2012, 17, 377–387. 10.1016/j.cocis.2012.09.003. [DOI] [Google Scholar]
- Niu Q.; Wang D. Probing the Polymer Anomalous Dynamics at Solid/Liquid Interfaces at the Single-Molecule Level. Curr. Opin. Colloid Interface Sci. 2019, 39, 162–172. 10.1016/j.cocis.2019.01.015. [DOI] [Google Scholar]
- Wang D.; Pevzner L.; Li C.; Peneva K.; Li C. Y.; Chan D. Y.; Müllen K.; Mezger M.; Koynov K.; Butt H.-J. Layer with Reduced Viscosity at Water-Oil Interfaces Probed by Fluorescence Correlation Spectroscopy. Phys. Rev. E 2013, 87, 012403 10.1103/PhysRevE.87.012403. [DOI] [PubMed] [Google Scholar]
- Dörr A.; Hardt S.; Masoud H.; Stone H. A. Drag and Diffusion Coefficients of a Spherical Particle Attached to a Fluid-Fluid Interface. J. Fluid Mech. 2016, 790, 607–618. 10.1017/jfm.2016.41. [DOI] [Google Scholar]
- Isa L.; Samudrala N.; Dufresne E. R. Adsorption of Sub-Micron Amphiphilic Dumbbells to Fluid Interfaces. Langmuir 2014, 30, 5057–5063. 10.1021/la500463m. [DOI] [PubMed] [Google Scholar]
- Schellenberger F.; Papadopoulos P.; Kappl M.; Weber S. A.; Vollmer D.; Butt H.-J. Detaching Microparticles from a Liquid Surface. Phys. Rev. Lett. 2018, 121, 048002 10.1103/PhysRevLett.121.048002. [DOI] [PubMed] [Google Scholar]
- Du K.; Glogowski E.; Emrick T.; Russell T. P.; Dinsmore A. D. Adsorption Energy of Nano- and Microparticles at Liquid-Liquid Interfaces. Langmuir 2010, 26, 12518–12522. 10.1021/la100497h. [DOI] [PubMed] [Google Scholar]
- Wang D.; Hu R.; Mabry J. N.; Miao B.; Wu D. T.; Koynov K.; Schwartz D. K. Scaling of Polymer Dynamics at an Oil-Water Interface in Regimes Dominated by Viscous Drag and Desorption-Mediated Flights. J. Am. Chem. Soc. 2015, 137, 12312–12320. 10.1021/jacs.5b07108. [DOI] [PubMed] [Google Scholar]
- Hua X.; Bevan M. A.; Frechette J. Reversible Partitioning of Nanoparticles at an Oil-Water Interface. Langmuir 2016, 32, 11341–11352. 10.1021/acs.langmuir.6b02255. [DOI] [PubMed] [Google Scholar]
- Danov K. D.; Dimova R.; Pouligny B. Viscous Drag of a Solid Sphere Straddling a Spherical or Flat Surface. Phys. Fluids 2000, 12, 2711–2722. 10.1063/1.1289692. [DOI] [Google Scholar]
- Fischer T. M.; Dhar P.; Heinig P. The Viscous Drag of Spheres and Filaments Moving in Membranes or Monolayers. J. Fluid Mech. 2006, 558, 451–475. 10.1017/S002211200600022X. [DOI] [Google Scholar]
- Pozrikidis C. Particle Motion near and inside an Interface. J. Fluid Mech. 2007, 575, 333. 10.1017/S0022112006004046. [DOI] [Google Scholar]
- Blawzdziewicz J.; Ekiel-Jezewska M. L.; Wajnryb E. Hydrodynamic Coupling of Spherical Particles to a Planar Fluid-Fluid Interface: Theoretical Analysis. J. Chem. Phys. 2010, 133, 114703. 10.1063/1.3475217. [DOI] [PubMed] [Google Scholar]
- Dani A.; Keiser G.; Yeganeh M.; Maldarelli C. Hydrodynamics of Particles at an Oil-Water Interface. Langmuir 2015, 31, 13290–13302. 10.1021/acs.langmuir.5b02146. [DOI] [PubMed] [Google Scholar]
- Blawzdziewicz J.; Ekiel-Jezewska M. L.; Wajnryb E. Motion of a Spherical Particle near a Planar Fluid-Fluid Interface: The Effect of Surface Incompressibility. J. Chem. Phys. 2010, 133, 114702. 10.1063/1.3475197. [DOI] [PubMed] [Google Scholar]
- Ma X.; Chen W.; Wang Z.; Peng Y.; Han Y.; Tong P. Test of the Universal Scaling Law of Diffusion in Colloidal Monolayers. Phys. Rev. Lett. 2013, 110, 078302 10.1103/PhysRevLett.110.078302. [DOI] [PubMed] [Google Scholar]
- Zhu Y. L.; Liu H.; Li Z. W.; Qian H. J.; Milano G.; Lu Z. Y. GALAMOST: GPU-Accelerated Large-Scale Molecular Simulation Toolkit. J. Comput. Chem. 2013, 34, 2197–2211. 10.1002/jcc.23365. [DOI] [PubMed] [Google Scholar]
- Danov K. D.; Kralchevsky P. A.; Naydenov B. N.; Brenn G. Interactions between Particles with an Undulated Contact Line at a Fluid Interface: Capillary Multipoles of Arbitrary Order. J. Colloid Interface Sci. 2005, 287, 121–134. 10.1016/j.jcis.2005.01.079. [DOI] [PubMed] [Google Scholar]
- Colosqui C. E.; Morris J. F.; Koplik J. Colloidal Adsorption at Fluid Interfaces: Regime Crossover from Fast Relaxation to Physical Aging. Phys. Rev. Lett. 2013, 111, 028302 10.1103/PhysRevLett.111.028302. [DOI] [PubMed] [Google Scholar]
- Tay K. A.; Bresme F. Wetting Properties of Passivated Metal Nanocrystals at Liquid-Vapor Interfaces: A Computer Simulation Study. J. Am. Chem. Soc. 2006, 128, 14166–14175. 10.1021/ja061901w. [DOI] [PubMed] [Google Scholar]
- Kim J. U.; Matsen M. W. Positioning Janus Nanoparticles in Block Copolymer Scaffolds. Phys. Rev. Lett. 2009, 102, 078303 10.1103/PhysRevLett.102.078303. [DOI] [PubMed] [Google Scholar]
- Ranatunga R. J. K. U.; Kalescky R. J. B.; Chiu C. C.; Nielsen S. O. Molecular Dynamics Simulations of Surfactant Functionalized Nanoparticles in the Vicinity of an Oil/Water Interface. J. Phys. Chem. C 2010, 114, 12151–12157. 10.1021/jp105355y. [DOI] [Google Scholar]
- Isa L.; Amstad E.; Schwenke K.; Del Gado E.; Ilg P.; Kroger M.; Reimhult E. Adsorption of Core-Shell Nanoparticles at Liquid-Liquid Interfaces. Soft Matter 2011, 7, 7663–7675. 10.1039/c1sm05407d. [DOI] [Google Scholar]
- Li Z.; Geisel K.; Richtering W.; Ngai T. Poly (N-Isopropylacrylamide) Microgels at the Oil-Water Interface: Adsorption Kinetics. Soft Matter 2013, 9, 9939–9946. 10.1039/c3sm52168k. [DOI] [Google Scholar]
- Garbin V.; Jenkins I.; Sinno T.; Crocker J. C.; Stebe K. J. Interactions and Stress Relaxation in Monolayers of Soft Nanoparticles at Fluid-Fluid Interfaces. Phys. Rev. Lett. 2015, 114, 108301. 10.1103/PhysRevLett.114.108301. [DOI] [PubMed] [Google Scholar]
- Geisel K.; Rudov A. A.; Potemkin I. I.; Richtering W. Hollow and Core-Shell Microgels at Oil-Water Interfaces: Spreading of Soft Particles Reduces the Compressibility of the Monolayer. Langmuir 2015, 31, 13145–13154. 10.1021/acs.langmuir.5b03530. [DOI] [PubMed] [Google Scholar]
- Vasudevan S. A.; Rauh A.; Kroger M.; Karg M.; Isa L. Dynamics and Wetting Behavior of Core-Shell Soft Particles at a Fluid-Fluid Interface. Langmuir 2018, 34, 15370–15382. 10.1021/acs.langmuir.8b03048. [DOI] [PubMed] [Google Scholar]
- Schwenke K.; Isa L.; Cheung D. L.; Del Gado E. Conformations and Effective Interactions of Polymer-Coated Nanoparticles at Liquid Interfaces. Langmuir 2014, 30, 12578–12586. 10.1021/la503379z. [DOI] [PubMed] [Google Scholar]
- Lane J. M. D.; Grest G. S. Spontaneous Asymmetry of Coated Spherical Nanoparticles in Solution and at Liquid-Vapor Interfaces. Phys. Rev. Lett. 2010, 104, 235501. 10.1103/PhysRevLett.104.235501. [DOI] [PubMed] [Google Scholar]
- Camerin F.; Fernandez-Rodriguez M. A.; Rovigatti L.; Antonopoulou M.-N.; Gnan N.; Ninarello A.; Isa L.; Zaccarelli E. Microgels Adsorbed at Liquid-Liquid Interfaces: A Joint Numerical/Experimental Study. ACS Nano 2019, 13, 4548–4559. 10.1021/acsnano.9b00390. [DOI] [PubMed] [Google Scholar]
Associated Data
This section collects any data citations, data availability statements, or supplementary materials included in this article.