

Abstract
The National Institute for Occupational Safety and Health (NIOSH) and the former U.S. Bureau of Mines (USBM) have given a significant effort over the past four decades in researching and developing engineering controls and interventions to reduce mine workers’ dust exposures during the bagging and palletizing of industrial minerals. Workers performing manual bagging and palletizing of 50- to 100-pound bags typically have some of the highest dust exposures of all workers at mining and mineral processing operations. This paper will provide an overview of available dust control technologies for bagging operations and present the findings of a recent case study that was conducted at four different industrial sand operations to identify the current types of bagging and palletizing technologies being used and to evaluate their effectiveness in reducing workers’ exposures to respirable crystalline silica dust. An evaluation will also be performed to determine if further reductions in respirable dust levels can be achieved by incorporating additional modifications or improvements into the existing technology.
Keywords: Respirable crystalline silica dust, Engineering controls, Bagging, Palletizing
1. Introduction
Worker overexposure to dust, especially respirable dust containing crystalline silica, has long been a serious concern for the health of our nation’s miners. Silicosis, the most common disease associated with respirable crystalline silica overexposure, is an incurable and often fatal lung disease that can develop in any three forms depending on concentration and exposure duration [1]:
Chronic: resulting from long-term excessive exposures (first clinically apparent 10–30 years after first exposure);
Accelerated: resulting from exposures to higher concentrations of crystalline silica (first clinically apparent 5–10 years after the initial exposure);
Acute: resulting from exposures to unusually high concentrations of crystalline silica (clinically apparent within weeks to 5 years after the initial exposure).
In the USA, all industries are federally regulated by the U.S. Department of Labor (DOL). Within the DOL, the mining industry is regulated by the U.S. Mine Safety and Health Administration (MSHA), and the construction, agriculture, and oil and gas industries (among others) are regulated by the U.S. Occupational Safety and Health Administration (OSHA). These organizations establish exposure limits that are enforceable under federal law. In metal and nonmetal mines, crystalline silica is one of two substances for which MSHA has a respirable dust standard. The threshold limit value (TLV) for dust containing respirable crystalline silica is dependent on the amount of quartz (the most common form of respirable crystalline silica) present in the dust (%Q). MSHA uses the following formula to calculate a respirable dust TLV based upon the quartz content [2]:
In June 2016, OSHA implemented a new comprehensive respirable crystalline silica standard reducing the 8-h, time-weighted average (TWA) permissible exposure limit (PEL) to 50 μg/m3 with an action level (AL) of 25 μg/m3 [3]. This standard requires employers to use engineering and work practice controls to reduce exposures to respirable crystalline silica to below the PEL. Where engineering controls are not feasible or the implemented controls cannot reduce exposures below the PEL, the employer must provide respiratory protection. Finally, this standard requires employers to offer medical exams to workers with exposures above the AL.
Other organizations, such as NIOSH and the American Conference of Governmental Industrial Hygienists (ACGIH), establish recommended exposure limits (RELs). These limits are not enforceable and do not take into consideration economical or technical feasibility; rather, they use research and epidemiological-based studies to set limits to best protect human health. NIOSH has a REL for respirable crystalline silica dating back 1974 of 50 μg/m3, as a TWA for up to 10 h/day during a 40-h week [4].
2. Background
At industrial sand mining operations, the process of loading product into various types of bags is called “bagging.” The stacking of these bags of product onto pallets for shipment to customers is typically called “palletizing.” Both the bagging and palletizing process can be performed manually or through some type of semi-automated or fully automated process. Workers performing manual bagging and palletizing tasks typically have some of the highest respirable dust exposures of all workers at mining and mineral processing operations. NIOSH and the former USBM have given a significant effort in past research to develop engineering controls and interventions designed to reduce mine workers’ dust exposures during the bagging and palletizing of mineral products.
2.1. Dust Sources During Bagging Operations
There are two different types of bags used when bagging and palletizing 50- to 100-pound bags: open-top and valve (closed bag with an internal valve). Open-top bags are slid over the loading spout and filled with a product which is typically larger in size. Dust sources associated with open-top bags are leakage from the loading spout once the bag is removed and liberation from the open bag before it is sealed, sewn, or tied. Because of the larger-sized particles, dust generated from open-top bags is typically not as significant as with valve bags. Valve bags have an internal sleeve through which the fill nozzle is inserted prior to the bag being filled with product. Once the bag is filled and it falls from the fill station, the weight and volume of the product inside the bag forces the valve to close. One major dust source associated with valve bags is product blowback during bag filling. During the filling process, the inside of the bag becomes pressurized by the fluidizing air used to carry the product. This pressure is relieved by air and product flowing back out through the bag valve. Another major dust source is product continuing to flow from the fill nozzle and from the bag valve as the bag is ejected from the filling machine, also known as a “rooster tail.” Product blowback and product “rooster tail” during the filling and ejection process often contaminate the outside of the bags, causing another significant source of dust exposure during palletizing and downstream handling. Figure 1 shows these major sources of dust during the filling process of valve bags.
Fig. 1.

Major sources of dust during valve bag filling. Left: Product “rooster tail.” Top right: Product blowback. Bottom right: contaminated bag
2.2. Dust Control During Bagging Operations
Early investigations conducted by NIOSH/USBM focused on ventilation, modification of equipment used, and improved housekeeping practices to reduce workers’ dust exposures during bagging and palletizing operations [5, 6]. This led to the development of multiple control technologies to reduce respirable dust during the manual filling of 50- to 100-pound bags, including bag valve type [7], a dual-nozzle bagging system which utilizes an inner fill nozzle combined with an outer exhaust nozzle (Fig. 2) [8, 9], and an overhead air supply island system (OASIS) designed to deliver an envelope of clean, filtered air to the bag operator (Fig. 3) [10].
Fig. 2.

Dual-nozzle bagging system. Left: Diagram of overall system components. Right: Close-up of a dual nozzle with an inner product fill nozzle and outer exhaust nozzle
Fig. 3.

Overhead air supply island system (OASIS). Left: diagram of system components. Right: OASIS positioned over bag operator
NIOSH/USBM has also developed control technologies to reduce workers’ dust exposures during the bag palletizing process. These include a bag and belt cleaning device (B&BCD) designed to reduce the amount of dust escaping from bags as they travel from the bag loading station to the palletizing station [11, 12], a semi-automated bag palletizing system which utilizes a hydraulic lift table in conjunction with a local exhaust ventilation (LEV) system (Fig. 4) [13, 14], and the use of an OASIS system positioned above the bag palletizing station (Fig. 5) [15].
Fig. 4.

Semi-automated bag palletizing system with lift table for ergonomic stacking and push-pull ventilation system
Fig. 5.

Semi-automated bag palletizing system with OASIS and exhaust ventilation
All these control technologies and many more are detailed in NIOSH’s second edition of the Dust Control Handbook for Industrial Minerals Mining and Processing [16]. (A downloadable version of this handbook is available at https://www.cdc.gov/niosh/mining/works/coversheet2094.html.)
3. Experimental Design
A recent case study was conducted at four individual industrial sand mining operations to identify the current types of bagging and palletizing technology being used and to evaluate the effectiveness of these implemented engineering controls in reducing workers’ exposures to respirable dust. An array of dust sampling packages were placed at key locations throughout the bagging operations to provide a valid representation of the amount of dust generated. The sampling packages used to collect dust concentrations consisted of a Thermo Scientific pDR-1000 instantaneous respirable dust monitor collocated with three gravimetric samplers (Fig. 6). The pDR-1000 uses light-scattering technology to provide instantaneous readings ranging from 0.001 to 400 mg/m3. The monitors were set to take respirable dust reading every 10 s which was stored in an internal data logger and downloaded onto a computer. The gravimetric assemblies consisted of a 1.7-L/min sampling pump, a 10-mm Dorr-Oliver cyclone assembly, and a 37-mm, 5-μm PVC filter. The gravimetric samples were analyzed using the NIOSH 0600 analytical method [17]. Sampling times at each location ranged from approximately 200 to 450 min. Light-scattering readings can be influenced by factors such as particle composition, particle size distribution, and moisture in the air; therefore, a recommended correction factor was calculated based upon the ratio of the average concentration of the three gravimetric samples and the average pDR-1000 concentration collected during the same sampling period [18]. This correction factor was then applied to the individual pDR-100 data (Fig. 7).
Fig. 6.

Example of sampling racks with one pDR-1000 and three gravimetric sampling assemblies, including a sampling pump, a respirable dust cyclone, and a 37-mm filter cassette
Fig. 7.

Example of gravimetric corrected pDR-1000 dust concentrations at a single location
4. Operation 1
The first evaluation was performed at an industrial sand plant in Ohio whose operations consisted of manual bagging and palletizing of 50-pound bags as well as an outdoor bulk bagging bay. The manual bagging is conducted using four dual-nozzle systems with individual LEV hoods located above each nozzle (Fig. 8). The bags are manually placed on the nozzles and, once filled, drop onto a conveyor and are transferred to an elevated palletizing station. The bags are palletized and lowered to an automated plastic wrapping station. The bulk bags are filled by raising an empty bag and liner on a forklift underneath the product hopper and loading spout (Fig. 8). Eight locations were sampled for total dust concentrations throughout the operation over a period of 2 days: (1) at the start of and (2) end of the manual bagging station, near where the operator stands; (3) at the end of the manual bagging station below the conveyor (low); (4) at the elevated palletizing station where bags are being placed on the pallets (high); (5) at the palletizing station once the pallets are fully stacked (low); and at the (6) right, (7) center, and (8) left of the outdoor bulk bagging bay. The same locations were used for both days.
Fig. 8.

Left: Manual bagging station with overhead LEV system. Right: Bulk bagging operation
A follow-up visit was conducted at operation 1 approximately 2 months later. Sampling was conducted over 2 days in approximately the same locations as the first visit. Inclement weather did not allow the outside bulk bagging bay to be sampled during this follow-up visit. There was also a handling error while switching gravimetric filters; therefore, the data at four locations for day 2 were not able to be used.
4.1. Operation 1 Results
Figure 9 displays the average corrected dust concentrations at each sampling location for both days, and Fig. 10 displays the average corrected dust concentrations at each sampling location during the follow-up visit. The highest average total respirable dust concentrations were experienced at the right location of the bulk bagging bay (brown) and at the manual valve bagging station below the conveyor belt that the filled bags dropped onto (yellow) during the first visit. Five out of the eight locations had an average over both days of testing less than 100 μg/m3. During the follow-up visit, the manual bagging station had the highest average dust concentration at 314 μg/m3.
Fig. 9.

Average corrected dust concentration at each sampling location
Fig. 10.
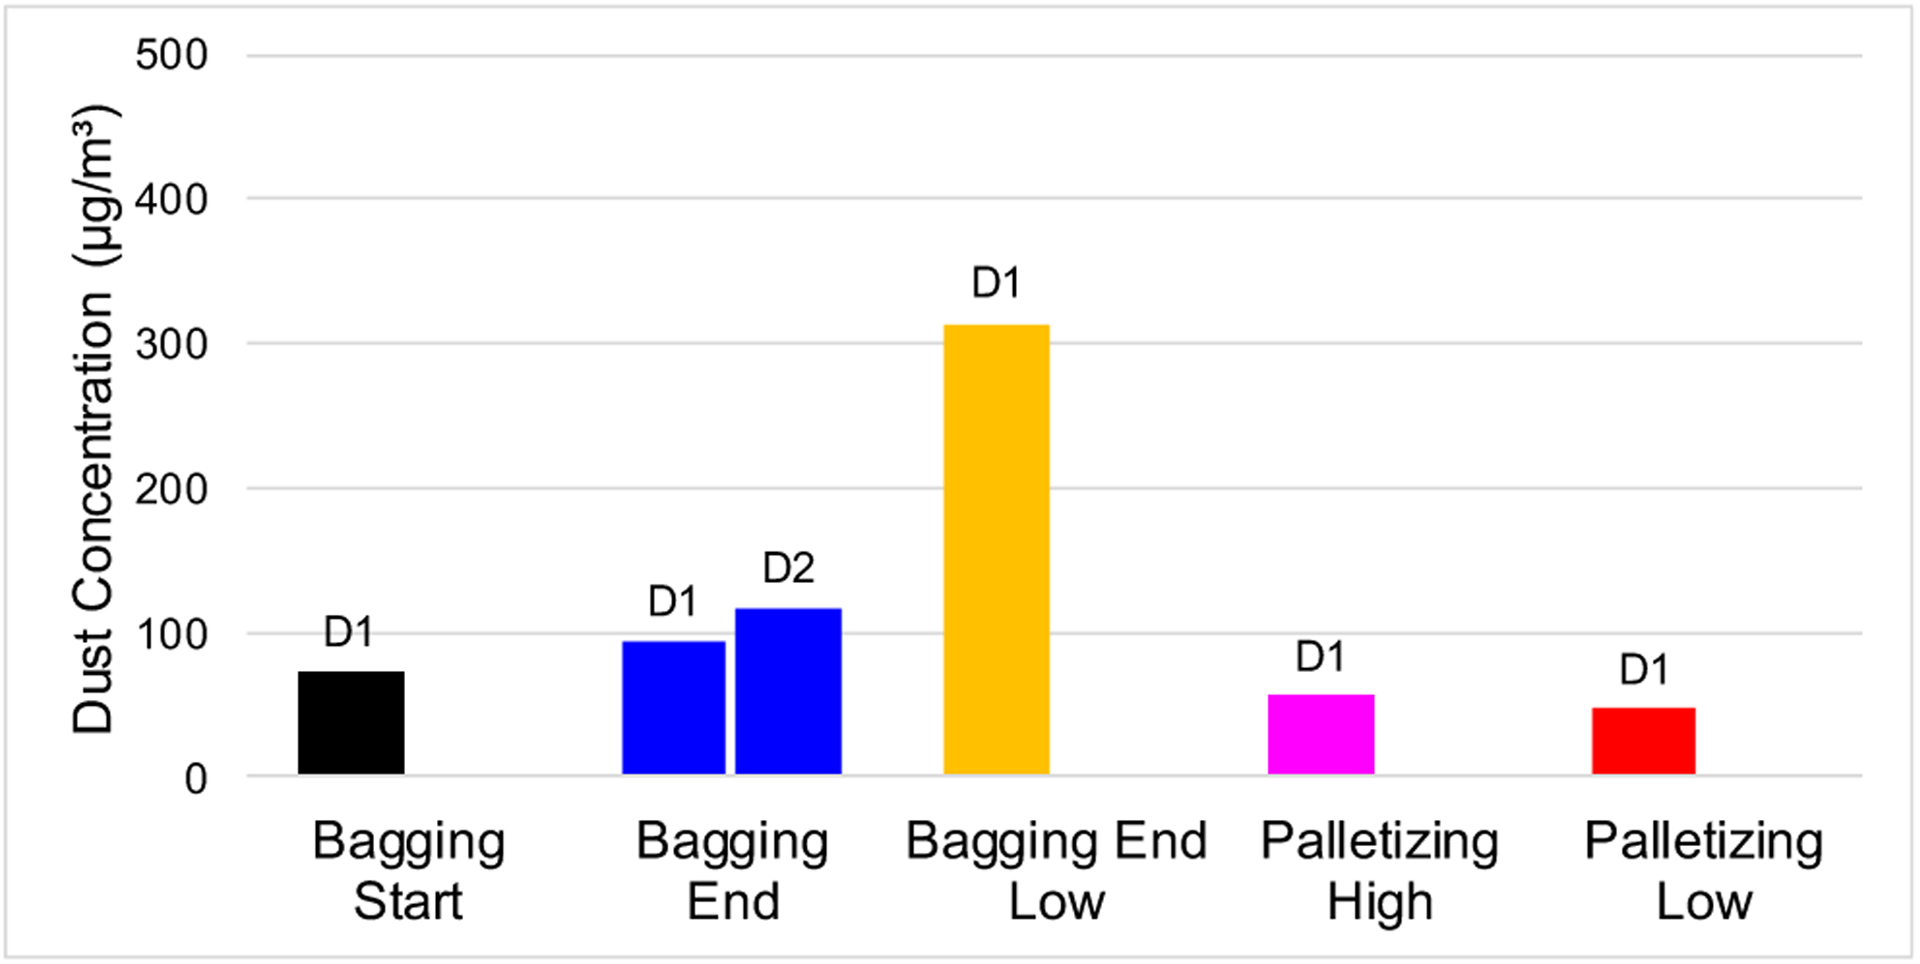
Average corrected dust concentration at each sampling location during a follow-up visit
5. Operation 2
The second evaluation was performed at a silica sand operation in Illinois. This operation utilizes an automated system to place empty 50-pound bags on the fill valves and to fill the bags (Fig. 11). Once the bags are filled, they are dropped onto a conveyor and sent through an enclosed bag cleaning device with an included LEV system. After the bag cleaning device, the bags are sent to a weighing station. After the weighing station, the bags are palletized using an automated robotic arm (Fig. 11). The loaded pallets are wrapped in plastic before being shipped to the customer. This operation also has a bulk bagging station where the bulk bags and liners are manually placed under the loading spout to be filled. There is a large ventilation hood near this bulk bagging station. A total of eight locations were sampled for total dust concentration over a period of 2 days: (1) at the pre-fill station where the empty bags are manually stacked before being automatically placed on the fill valves; (2) at the automatic bag filling station near the conveyor onto which the filled bags are dropped; (3) at the automatic bag filling station near a worker walkway; at the (4) pre- and (5) post-weighing stations; (6) at the automatic palletizing station; (7) at the bulk bag filling station; and (8) just outside of the bulk bagging station.
Fig. 11.

Left: Automatic bag placer and filling station. Right: Robotic palletizing arm
5.1. Operation 2 Results
Figure 12 displays the average dust concentrations of the eight sampling locations for both days. Each location showed an average total respirable dust concentration less than 80 μg/m3, with four out of the eight locations averaging less than 50 μg/m3 over the 2-day sampling period (the bagging walk-way side was only sampled 1 day). The highest average concentrations were experienced in the pre-weigh area (pink) and near the bulk bagging load spout (purple).
Fig. 12.

Average corrected area dust concentration at each sampling location
6. Operation 3
The third evaluation was conducted at a high-purity silica sand operation in Illinois. This operation manually fills and palletizes 50-pound bags of product. Bags are manually placed on three individual single-nozzle (traditional) systems (Fig. 13). Once the bags are filled, they are conveyed to an elevated palletizing system. Once the pallets are loaded, they are lowered to an automated plastic wrapping station (Fig. 13). This operation also has an indoor bulk bagging station. A total of nine locations were sampled over a period of 3 days: (1) at the manual bagging station where the operator sits; (2) behind the manual bagging station; (3) at the elevated palletizing station where bags are being placed on the pallets (high); (4) at the palletizing station once the pallets are fully stacked (low); (5) on a pole in between the manual and bulk bagging operations; at the (6) front, (7) center, and (8) rear of the bulk bagging station; and (9) near the stacked bulk bags that are ready for shipping.
Fig. 13.

Left: Manual bagging station with the traditional single-nozzle system. Right: Pallet wrapping station
6.1. Operation 3 Results
Figure 14 displays the corrected pDR-1000 data for each location for all 3 days of sampling. The highest average total respirable dust concentrations were experienced at the manual bagging station (black). All locations (except for day 3 at the manual bagging station) were less than 100 μg/m3. Six out of the nine locations averaged less than 50 μg/m3 over the 3-day sampling period.
Fig. 14.

Average corrected area dust concentration at each sampling location
7. Operation 4
The final evaluation was conducted at a specialty sand operation in Illinois. This operation utilizes a separator, which segregates dry material into various sizes. The finished sized product is then transported to an automated form-fill-seal (FFS) machine that fills 50-pound bags from a continuous roll of plastic bags (Fig. 15). The filled bags are palletized using a robotic arm, and the loaded pallets are then wrapped in plastic. Six locations were sampled for total dust concentrations over a period of 3 days: (1) near the separator; (2) on the platform above the FFS near the product hopper; (3) at the end of the FFS after the bags are filled; (4) behind the FFS machine; (5) at the palletizing station near the robotic arm; and (6) at the end of palletizing station near the plastic wrapping station.
Fig. 15.

Form-fill-seal (FFS) system
7.1. Operation 4 Results
Figure 16 displays the corrected pDR-1000 data for each location for all 3 days of sampling. The highest average total respirable dust concentrations were experienced at the separator (black). At each location, average dust concentrations increased from day 1 to day 2 and decreased from day 2 to day 3. The average concentration at each location (except the separator) between all 3 days was approximately 100 μg/m3 or less. An LEV system was in place at the separator, but the tubing was not attached properly.
Fig. 16.

Average corrected area dust concentration at each sampling location
8. Discussion
NIOSH researchers conducted a study at four different industrial sand bagging and palletizing operations to identify the current types of technology being used and to evaluate the effectiveness of implemented engineering controls in reducing workers’ exposures to respirable dust. Dust concentrations were taken at key locations throughout each operation over multiple days of sampling. Sampling packages included a real-time light-scattering monitor and three gravimetric samplers. The real-time dust concentrations were corrected using the average concentrations from the gravimetric samples.
It is important to note that no compliance samples were taken during this evaluation. Silica concentrations at each operation are unknown and all samples taken are considered total respirable dust. One limitation of this study is that no ventilation surveys were conducted at any of the operations. Therefore, the effect that local and/or structure ventilation, temperature, and relative humidity have on individual samples collected is unknown. While each sample location was intended to provide insight on dust exposures during a specific job task, process, or piece of equipment, it is unknown what effect other factors, such as proximity to another process, have on that location and other locations. Therefore, while the dust exposures at a specific location are representative, they cannot be solely attributed to that task, process, or piece of equipment. A final limiting factor is that no production data were acquired during the sampling periods at any of the operations. Therefore, the dust concentrations cannot be normalized based on production and should not be compared between the different operations. As a final note, the samples taken were area samples, and it can be assumed that personal exposures are less due to worker mobility in and out of these areas.
The first operation manually filled 50-pound bags using the dual-nozzle technology with an LEV system over each nozzle. The bagging start and end locations both averaged less than 60 μg/m3. One of the highest concentrations of dust was experienced below the manual bagging station. This could be caused by product falling from the station due to blowback and “rooster tail” during the filling of the bags. This could also be caused by the contaminated bags falling onto the conveyor belt after being filled. During the follow-up visit, this location again had the highest concentration of the samples taken. This operation also had an outdoor bulk bagging bay. The location to the right of this bay had the highest dust concentrations during the initial visit. It is recommended that when filling bulk bags, slides or chutes should be used whenever possible to minimize the distance that the product free-falls in open areas. Operators should also use dust-free empty bags manufactured to flexible intermediate bulk container standards. Many reusable bulk bags are returned with clean interiors, but dust is often trapped in the fabric on the bag exterior. This dust is then expelled during the handling of the bag. One last consideration when tying or sealing the spout of a filled bulk bag is that the operator should always hold the flexible loading spout away from his or her breathing zone to minimize the escaping dust.
The second operation utilizes an automated bag placing and filling system to fill 50-pound bags of product. Eight locations were sampled over 2 days at this operation. The average respirable dust levels at each location were less than 80 μg/m3. The highest concentrations were found at the pre- and post-weigh stations. While a bag cleaning device with an LEV system was used at this operation, it was observed that the stationary brushes inside of the device were severely worn and not making significant contact with the bags. It is recommended to change or adjust the brushes often so that they effectively clean the bags and reduce dust generated from contaminated bags. The low levels of dust experienced at the bulk bagging station were largely in part due to the large ventilation hood located in the area. Collecting dust at the source through an LEV system is always preferred over trying to redirect or dilute it with a fan. Ductwork to LEV systems should be examined and cleaned regularly to ensure that the system is working properly. Capture velocities at the face or shrouds and hoods should also be monitored periodically to ensure proper functioning.
The highest average dust concentrations at the third operation were experienced at the manual bagging station. This operation utilizes a traditional fill nozzle without an exhausting component. The use of ventilated filling spouts, such as the dual-nozzle system, helps reduce dust generated during bag filling by removing the product from the fill nozzle and bag valve areas after the bag filling is completed. Plastic stripping should be considered to isolate the bagging area. This will help reduce dust from entering other areas of the plant and allow the LEV system to perform more effectively.
The fourth operation utilized an automated form-fill-seal process to fill and palletize 50-pound bags. The highest average total respirable dust concentrations were experienced at the separator. It is important to note that the LEV system in place for this separator was not attached. Isolating this area with plastic stripping and properly using the LEV system can significantly reduce dust emissions at individual sources. The average concentration at each location (except the separator) between all 3 days was approximately 100 μg/m3 or less.
In addition to all the engineering controls mentioned, good housekeeping practices can significantly reduce dust generated from secondary sources. Housekeeping should be conducted every shift to effectively minimize respirable dust exposures to workers. Maintaining clean floors is critical in bagging operations as the loaded pallets are typically moved by a forklift or tow motor. As these vehicles move around the plant and warehouse locations, they can stir up significant amounts of dust if floors are not kept in clean condition. Two common floor cleaning techniques that can be used are hosing down the floors with water and the use of floor cleaning/sweeping units. Other common sources that can expose workers in bagging operations to elevated levels of respirable dust include dusty work clothing and dust-laden cloth chairs in mobile equipment, labs, and work areas.
9. Conclusions
The main objective of the research effort described in this paper was to determine the types and effectiveness of dust control technologies and interventions currently being used at industrial minerals bagging and palletizing operations. Of the four individual operations that were evaluated as part of this study, it was determined that most of the control technologies and interventions that were implemented and being used properly were effective at reducing workers’ exposures to respirable dust. Another major objective of this research study was to determine if modifications and improvements can be made to current technology to further reduce dust exposures during these work processes. It was determined that the current bagging and palletizing technologies being used, when combined with known engineering controls (LEV systems, plastic striping, etc.), were effective at reducing workers’ dust exposures. It was also determined that work practices such as good housekeeping, implementing structure ventilation, and maintenance of equipment can significantly help in reducing dust concentrations at these facilities. Based upon the results of these four different evaluations, it appears that the currently available dust control technology provides a range of choices which should enable the industry to maintain workers’ respirable dust exposures at acceptable levels.
Footnotes
Publisher's Disclaimer: Disclaimer The findings and conclusions in this paper are those of the authors and do not necessarily represent the official position of the National Institute for Occupational Safety and Health, Centers for Disease Control and Prevention. Mention of any company or product does not constitute an endorsement by NIOSH.
Conflict of Interest The authors declare that they have no conflict of interest.
References
- 1.NIOSH (2002) Health effects of occupational exposure to respirable crystalline silica. Cincinnati, OH: U.S. Department of Health and Human Services, Centers for Disease Control and Prevention, National Institute for Occupational Safety and Health, DHHS (NIOSH) Publication No; 2002–129 [Google Scholar]
- 2.MSHA (2006) Metal and nonmetal health inspection procedures; chapter 5—mineral dusts—gravimetric method. U.S. Department of Labor, Mine Safety and Health Administration, Handbook number PH06-IV-1, pp. 5–2–5–4. https://arlweb.msha.gov/Readroom/HANDBOOK/MNMInspChapters/Chapter5.pdf [Google Scholar]
- 3.OSHA (2016) OSHA’s final rule to protect workers from exposure to respirable crystalline silica. Occupational Safety and Health Administration; https://www.osha.gov/dsg/topics/silicacrystalline/ [Google Scholar]
- 4.NIOSH (1974) Criteria for a recommended standard: occupational exposure to crystalline silica. Cincinnati, OH: U.S. Department of Health, Education, and Welfare, Health Services and Mental Health Administration, National Institute for Occupational Safety and Health, DHEW (NIOSH) Publication No; 75–120 [Google Scholar]
- 5.USBM (1985) Dust control in bag-filling operations. By Volkwein JC, Gaynor RD. Pittsburgh, PA: U.S. Department of the Interior, Bureau of Mines Information Circular 9005 [Google Scholar]
- 6.Cecala AB, Volkwein JC, Daniel JH (1988) Reducing bag operator’s dust exposure in mineral processing plants. Appl Ind Hyg 3(1): 23–27 [Google Scholar]
- 7.USBM (1986) Dust reduction capabilities of five commercially available bag valves. By Cecala AB, Covelli A, Thimons ED. Pittsburgh, PA: U.S. Department of the Interior, Bureau of Mines Information Circular 9068 [Google Scholar]
- 8.USBM (1984a) New bag nozzle to reduce dust from fluidized air bag machines. By Cecala AB, Volkwein JC, Thimons ED. Pittsburgh, PA: U.S. Department of the Interior, Bureau of Mines Report of Investigations 8886 [Google Scholar]
- 9.USBM (1984b) New bag nozzle system reduces dust during bagging operations. By Cecala AB. Pittsburgh, PA: U.S. Department of the Interior, Bureau of Mines Technology News 207 [Google Scholar]
- 10.Robertson JL (1986) Overhead filters reduce dust levels in air supply. Rock Prod 89(7):24 [Google Scholar]
- 11.USBM (1995) Reducing respirable dust levels during bag conveying and stacking using bag and belt cleaner device. By Cecala AB, Timko RJ, Prokop AD. Pittsburgh, PA: U.S. Department of the Interior, Bureau of Mines Report of Investigations 9597 [Google Scholar]
- 12.Cecala AB, Timko RJ, Prokop AD (1997) Bag and belt cleaner reduces employee dust exposure. Rock Prod 100(3):41–43 [Google Scholar]
- 13.USBM (1988) Pallet loading dust control system. By Cecala AB, Covelli A. Pittsburgh, PA: U.S. Department of the Interior, Bureau of Mines Report of Investigations 9197 [Google Scholar]
- 14.USBM (1989) New pallet loading system lowers worker’s dust exposure and improves bag stacking process. By Cecala AB. Pittsburgh, PA: U.S. Department of the Interior, Bureau of Mines Technology News 328 [Google Scholar]
- 15.Cecala AB, Zimmer JA, Smith B, Viles S (2000) Improved dust control for bag handlers. Rock Prod 103(4):46–49 [Google Scholar]
- 16.NIOSH (2019) Dust control handbook for industrial minerals mining and processing. Second edition By Cecala AB, O’Brien AD, Schall J, Colinet JF, Franta RJ, Schultz MJ, Haas EJ, Robinson J, Patts J, Holen BM, Stein R, Weber J, Strebel M, Wilson L, and Ellis M. Pittsburgh, PA: U.S. Department of Health and Human Services, Centers for Disease Control and Prevention, National Institute for Occupational Safety and Health, DHHS (NIOSH) Publication No; 2019–124, RI 9701 [Google Scholar]
- 17.NIOSH (1998) NIOSH manual of analytical methods (NMAM), Fourth Edition Particulates not otherwise regulated, total: Method 0600, Issue 3, 6 pp. [Google Scholar]
- 18.Scientific Thermo (2013) Model pDR-100AN/1200 Instruction Manual. pp.35–36. https://www.thermofisher.com/order/catalog/product/PDR-1000AN#/PDR-1000AN