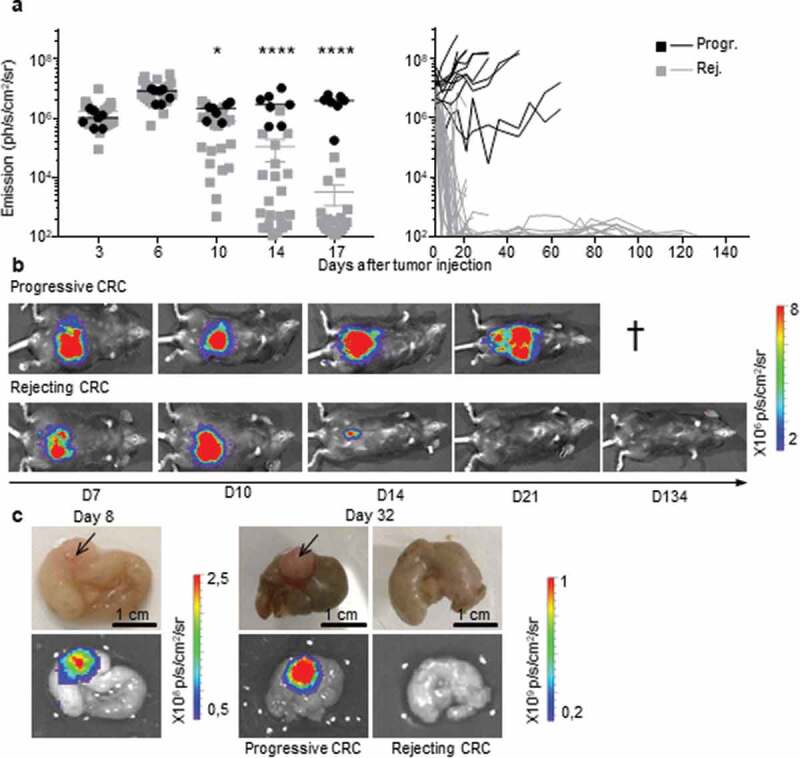
Figure 1.

Two profiles of CRC development in immunocompetent B6 mice. a, b.
Bioluminescence emission monitoring (a) and image of one representative mouse per group (b) from progressive (Progr.) and rejecting (Rej.) CRC groups following IC-injection with 1 × 10⁶ MC38-fLuc cells. (Average ±SEM, n = 36 mice, representative experiment of 3). c: Ex vivo photograph (upper panel) and corresponding bioluminescent image (bottom panel) of representative caecums from day D8 and D32 MC38-fLuc IC-implanted mice. Arrows indicate tumors on the cecum. *P < 0.05, ****P < 0'.0001
