

ABSTRACT
Background
Cancer outcome is associated with circulating immune cells, including eosinophils. Here we analyze the relative eosinophil count (REC) in different breast cancer subtypes.
Methods
Stage I–III breast cancer patients were included in the study and classified as REC-high vs low (cutoff 1.5%) or relative lymphocyte count (RLC)-high vs low (cutoff 17.5%). The co-primary endpoints were the breast cancer-specific survival (BCSS) or the time to treatment failure (TTF) in the REC groups.
Results
Overall 930 patients were included in the study. We observed a benefit for REC-high vs REC-low in TTF (HR 0.610, 95% CI 0.458–0.812), and in BCSS (HR 0.632, 95% CI 0.433–0.923). Similarly, we observed a better TTF (HR 0.421, 95% CI 0.262–0.677) and BCSS (HR 0.350, 95% CI 0.200–0.614) in RLC-high vs low. A lower relapse rate was observed in the REC-high vs REC-low group (17.1% vs 24.7%, p = 0.005), not confirmed in the multivariate analysis. A lower median REC at baseline and at relapse was observed compared to REC after surgery and during cancer-free follow-up (p < .0001).
Conclusions
REC could be a new promising, affordable and accessible predictive and prognostic biomarker in all breast cancer subtypes.
KEYWORDS: eosinophil, breast cancer, immune system, immune biomarker, lymphocyte
Background
Breast cancer is the most common cancer and the leading cause of cancer-related death in women worldwide, with more than 2 million new cases and 626 679 deaths per year.1 The standard treatment for early breast cancer is multidisciplinary, with a combination of surgery, radiotherapy and systemic treatment (chemotherapy, hormonotherapy and targeted therapy).
Some reports have suggested a role of the immune system in breast cancer development, showing an association between tumor-infiltrating lymphocytes and chemotherapy response, in particular in triple-negative breast cancer (TNBC) and in hormone receptor-negative/HER2-positive breast cancers.2–5 Various immune cells infiltrate tumor tissue and stroma. Specific immunologic profiles are associated with histologic characteristics, such as hormone receptor expression, HER2 overexpression and tumor grade, or with response to treatment.6,7 In general, CD8+ cytotoxic T lymphocytes are associated with a good prognosis, while Treg cells are associated with an unfavorable outcome.5 Chemotherapy sensitivity and cancer outcomes appear to be affected by circulating immune cells, including neutrophils, lymphocytes and eosinophils. Notably, pre-treatment lymphopenia is associated with poor survival and is predictive of tumor recurrence.8–12 Similarly, the neutrophil/lymphocyte ratio, the platelet/lymphocyte ratio and the lymphocyte/monocyte ratio were described to have prognostic value in breast cancer.13,14
The role of peripheral eosinophil count has been studied mainly in melanoma and in lung cancer patients treated with immunotherapy.15–25 Concerning breast cancer, less studies have been published so far and their role is still controversial. A first study, published in 1983, showed that high baseline eosinophil count was associated with a lower recurrence rate in 419 breast cancer patients.8 On the other hand, in a smaller retrospective series of 62 HER2-positive breast cancer patients treated with trastuzumab a survival benefit for patients with lower baseline eosinophil count was observed.9 Recently, in our previous retrospective study, conducted on 112 TNBC and hormone receptor-negative/HER2-positive breast cancer patients receiving neoadjuvant treatment, we observed a positive association between baseline relative eosinophil count (REC) with pathological complete response and survival rate.26 Moreover, we observed an increase in relative circulating eosinophils, that remain stable until at least 1 year (y) after curative treatment. A statistically significant reduction of relative eosinophil count (REC) at relapse timepoint was observed in a small cohort of 23 patients, suggesting that the tumor could affect the peripheral eosinophil count, with still unknown mechanisms.26
Stage I–III breast cancer patients of all the subtypes receiving curative surgery with or without chemotherapy, targeted therapy and hormonotherapy have been included in this retrospective report. The aim of this work was to study the impact of eosinophil count on outcome and its variation during disease course in all breast cancer subtypes.
Materials and methods
Patients selection
Patients with a histologically proven stage I–III breast cancer, treated between January 1999 and December 2018 at University Hospital of Liège, were retrospectively included in this study. All the patients included in the analysis were in good clinical conditions (Performance Status 0–2), had adequate organ function at diagnosis and have been treated with surgery with or without additional treatment (chemotherapy, radiotherapy, target therapy and hormonotherapy), according to local guidelines.
Patients without a baseline hematological evaluation including REC, with a diagnosis of another primary tumor during the 5 y before the breast cancer diagnosis, with a metastatic disease at diagnosis or with a Tis breast tumor were excluded from the trial.
This study was performed in compliance with the Helsinki Declaration and was approved by the local Ethics Committee with the reference N 2020/53. All the patients were recruited at the University Hospital of Liège – CHU Liege. As a retrospective and non-interventional study, informed consent is not required. Medical records were analyzed anonymously.
Data collection
For all the patients, the following data were collected: age at diagnosis; histological characteristics at baseline such as estrogen receptor (ER), progesterone receptor (PgR), HER2 status, Ki67, histotype, Scarff-Bloom-Richardson tumor grade (G); TNM stage and tumor size at baseline; type of treatment; presence of relapse confirmed by radiological imaging and/or histological analysis; hematological lab tests at seven different timepoints (at diagnosis, after surgery, 1 y after surgery, 2 y after surgery, 5 y after surgery, 10 y after surgery and at relapse, if observed). Blood analysis performed during infection, after a diagnosis of a secondary cancer, for follow-up of hematologic diseases, during chemotherapy and after relapse was not included in the database.
All the data listed below were done for medical purposes and retrospectively collected by a medical oncologist. Immunohistochemistry was used the determine ER, PgR, HER2 and Ki67; fluorescent in situ hybridization (FISH) was used to confirm HER2 status in selected cases; histology and tumor grade were determined by an experienced pathologist on hematoxylin-eosin stained tumor sample at baseline. TNM stage was determined with radiological imaging (Rx mammography, breast ultrasound, breast IRM, thorax and abdominal CT scan, where clinically required) and on surgical samples for patients not receiving neoadjuvant chemotherapy as primary approach. Hematological lab tests, too, were routinely performed for medical purposes. The white blood cell count was done through the hematology analyzer Sysmex XE-5000 based on fluorescent flow cytometry technology. Relative count was calculated for eosinophils and lymphocytes on the total count of white blood cells.
Survival data were collected with a data cutoff in October 2019. We considered as time-to-event the time to treatment failure (TTF), defined as the interval between diagnosis and loco-regional, contralateral or metastatic relapse or death by breast cancer, and the breast cancer-specific survival (BCSS), defined as the interval between diagnosis and death by breast cancer.27,28
Statistical analyses
Statistical analyses and graphs were done using IBM SPSS Statistic v25, MedCalc v19.1.5 and Prism GraphPad 5.
To define the group of patients as REC-low/high and relative lymphocyte count (RLC)-low/high, the cutoff of 1.5% for REC has been used, where <1.5% were considered REC-low and ≥1.5% REC-high, according to similar studies conducted on melanoma patients.18 Analogously, for RLC the cutoff of 17.5% has been used, with value <17.5% considered as RLC-low and ≥17.5% as RLC-high.18 The REC and the RLC have been combined in a unique biomarker, the eosinophil-lymphocyte product (ELP), by multiplying the REC and the RLC. The best cutoff for ELP was calculated by drawing a ROC curve for relapse and death by means of the Youden index. Finally, we selected as threshold to classify patients as ELP-high/low the mean value between the two cutoffs previously calculated, where values < this cutoff were considered as ELP-low and ≥ as ELP-high.
The two co-primary endpoints for this study are the association between TTF and BCSS and relative eosinophil count (REC-low vs REC-high groups) in the whole cohort of patients. The secondary endpoints are the association between baseline REC, RLC and ELP with relapse; the TTF and BCSS according to RLC and ELP at baseline and according to REC, RLC and ELP after surgery; the variations in REC and RLC after surgery, during follow-up and at relapse. A subgroup analysis according to age < or ≥65 y, treatment with chemotherapy, anti-HER2, hormonotherapy and radiotherapy and according to histology (ductal or luminal) and to breast cancer subtype (Luminal A, Luminal B, HER2-enriched, TNBC) was performed.
The association between patient baseline characteristics expressed as dichotomous variables (ER, PgR, HER2, Ki67, breast cancer subtype, histology, stage, T stage, N stage, tumor grade, lymphovascular invasion and BRCA status) and REC was tested by means of the Chi-Square test. Spearman test was used to analyze the correlation between age, tumor size in mm, ER, PgR and Ki67 in percentage and REC as a continuous variable.
Kaplan–Meier and Log-Rank tests were used to analyze survival. The HR for TTF and BCSS was calculated with a Cox Regression. The 5-y and the 10-y TTF and BCSS were calculated from the survival tables.
The Chi-Square test was used to calculate the association between relapse and dichotomous variables as REC, RLC, ELP, ER status, PgR status, HER2 status, Ki67 < or ≥20%, T stage, N stage, tumor grade, histology, lymphovascular invasion, type of treatment and BRCA status. The Mann–Whitney U test was used for the continuous variable as age, ER and PgR expressed in percentage, Ki67, tumor size, platelet count, relative and absolute neutrophil, lymphocyte, monocyte, eosinophil and basophil count. Sequential binary logistic regression with forward stepwise selection of variables based on likelihood ratio was performed for relapse, including in the test all the variables with a p value ≤ 0.1 in the Chi-Square or Mann–Whitney test. For variables significant in both the Chi-Square and the Mann–Whitney test we chose the variable with the best p value. For the variables with the same p value in both univariate tests, we chose the continuous variable.
We evaluate the variations in the REC and RLC distributions from the baseline, during follow-up and at relapse using a Friedman test for seven different timepoints: at diagnosis, after surgery, 1 y after surgery, 2 y after surgery, 5 y after surgery, 10 y after surgery and at relapse, if occurs. The patients with or without relapse were analyzed separately. A comparison by pairs of the different timepoint was done through a Bonferroni–Dunn multiple comparison post hoc test.
Results
Overall 930 patients with a diagnosis of stage I–III breast cancer between January 1999 and December 2018 were included in our study. The median follow-up was of 104 months (range 6–245 months) with a data cutoff in October 2019. The median age at diagnosis for the whole cohort was of 61 y (range 25–97).
Using the cutoff of 1.5% for REC, we classified 393 patients (42.3%) as REC-low and 537 patients (57.7%) as REC-high at baseline. According to the cutoff of 17.5% for RLC, 53 patients (5.7%) were classified as RLC-low and 877 (94.3%) as RLC-high at baseline.
The baseline characteristics in the group of patients REC-low and REC-high are reported in Table 1. Overall 40.9% of patients were classified as Luminal A, 31.8% as Luminal B, 7.1% as HER2-enriched and 18.8% as TNBC, with a lower rate of TNBC (14.3% vs 22.6%) and a higher rate of Luminal A (46% vs 33.8%) in the REC-high group compared to REC low-group (p < .0001). In the REC-high group, we observed also a higher rate (49.7%) of tumor with Ki67 lower than 20% compared to REC-low (40.7%) patients (p=0.006). The REC-high and low groups were well balanced for all the other baseline characteristics, notably for HER2 status, stage at diagnosis, T, N, G, histology lymphovascular invasion and BRCA mutation. REC is significantly correlated with age with a Spearman correlation coefficient of 0.145 (p < 0.0001). No significant correlations were observed between REC and tumor size in mm, ER, PgR and Ki67 as continuous variables (Supplementary materials, Table 1).
Table 1.
Patient baseline characteristics.
| REC < 1.5% (N = 393) |
REC ≥ 1.5% (N = 537) |
Chi-Square test (p value) |
|||
|---|---|---|---|---|---|
| N of patients | % | N of patients | % | ||
| Median age (range) | 59 (25–97) | 62 (25–97) | |||
|
ER Positive Negative Unknown |
264 128 1 |
67.2% 32.6% 0.3% |
412 122 3 |
76.7% 22.7% 0.6% |
0.001 |
|
PgR Positive Negative Unknown |
222 169 2 |
56.5% 43% 0.5% |
344 188 5 |
64.1% 35% 0.9% |
0.015 |
|
HER2 Positive Negative Unknown |
84 305 4 |
21.4% 77.6% 1% |
98 434 5 |
18.2% 80.8% 0.9% |
0.232 |
|
Stage I II III Unknown |
119 178 89 7 |
30.3% 45.3% 22.6% 1.8% |
177 242 115 3 |
33% 45.1% 21.4% 0.6% |
0.568 |
|
T stage 1 2 3 4 Unknown |
159 146 33 52 3 |
40.5% 37.2% 8.4% 13.2% 0.8% |
233 206 39 56 3 |
43.4% 38.4% 7.3% 10.4% 0.6% |
0.526 |
|
N stage 0 1 2 3 Unknown |
223 140 20 7 3 |
56.7% 35.6% 5.1% 1.8% 0.8% |
321 161 39 13 3 |
59.8% 30% 7.3% 2.4% 0.6% |
0.302 |
|
Lymphovascular invasion Yes No Unknown |
92 167 134 |
23.4% 42.5% 34.1% |
115 213 209 |
21.4% 39.7% 38.9% |
0.320 |
|
Tumor grade 1 2 3 Unknown |
59 179 138 17 |
15% 45.5% 35.1% 4.3% |
111 229 173 24 |
20.7% 42.6% 32.2% 4.5% |
0.282 |
|
Subtype Luminal A Luminal B HER2-enriched TNBC Unknown |
133 131 31 89 9 |
33,8% 33,3% 7,9% 22,6% 2.3% |
247 165 35 77 13 |
46% 30,7% 6.5% 14,3% 2.4% |
< 0.0001 |
|
Ki67 <20% ≥ 20% Unknown |
160 218 15 |
40,7% 55,5% 3.8% |
267 250 20 |
49,7% 46,6% 3.7% |
0.006 |
|
Histology Ductal Lobular Other Unknown |
325 46 20 2 |
82.7% 11.7% 5.1% 0.5% |
433 74 25 5 |
80.6% 13.8% 4.7% 0.9% |
0.777 |
|
BRCA mutation BRCA1 BRCA2 Absence of mutation Not tested |
10 6 90 287 |
2.5% 1.5% 22.9% 73% |
12 10 87 428 |
2.2% 1.9% 16.2% 79.7% |
0.551 |
Abbreviations: REC, Relative Eosinophil Count; N, Number; ER, Estrogen Receptor; PgR, Progesterone Receptor; TNBC, Triple-Negative Breast Cancer.
All 930 patients underwent surgery. Additional treatments, according to cancer characteristics and physician choice, were also performed, in particular, 552 patients out of 930 received neoadjuvant and/or adjuvant chemotherapy, 156 patients received anti-HER2 treatment, 736 radiotherapy and 676 hormonotherapy, as reported in Supplementary Materials (Table 2).
Table 2.
REC in the group of 741 patients without relapse and in the group of 189 patients with relapse.
| |
|
Patients without relapse (n = 741) |
Patients with relapse (n = 189) |
|||||||||||||
|---|---|---|---|---|---|---|---|---|---|---|---|---|---|---|---|---|
| REC baseline | REC post-surgery | REC 1-y follow-up | REC 2-y follow-up | REC 5-y follow-up | REC 10-y follow-up | Friedman test | REC baseline | REC post-surgery | REC 1-y follow-up | REC 2-y follow-up | REC 5-y follow-up | REC 10-y follow-up | REC relapse | Friedman test | ||
| N pts | 741 | 532 | 600 | 554 | 408 | 172 | 189 | 142 | 123 | 97 | 45 | 4 | 158 | |||
| Median | 1.7% | 2.6% | 2.6% | 2.5% | 2.6% | 2.5% | <0.0001 | 1.4% | 2.5% | 2.5% | 2.7% | 2.5% | 2.1% | 1.5% | <0.0001 | |
| SD | 1.917 | 2.379 | 1.,947 | 1.838 | 1.522 | 1.793 | 1.171 | 1.988 | 1.969 | 1.562 | 1.307 | 0.753 | 1.491 | |||
| p value | p value | |||||||||||||||
| Bonferroni–Dunn test | REC baseline | - | <0.0001 | <0.0001 | <0.0001 | <0.0001 | 0.002 | NA | - | <0.0001 | <0.0001 | <0.0001 | 0.002 | 1 | 1 | NA |
| REC post-surgery | <0.0001 | - | 1 | 1 | 0.127 | 0.869 | NA | <0.0001 | - | 1 | 1 | 1 | 1 | <0.0001 | NA | |
| REC 1-y follow-up | <0.0001 | 1 | - | 1 | 1 | 1 | NA | <0.0001 | 1 | - | 1 | 1 | 1 | < 0.0001 | NA | |
| REC 2-y follow-up | <0.0001 | 1 | 1 | - | 1 | 1 | NA | <0.0001 | 1 | 1 | - | 1 | 1 | <0.0001 | NA | |
| REC 5-y follow-up | <0.0001 | 0.127 | 1 | 1 | - | 1 | NA | 0.002 | 1 | 1 | 1 | - | 1 | 0.004 | NA | |
| REC 10-y follow-up | 0.002 | 0.869 | 1 | 1 | 1 | - | NA | 1 | 1 | 1 | 1 | 1 | - | 1 | NA | |
| REC relapse | NA | NA | NA | NA | NA | NA | NA | 1 | <0.0001 | <0.0001 | <0.0001 | 0.004 | 1 | - | NA | |
Abbreviations: REC, Relative Eosinophil Count; y, years; N, Number; SD, Standard Deviation; NA, Not Applicable.
The number of patients included in the survival analysis was 826; 73 patients were excluded from the analysis due to death for other causes than breast cancer and 31 were lost at follow-up. At data cutoff, we observed 189 relapses, 97 in the REC-low group and 92 in the REC-high group, and 109 deaths, 56 in the REC-low and 53 in the REC-high group. Out of the 189 relapses, 28 were loco-regional, 18 in the contralateral breast and 138 metastatic. The information about the site of relapse was missing for 5 patients. We observed a longer TTF for patients classified at baseline as REC-high compared to REC-low patients (5-y TTF 84% vs 74%, p=0.001; HR 0.610, 95% CI 0.458–0.812), as well as a better BCSS (5-y BCSS 90% vs 86%, p=0.021; HR 0.632, 95% CI 0.433–0.923) (Figure 1(a–b), Supplementary Materials Table 3). Alike, for patients classified as RLC-high at baseline compared to RLC-low group we observed a better TTF (5-y TTF 75% vs 51%, p < .0001; HR 0.421, 95% CI 0.262–0.677) and BCSS (5-y BCSS 89% vs 74%, p < .0001; HR 0.350, 95% CI 0.200–0.614) (Figure 1(c–d) and Supplementary Materials Table 3). The separation of the two curves is more pronounced using the RLC as parameter compared to REC in both TTF and BCSS, even though the small sample size of only 53 patients for the RLC-low group.
Figure 1.

TTF and BCSS according to baseline REC, RLC and ELP.
Table 3.
REC variation in the cohort of patients without relapse according to subtype.
| REC baseline | REC post-surgery | REC 1y Follow-up |
REC 2y follow-up | REC 5y follow-up | REC 10y follow-up | Friedman test | ||
|---|---|---|---|---|---|---|---|---|
| Luminal A | N | 325 | 225 | 243 | 239 | 188 | 91 | |
| Median | 1.8% | 2.7% | 2.6% | 2.7% | 2.6% | 2.6% | < 0.0001 | |
| SD | 1.882 | 2.580 | 1.710 | 1.757 | 1.578 | 1.733 | ||
| Luminal B | N | 236 | 181 | 206 | 187 | 129 | 45 | |
| Median | 1.6% | 2.5% | 2.8% | 2.5% | 2.9% | 2.5% | < 0.0001 | |
| SD | 1.666 | 2.231 | 2.299 | 2.267 | 1.510 | 1,405 | ||
| HER2-enriched | N | 50 | 35 | 39 | 32 | 23 | 12 | |
| Median | 1.8% | 2.8% | 2.8% | 2.1% | 2.7% | 3.4% | <0.0001 | |
| SD | 3.573 | 2.352 | 2.028 | 1.147 | 1.360 | 1.309 | ||
| TNBC | N | 115 | 81 | 102 | 89 | 62 | 19 | |
| Median | 1.4% | 2.8% | 2.5% | 2.4% | 2.1% | 2.7% | < 0.0001 | |
| SD | 1.502 | 2.190 | 1.680 | 1.364 | 1.430 | 2.945 |
Abbreviations: REC, Relative Eosinophil Count; y, years; N, Number; SD, Standard Deviation; TNBC, Triple-Negative Breast Cancer.
We combined the eosinophils with the lymphocytes in the variable ELP, as proposed in our previous study.26 We calculate, by means of the ROC curve and the corresponding Youden index, the best cutoff to predict relapse and death for breast cancer, which are, respectively, 38.97 and 34.04. Then, we use the mean value of 36.5 between these two calculated indices as cutoff for our analysis. Using this cutoff, we classified 343 patients as ELP-low and 587 as ELP-high at baseline. We observed a better TTF (5-y TTF 84% vs 74%, p=0.003; HR 0.646, 95% CI 0.484–0.861) and BCSS (5-y BCSS 90% vs 86%, p=0.003; HR 0.572, 95% CI 0.392–0.834) for ELP-high group (Figure 1(e–f) and Supplementary Materials Table 3).
Baseline REC is also predictive of relapse in univariate analysis, with a higher incidence of breast cancer recurrence in the group REC-low than in the group REC-high (24.7% vs 17.1%, p=0.005). Similar results were observed for RLC (35.8% vs 19.4% in RLC-low and high, respectively, p=0.004) and ELP (24.8% vs 17.7% in ELP-low and high, respectively, p=0.01) in the univariate analysis (Supplementary materials, Table 4). The multivariate analysis showed that the only independent variable predictive of relapse was the N stage with an odds ratio (OR) of 2.392, 95% CI, 1.324–4.321 (p=0.004) (Supplementary materials, Table 5).
Table 4.
REC variation in the cohort of patients with relapse according to subtype.
| REC baseline | REC post-surgery | REC 1-y follow-up |
REC 2-y follow-up | REC 5-y follow-up | REC 10-y follow-up | REC relapse | Friedman test | ||
|---|---|---|---|---|---|---|---|---|---|
| Luminal A | N | 55 | 39 | 40 | 38 | 24 | 1 | 43 | |
| Median | 1.5% | 2.5% | 2.4% | 2.5% | 2.25% | 2.1% | 1.6% | 0.038 | |
| SD | 0.979 | 1.602 | 1.497 | 1.246 | 0.947 | - | 1.263 | ||
| Luminal B | N | 60 | 47 | 42 | 32 | 11 | - | 54 | |
| Median | 1.5% | 2.1% | 2.1% | 2.7% | 3% | - | 1.2% | 0.008 | |
| SD | 1.378 | 2.507 | 2.578 | 1.879 | 1.366 | - | 1.681 | ||
| HER2-enriched | N | 16 | 13 | 9 | 4 | 2 | - | 13 | |
| Median | 1.45% | 2.6% | 3.6% | 3.6% | 1.3% | - | 0.9% | 0.047 | |
| SD | 1.529 | 1.860 | 2.140 | 3.123 | 0.283 | - | 1.688 | ||
| TNBC | N | 50 | 37 | 27 | 19 | 5 | 2 | 42 | |
| Median | 1.4% | 2.5% | 2.8% | 2.9% | 3.4% | 2.7% | 1.7% | 0.001 | |
| SD | 1.018 | 1.788 | 1.456 | 1.224 | 1.743 | 0.990 | 1.421 |
Abbreviations: REC, Relative Eosinophil Count; y, years; N, Number; SD, Standard Deviation; TNBC, Triple-Negative Breast Cancer.
A survival analysis performed according to REC, RLC and ELP after surgery showed a statistically significant result only for BCSS according to REC (5-y BCSS 86% vs 78% in REC-high vs REC-low group, p=0.025; HR 0.583, 95% CI 0.361–0.940) and ELP (5-y BCSS 86% vs 79% in ELP-high vs ELP-low group, p=0.018; HR 0.571, 95% CI 0.357–0.913). However, we observe the same trend of benefit for TTF in REC-high and ELP-high group, and in term of TTF and BCSS for RLC-high group, without reaching the statistical significance (Supplementary Materials, Table 6).
In the subgroup analysis, we classified patients according to the age, the treatment with chemotherapy, anti-HER2, radiotherapy or hormonotherapy, according to the histology and the subtype. We observed an HR in favor of the group REC-high at baseline for all the subgroups for TTF (Figure 2a) and for all the subgroups with the exception of the lobular histology, the Luminal A and the Luminal B subtypes for BCSS (Figure 2b). In these cases, the HR showed a trend in favor of the group REC-low at baseline, but the results were not statistically significant.
Figure 2.
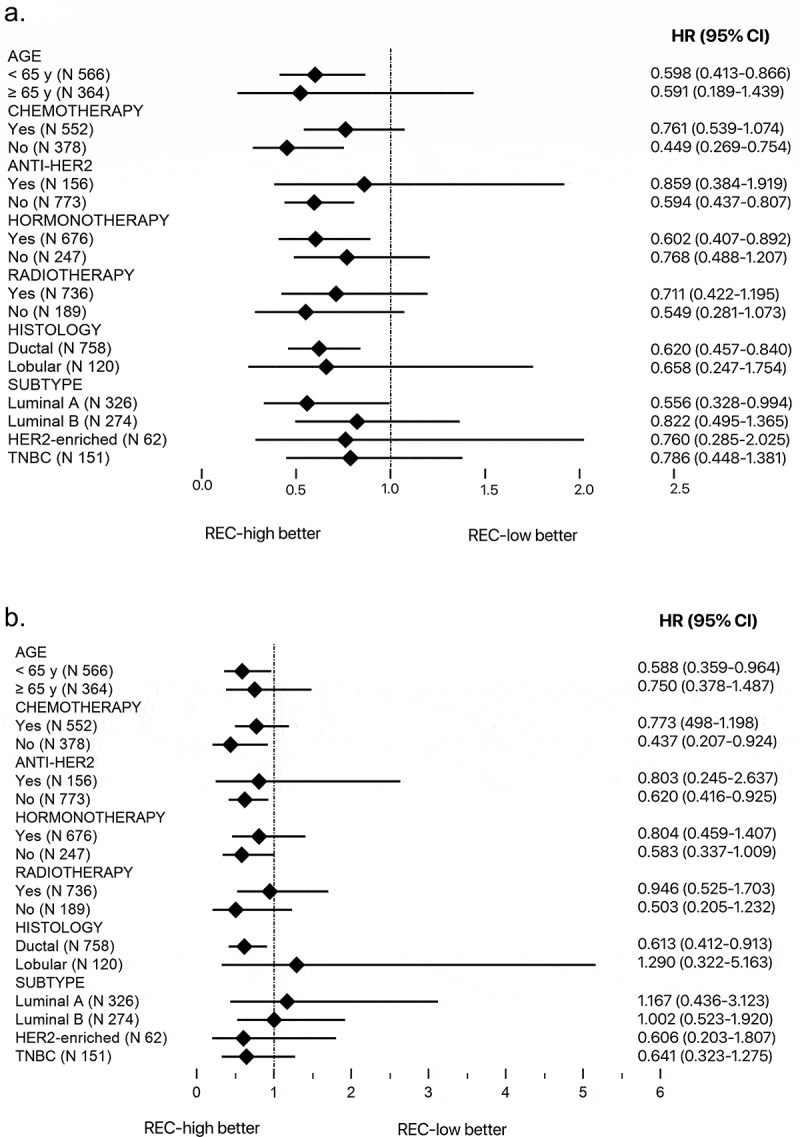
Subgroup analysis for TTF and BCSS according to baseline REC.
Finally, we analyzed the variation of blood parameters during the follow-up. In the group of patients not experiencing a relapse (n = 741), we observed a lower median REC at diagnosis (1.7%) that increase after surgery (2.6%) and remain stable until 10 y of follow-up (2.6% at 1 y and at 5 y of follow-up, 2.5% at 2 y and at 10 y of follow-up) (Figure 3a). The variation in REC distribution was statistically significant between the different timepoints according to Friedman test (p < .0001) and according to post-hoc multiple comparison Bonferroni–Dunn test. In the group of patients showing a relapse (N = 189), we observed a lower median REC at baseline (1.4%) and at relapse timepoint (1.5%), but a higher value after surgery (2.5%) and during cancer-free follow-up (2.5% at 1 y and at 5 y of follow-up, 2.7% at 2 y, and 2.1% at 10 y of follow-up) (Figure 3b). The Friedman and the post-hoc Bonferroni–Dunn test confirmed that the differences are statistically significant from baseline and from the relapse time with the other timepoints, with the only exception for the 10 y of follow-up, probably due to the insufficient number of observations at this timepoint. The details of REC and p value for comparisons at each timepoint are reported in Table 2.
Figure 3.
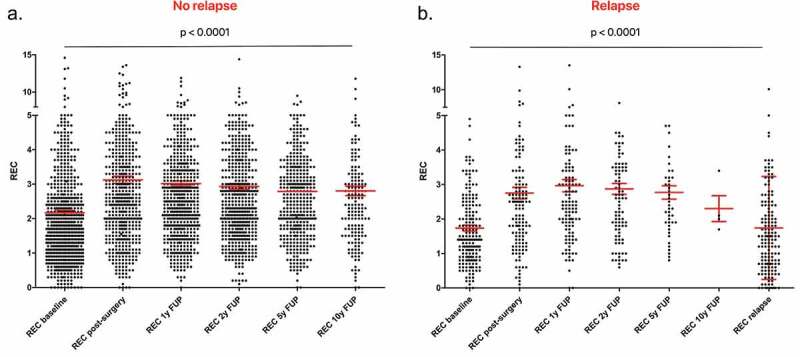
Scatter dot plot of REC at different timepoints.
Similarly, we observed a lower absolute eosinophil count at baseline and at relapse, but we did not reach the statistical significance in the comparison by pairs, even though the Friedman test was statistically significant (p < .0001). This is probably due to the low absolute variation of eosinophil count, considering that they are rare cells in normal conditions.
The differences in the distribution of RLC during the follow-up in the group of patients with and without relapse are statistically significant (p < .0001 with Friedman test in both the groups). In particular, we observed a lower median RLC after surgery (24.8% in patients without relapse and 24.5% in patients with relapse) compared to the baseline (29% and 27.4%, respectively) and at relapse timepoint (23.4%). The difference in the distribution of RLC during the cancer-free follow-up seems not to have any clinical relevance, being the median value oscillating between 27.2% and 31% for patients without relapse, and between 26.6% and 32.9% for patients with relapse (Supplementary Materials, Tables 7 and 8).
Interestingly, when considering the four breast cancer subtypes separately, we observed the same trend for REC variations in all the subgroups, with lower values in presence of cancer, i.e. at diagnosis and at relapse timepoints, than during cancer-free follow-up (Tables 3 and 4). The Friedman test showed that the differences are statistically significant in both the patients experiencing a relapse and the patients without a relapse.
Discussion
Eosinophils are a subset of granulocytes, generally involved in parasite infections and in allergic reactions. Their role has been studied in cancer, where they exert a protumorigenic or antitumorigenic role, acting with regulatory functions toward other immune cells or showing a direct cytotoxic activity.29 Recent studies showed that tumor-infiltrating eosinophils are able to secrete chemokines that attract CD8+ T cells into the tumor, induce vasculature normalization and M1 macrophage polarization, with consequent promotion of inflammation and phagocytic functions.30 Moreover, eosinophils express the major histocompatibility complex I and II (MHC I and II) on their cell surface, by which they can act as antigen-presenting cells, and they express costimulatory molecules, such as CD86, CD40, CD40 L and CD28, by which they can directly stimulate T cells.29,30 In addition, in a recent study, Mattes et al. showed that Th2 cells are responsible for the inhibition of metastases of melanoma in mice, through eosinophil recruitment into the tumor.31
Eosinophils could also act in a protumorigenic manner, promoting metastases through the secretion of metalloproteinase 9, promoting angiogenesis and tissue healing via growth factors (VEGF, FGF, PDGF) and polarizing macrophage to M2 phenotype with IL-4/IL-13 production.29,32
Tumor-associated tissue eosinophilia was widely studied in various cancer types, mainly in head and neck carcinoma, in which an increase in eosinophil count in non-metastatic cases compared to metastatic carcinomas was reported.33 The impact of tumor-associated tissue eosinophilia on cancer prognosis is controversial, with opposite results in different studies.34,35 Eosinophil infiltration of breast tumor is not frequently observed. In a study conducted by Samoszuk and colleagues, the eosinophil peroxidase within or around the tumor has been observed in about 88% of breast cancer, but in none of the benign breast tissue analyzed.36 In a transcriptomic study, conducted on almost 11 000 breast tumors, a computational approach (CIBERSORT) was used to study the immune infiltration at tumor site. This study showed that eosinophils were significantly associated with a better outcome in ER-positive patients, but not with an improved response to neoadjuvant chemotherapy.37 In addition, diagnostic core needle biopsies induce a selective recruitment of inflammatory cells, with an accumulation of eosinophils, and the enhancement of cancer cell proliferation in the adjacent area.38
Several authors studied eosinophils’ role in cancer in preclinical models. Injection of IL-33 in mice bearing B16-F10 melanoma resulted in reduced tumor growth associated with intratumoral accumulation of CD8+ T cells and eosinophils, reduction of myeloid-derived suppressor cells, higher expression of chemokines attracting eosinophils and CD8+ T cells, and higher expression of the activation markers for CD8+ and NK, CD107 and IFNγ, in the tumor and in the spleen.39 In favor of eosinophils’ activity against cancer, they observed that a concomitant depletion of eosinophils abolishes the antitumor effect of IL-33.37 Moreover, an intranasal administration of IL-33 reduces the number of tumor metastases to the lung through eosinophil recruitment, without involving CD8+ and NK cells.39 Concerning breast cancer, IL-33 can inhibit lung cancer metastasis in Balb/c mice injected with 4T1-Luc cells, promoting the production of TNF-α by macrophages, that induce the expression of ST2, the IL-33 receptor, on NK cells, leading to their activation.40 IL-33 promotes also the production of CCL5 by eosinophils and CD8+ T cells that recruit NK cells at tumor site.40 In other studies, IL-33 administration in breast cancer-bearing mice induces tumor progression through intratumoral accumulation of monocytic myeloid-derived suppressor cells (MDSC) and Foxp3+ Tregs cells, reducing the cytotoxicity and the tumor infiltration by NK cells, inducing cell proliferation and blood vessel density.41,42 Intravenous or intraperitoneal administration of IL-17E (IL-25) in a variety of xenograft tumor models, including breast cancer, showed an antitumoural activity alone or in combination with specific cancer therapeutics, inducing eosinophil expansion through the production of IL-5.43 Furthermore, a recent study showed that anti-CTLA4 treatment in a breast cancer model induces tumor vasculature normalization and increased responsiveness to the treatment through eosinophil infiltration.44
Concerning our report, it is the largest series of breast cancer patients actually reported in literature, focusing on circulating eosinophil predictive and prognostic power in various subtypes and treatment settings. Only two articles were published on breast cancer previously, showing opposite results, even though they were conducted on different populations, i.e. on all breast cancer subtypes in one paper and only on HER2-positive patients in the other one.8,9
In our study, we observed a better prognosis for patients with a higher REC at baseline, especially in patients not treated with chemotherapy or with anti-HER2 drugs. This is consistent with previous data on melanoma, in which the authors observed a benefit for patients with REC ≥ 1.5% treated with immunotherapy, but not for patients treated with chemotherapy.18 Patients treated with trastuzumab generally also receive chemotherapy, so we can consider the differences observed in the group receiving or not trastuzumab as a reflection of what observed for patients receiving or not chemotherapy. The lower magnitude of benefit in patients receiving chemotherapy could be explained by its effect on bone marrow, which leads to a lower production and differentiation of white blood cells, with a consequent lower number of circulating eosinophils during anticancer treatment. This hypothesis should be tested on preclinical models.
Interestingly, we observed in the subgroup of patients younger than 65-y-old a statistically significant benefit in TTF and in BCSS for patients with higher REC. For older patients, we observed the same trend of benefit, but the results were not statistically significant. This is probably due to the aging of immune system, which includes some changes that lead to an increased vulnerability of elderly people and probably to a lower anticancer activity.45
As expected, RLC is also associated with a better survival. The survival curves for TTF and BCSS show a wider separation considering RLC than REC. This is probably due to the stronger activity of lymphocytes against cancer, due to their known direct cytotoxic activity and for their higher frequency compared to eosinophils. Eosinophils seem, in fact, to be cells able to cooperate with other immune cells, such as lymphocytes, and acting by means of different mechanisms, as described above. Another possible explanation of the broad separation of the curves is the small sample size in the RLC-low group of only 53 patients, that could allow to identify a small percentage of patients with a very poor prognosis. Altogether, lymphocytes are not the only effector in cancer defense and the aim of our study is to explore the role of eosinophils as immune cells. Based on our results it seems that eosinophils act synergistically with lymphocytes. Thus, the combined parameter ELP has been proposed as a predictive and prognostic biomarker in hormone receptor-negative/HER2-positive and in TNBC, in our previous paper, and its value has been confirmed on all the subtypes in the present retrospective analysis.26 The use of the ELP is an innovative way to present the data, not previously proposed by other researchers. We think, in fact, that the use of product could maximize the effect of two biomarkers associated with a good outcome. Conversely, the use of a ratio can mask the positive effect of a variable, if the one at the denominator increases proportionally more than that at the numerator. This is not the case of the commonly used neutrophil to lymphocyte ratio, considering the pro-tumoral activity of neutrophils.46
In our study, we observed not only an association between relative eosinophil count and survival but also with relapse. This result has not been confirmed in the multivariate analysis, which means that another factor, such as lymph node involvement has a more important weight on the risk of recurrence. The same observation derives from the analysis of data on relative lymphocyte count, that are predictive of relapse in univariate analysis, but not in multivariate analysis.
Another interesting observation from our study concerns the variation of eosinophil count during the follow-up, with a lower count at diagnosis and at relapse, compared to the post-surgery timepoint and to the count during the cancer-free follow-up. We reported the same results in a previous study performed in a small cohort of hormone receptor-negative/HER2-positive and in TNBC treated with neoadjuvant chemotherapy.26 Here we observed these variations in a larger cohort, including all the breast cancer subtypes and other treatment settings. Interestingly, these variations are confirmed also when breast cancer subtypes are considered separately. According to this data, it seems that the presence of cancer could modify the relative eosinophil count, with a lower number of eosinophils in the presence of cancer. Moreover, in the group of patients classified as REC-high we observed a larger proportion of tumor with low-Ki67 and Luminal A. This should not be considered a disproportion in the group analyzed, but more likely seems to be an intrinsic characteristic of cancer, in which unfavorable factors are associated with lower REC at baseline. The REC variation observed could be linked to a tumor infiltration by the eosinophils or to a modification of eosinophil expansion and differentiation modulated by the cancer and should be investigated in in vivo models.
This study has the weakness to be retrospective, with a heterogeneous population and type of treatment. Conversely, the advantages of the study are the large sample size and to be focused on an innovative scientific issue. The variations of the circulating eosinophils reported in this work could therefore either be a consequence of the systemic perturbations caused by the disease or play an active role in the tumor development and/or response to treatment. The eosinophils could in fact not only be a simple biomarker but also a potential target for anticancer therapy. More studies are mandatory to better clarify their role in breast cancer: from preclinical studies with the aim to decipher the molecular interaction between eosinophils and cancer and to test the effect of a modulation of eosinophil count on cancer development, to prospective observational studies on breast cancer patients, to analyze the correspondence between circulating and tumor tissue eosinophils.
Supplementary Material
Acknowledgments
We acknowledge the data managers of the Medical Oncology Department of CHU Sart Tilman, Liège, Belgium.
Funding Statement
This work was supported by the Belgian Fund for Scientific Research (F.R.S.-FNRS), by Fondation contre le cancer, by Fondation Léon Frédéricq, and by the FIRS CHU Liege; F.R.S.-FNRS [F 5/4/140/5 - SD/CHU].
Disclosure statement
The authors declare that they have no conflict of interest.
Supplementary Material
Supplemental data for this article can be accessed here.
References
- 1.Bray F, Ferlay J, Soerjomataram I, Siegel RL, Torre LA, Jemal A.. Global cancer statistics 2018: GLOBOCAN estimates of incidence and mortality worldwide for 36 cancers in 185 countries. CA Cancer J Clin. 2018;68(6):394–11. doi: 10.3322/caac.21492. [DOI] [PubMed] [Google Scholar]
- 2.Denkert C, Loibl S, Noske A, Roller M, Müller BM, Komor M, Budczies J, Darb-Esfahani S, Kronenwett R, Hanusch C, et al. Tumor-associated lymphocytes as an independent predictor of response to neoadjuvant chemotherapy in breast cancer. J Clin Oncol. 2010;28(1):105–113. doi: 10.1200/JCO.2009.23.7370. [DOI] [PubMed] [Google Scholar]
- 3.Dieci MV, Criscitiello C, Goubar A, Viale G, Conte P, Guarneri V, Ficarra G, Mathieu MC, Delaloge S, Curigliano G, et al. Prognostic value of tumor-infiltrating lymphocytes on residual disease after primary chemotherapy for triple-negative breast cancer: a retrospective multicenter study. Ann Oncol. 2014;25(3):611–618. doi: 10.1093/annonc/mdt556. [DOI] [PMC free article] [PubMed] [Google Scholar]
- 4.Ono M, Tsuda H, Shimizu C, Yamamoto S, Shibata T, Yamamoto H, Hirata T, Yonemori K, Ando M, Tamura K, Katsumata N. Tumor-infiltrating lymphocytes are correlated with response to neoadjuvant chemotherapy in triple-negative breast cancer. Breast Cancer Res Treat. 2012;132(3):793–805. doi: 10.1007/s10549-011-1554-7. [DOI] [PubMed] [Google Scholar]
- 5.Peng GL, Li L, Guo YW, Yu P, Yin XJ, Wang S, Liu CP. CD8(+) cytotoxic and FoxP3(+) regulatory T lymphocytes serve as prognostic factors in breast cancer. Am J Transl Res. 2019;11(8):5039–5053. [PMC free article] [PubMed] [Google Scholar]
- 6.Ladoire S, Arnould L, Apetoh L, Coudert B, Martin F, Chauffert B, Fumoleau P, Ghiringhelli F. Pathologic complete response to neoadjuvant chemotherapy of breast carcinoma is associated with the disappearance of tumor-infiltrating foxp3+ regulatory T cells. Clin Cancer Res. 2008;14(8):2413–2420. doi: 10.1158/1078-0432.CCR-07-4491. [DOI] [PubMed] [Google Scholar]
- 7.Liu F, Lang R, Zhao J, Zhang X, Pringle GA, Fan Y, Yin D, Gu F, Yao Z, Fu L, et al. CD8⁺ cytotoxic T cell and FOXP3⁺ regulatory T cell infiltration in relation to breast cancer survival and molecular subtypes. Breast Cancer Res Treat. 2011;130(2):645–655. doi: 10.1007/s10549-011-1647-3. [DOI] [PubMed] [Google Scholar]
- 8.Gündüz S, Göksu SS, Arslan D, Tatli AM, Uysal M, Gündüz UR, Sevinç MM, Coşkun HS, Bozcuk H, Mutlu H, Savas B. Factors affecting disease-free survival in patients with human epidermal growth factor receptor 2-positive breast cancer who receive adjuvant trastuzumab. Mol Clin Oncol. 2015;3(5):1109–1112. doi: 10.3892/mco.2015.610. [DOI] [PMC free article] [PubMed] [Google Scholar]
- 9.Ownby HE, Roi LD, Isenberg RR, Brennan MJ. Peripheral lymphocyte and eosinophil counts as indicators of prognosis in primary breast cancer. Cancer. 1983;52(1):126–130. doi:. [DOI] [PubMed] [Google Scholar]
- 10.Papatestas AE, Lesnick GJ, Genkins G, Aufses AH Jr.. The prognostic significance of peripheral lymphocyte counts in patients with breast carcinoma. Cancer. 1976;37(1):164–168. doi:. [DOI] [PubMed] [Google Scholar]
- 11.Vicente Conesa MA, Garcia-Martinez E, Gonzalez Billalabeitia E, Chaves Benito A, Garcia Garcia T, Vicente Garcia V, Ayala de la Peña F. Predictive value of peripheral blood lymphocyte count in breast cancer patients treated with primary chemotherapy. Breast. 2012;21(4):468–474. doi: 10.1016/j.breast.2011.11.002. [DOI] [PubMed] [Google Scholar]
- 12.Pattison CW, Woods KL, Morrison JM. Lymphocytopenia as an independent predictor of early recurrence in breast cancer. Br J Cancer. 1987;55(1):75–76. doi: 10.1038/bjc.1987.15. [DOI] [PMC free article] [PubMed] [Google Scholar]
- 13.Koh CH, Bhoo-Pathy N, Ng KL, Jabir RS, Tan GH, See MH, Jamaris S, Taib NA. Utility of pre-treatment neutrophil-lymphocyte ratio and platelet-lymphocyte ratio as prognostic factors in breast cancer. Br J Cancer. 2015;113(1):150–158. doi: 10.1038/bjc.2015.183. [DOI] [PMC free article] [PubMed] [Google Scholar]
- 14.Zenan H, Zixiong L, Zhicheng Y, Mei H, Xiongbin Y, Tiantian W, Min D, Renbin L, Changchang J. Clinical prognostic evaluation of immunocytes in different molecular subtypes of breast cancer. J Cell Physiol. 2019;234(11):20584–20602. doi: 10.1002/jcp.28662. [DOI] [PubMed] [Google Scholar]
- 15.Balatoni T, Ladányi A, Fröhlich G, Czirbesz K, Kovács P, Pánczél G, Bence E, Plótár V, Liszkay G. Biomarkers associated with clinical outcome of advanced melanoma patients treated with ipilimumab. Pathol Oncol Res. 2020;26(1):317–325. doi: 10.1007/s12253-018-0466-9. [DOI] [PubMed] [Google Scholar]
- 16.Bernard-Tessier A, Jeanville P, Champiat S, Lazarovici J, Voisin AL, Mateus C, Lambotte O, Annereau M, Michot J-M. Immune-related eosinophilia induced by anti-programmed death 1 or death-ligand 1 antibodies. Eur J Cancer. 2017;81:135–137. doi: 10.1016/j.ejca.2017.05.017. [DOI] [PubMed] [Google Scholar]
- 17.Delyon J, Mateus C, Lefeuvre D, Lanoy E, Zitvogel L, Chaput N, Roy S, Eggermont AMM, Routier E, Robert C, et al. Experience in daily practice with ipilimumab for the treatment of patients with metastatic melanoma: an early increase in lymphocyte and eosinophil counts is associated with improved survival. Ann Oncol. 2013;24(6):1697–1703. doi: 10.1093/annonc/mdt027. [DOI] [PubMed] [Google Scholar]
- 18.Ferrucci PF, Gandini S, Cocorocchio E, Pala L, Baldini F, Mosconi M, Cappellini GCA, Albertazzi E, Martinoli C. Baseline relative eosinophil count as a predictive biomarker for ipilimumab treatment in advanced melanoma. Oncotarget. 2017;8(45):79809–79815. doi: 10.18632/oncotarget.19748. [DOI] [PMC free article] [PubMed] [Google Scholar]
- 19.Martens A, Wistuba-Hamprecht K, Geukes Foppen M, Yuan J, Postow MA, Wong P, Romano E, Khammari A, Dreno B, Capone M, et al. Baseline peripheral blood biomarkers associated with clinical outcome of advanced melanoma patients treated with ipilimumab. Clin Cancer Res. 2016;22(12):2908–2918. doi: 10.1158/1078-0432.CCR-15-2412. [DOI] [PMC free article] [PubMed] [Google Scholar]
- 20.Moreira A, Leisgang W, Schuler G, Heinzerling L. Eosinophilic count as a biomarker for prognosis of melanoma patients and its importance in the response to immunotherapy. Immunotherapy. 2017;9(2):115–121. doi: 10.2217/imt-2016-0138. [DOI] [PubMed] [Google Scholar]
- 21.Nakamura Y, Tanaka R, Maruyama H, Ishitsuka Y, Okiyama N, Watanabe R, Fujimoto M, Fujisawa Y. Correlation between blood cell count and outcome of melanoma patients treated with anti-PD-1 antibodies. Jpn J Clin Oncol. 2019;49(5):431–437. doi: 10.1093/jjco/hyy201. [DOI] [PubMed] [Google Scholar]
- 22.Rosner S, Kwong E, Shoushtari AN, Friedman CF, Betof AS, Brady MS, Coit DG, Callahan MK, Wolchok JD, Chapman PB, et al. Peripheral blood clinical laboratory variables associated with outcomes following combination nivolumab and ipilimumab immunotherapy in melanoma. Cancer Med. 2018;7(3):690–697. doi: 10.1002/cam4.1356. [DOI] [PMC free article] [PubMed] [Google Scholar]
- 23.Sibille A, Henket M, Corhay JL, Louis R, Duysinx B. Clinical benefit to programmed death-1 inhibition for non-small-cell lung cancer is associated with higher blood eosinophil levels. Acta Oncol. 2020;59(3):257–259. doi: 10.1080/0284186X.2019.1695063. [DOI] [PubMed] [Google Scholar]
- 24.Soyano AE, Dholaria B, Marin-Acevedo JA, Diehl N, Hodge D, Luo Y, Manochakian R, Chumsri S, Adjei A, Knutson KL, et al. Peripheral blood biomarkers correlate with outcomes in advanced non-small cell lung Cancer patients treated with anti-PD-1 antibodies. J Immunother Cancer. 2018;6(1):129. doi: 10.1186/s40425-018-0447-2. [DOI] [PMC free article] [PubMed] [Google Scholar]
- 25.Weide B, Martens A, Hassel JC, Berking C, Postow MA, Bisschop K, Simeone E, Mangana J, Schilling B, Di Giacomo AM, et al. Baseline biomarkers for outcome of melanoma patients treated with pembrolizumab. Clin Cancer Res. 2016;22(22):5487–5496. doi: 10.1158/1078-0432.CCR-16-0127. [DOI] [PMC free article] [PubMed] [Google Scholar]
- 26.Onesti CE, Josse C, Poncin A, Frères P, Poulet C, Bours V, Jerusalem G. Predictive and prognostic role of peripheral blood eosinophil count in triple-negative and hormone receptor-negative/HER2-positive breast cancer patients undergoing neoadjuvant treatment. Oncotarget. 2018;9(72):33719–33733. doi: 10.18632/oncotarget.26120. [DOI] [PMC free article] [PubMed] [Google Scholar]
- 27.Bellera CA, Penel N, Ouali M, Bonvalot S, Casali PG, Nielsen OS, Delannes M, Litière S, Bonnetain F, Dabakuyo TS, et al. Guidelines for time-to-event end point definitions in sarcomas and gastrointestinal stromal tumors (GIST) trials: results of the DATECAN initiative (Definition for the Assessment of Time-to-event Endpoints in CANcer trials). Ann Oncol. 2015;26(5):865–872. doi: 10.1093/annonc/mdu360. [DOI] [PubMed] [Google Scholar]
- 28.Gourgou-Bourgade S, Cameron D, Poortmans P, Asselain B, Azria D, Cardoso F, A’Hern R, Bliss J, Bogaerts J, Bonnefoi H, et al. Guidelines for time-to-event end point definitions in breast cancer trials: results of the DATECAN initiative (Definition for the Assessment of Time-to-event Endpoints in CANcer trials)†. Ann Oncol. 2015;26(5):873–879. doi: 10.1093/annonc/mdv106. [DOI] [PubMed] [Google Scholar]
- 29.Reichman H, Karo-Atar D, Munitz A. Emerging roles for eosinophils in the tumor microenvironment. Trends Cancer. 2016;2(11):664–675. doi: 10.1016/j.trecan.2016.10.002. [DOI] [PubMed] [Google Scholar]
- 30.Carretero R, Sektioglu IM, Garbi N, Salgado OC, Beckhove P, Hämmerling GJ. Eosinophils orchestrate cancer rejection by normalizing tumor vessels and enhancing infiltration of CD8(+) T cells. Nat Immunol. 2015;16(6):609–617. doi: 10.1038/ni.3159. [DOI] [PubMed] [Google Scholar]
- 31.Mattes J, Hulett M, Xie W, Hogan S, Rothenberg ME, Foster P, Parish C. Immunotherapy of cytotoxic T cell-resistant tumors by T helper 2 cells: an eotaxin and STAT6-dependent process. J Exp Med. 2003;197(3):387–393. doi: 10.1084/jem.20021683. [DOI] [PMC free article] [PubMed] [Google Scholar]
- 32.Gatault S, Legrand F, Delbeke M, Loiseau S, Capron M. Involvement of eosinophils in the anti-tumor response. Cancer Immunol Immunother. 2012;61(9):1527–1534. doi: 10.1007/s00262-012-1288-3. [DOI] [PMC free article] [PubMed] [Google Scholar]
- 33.Jain M, Kasetty S, Sudheendra US, Tijare M, Khan S, Desai A. Assessment of tissue eosinophilia as a prognosticator in oral epithelial dysplasia and oral squamous cell carcinoma-an image analysis study. Patholog Res Int. 2014;2014:507512. [DOI] [PMC free article] [PubMed] [Google Scholar]
- 34.De Paz D, Chang KP, Kao HK, Lao WW, Huang YC, Chang YL, Huang Y. Clinical implications of tumor-associated tissue eosinophilia in tongue squamous cell carcinoma. Laryngoscope. 2019;129(5):1123–1129. doi: 10.1002/lary.27413. [DOI] [PubMed] [Google Scholar]
- 35.Peurala E, Tuominen M, Löyttyniemi E, Syrjänen S, Rautava J. Eosinophilia is a favorable prognostic marker for oral cavity and lip squamous cell carcinoma. APMIS. 2018;126(3):201–207. doi: 10.1111/apm.12809. [DOI] [PubMed] [Google Scholar]
- 36.Samoszuk MK, Nguyen V, Gluzman I, Pham JH. Occult deposition of eosinophil peroxidase in a subset of human breast carcinomas. Am J Pathol. 1996;148:701–706. [PMC free article] [PubMed] [Google Scholar]
- 37.Ali HR, Chlon L, Pharoah PD, Markowetz F, Caldas C, Ladanyi M. Patterns of immune infiltration in breast cancer and their clinical implications: a gene-expression-based retrospective study. PLoS Med. 2016;13(12):e1002194. doi: 10.1371/journal.pmed.1002194. [DOI] [PMC free article] [PubMed] [Google Scholar]
- 38.Szalayova G, Ogrodnik A, Spencer B, Wade J, Bunn J, Ambaye A, James T, Rincon M. Human breast cancer biopsies induce eosinophil recruitment and enhance adjacent cancer cell proliferation. Breast Cancer Res Treat. 2016;157(3):461–474. doi: 10.1007/s10549-016-3839-3. [DOI] [PMC free article] [PubMed] [Google Scholar]
- 39.Lucarini V, Ziccheddu G, Macchia I, La Sorsa V, Peschiaroli F, Buccione C, Sistigu A, Sanchez M, Andreone S, D’Urso MT. IL-33 restricts tumor growth and inhibits pulmonary metastasis in melanoma-bearing mice through eosinophils. Oncoimmunology. 2017;6(6):e1317420. doi: 10.1080/2162402X.2017.1317420. [DOI] [PMC free article] [PubMed] [Google Scholar]
- 40.Qi L, Zhang Q, Miao Y, Kang W, Tian Z, Xu D, Xiao W, Fang F. Interleukin-33 activates and recruits natural killer cells to inhibit pulmonary metastatic cancer development. Int J Cancer. 2020;146(5):1421–1434. doi: 10.1002/ijc.32779. [DOI] [PubMed] [Google Scholar]
- 41.Jovanovic IP, Pejnovic NN, Radosavljevic GD, Pantic JM, Milovanovic MZ, Arsenijevic NN, Lukic ML. Interleukin-33/ST2 axis promotes breast cancer growth and metastases by facilitating intratumoral accumulation of immunosuppressive and innate lymphoid cells. Int J Cancer. 2014;134(7):1669–1682. doi: 10.1002/ijc.28481. [DOI] [PubMed] [Google Scholar]
- 42.Xiao P, Wan X, Cui B, Liu Y, Qiu C, Rong J, Zheng M, Song Y, Chen L, He J, et al. Interleukin 33 in tumor microenvironment is crucial for the accumulation and function of myeloid-derived suppressor cells. Oncoimmunology. 2016;5(1):e1063772. doi: 10.1080/2162402X.2015.1063772. [DOI] [PMC free article] [PubMed] [Google Scholar]
- 43.Benatar T, Cao MY, Lee Y, Lightfoot J, Feng N, Gu X, Lee V, Jin H, Wang M, Wright JA, et al. IL-17E, a proinflammatory cytokine, has antitumor efficacy against several tumor types in vivo. Cancer Immunol Immunother. 2010;59(6):805–817. doi: 10.1007/s00262-009-0802-8. [DOI] [PMC free article] [PubMed] [Google Scholar]
- 44.Zheng X, Zhang N, Qian L, Wang X, Fan P, Kuai J, Lin S, Liu C, Jiang W, Qin S, et al. CTLA4 blockade promotes vessel normalization in breast tumors via the accumulation of eosinophils. Int J Cancer. 2020;146(6):1730–1740. doi: 10.1002/ijc.32829. [DOI] [PubMed] [Google Scholar]
- 45.Nikolich-Žugich J. The twilight of immunity: emerging concepts in aging of the immune system. Nat Immunol. 2018;19(1):10–19. doi: 10.1038/s41590-017-0006-x. [DOI] [PubMed] [Google Scholar]
- 46.Wu L, Saxena S, Awaji M, Singh RK. Tumor-associated neutrophils in cancer: going pro. Cancers. 2019;11(4):4. doi: 10.3390/cancers11040564. [DOI] [PMC free article] [PubMed] [Google Scholar]
Associated Data
This section collects any data citations, data availability statements, or supplementary materials included in this article.