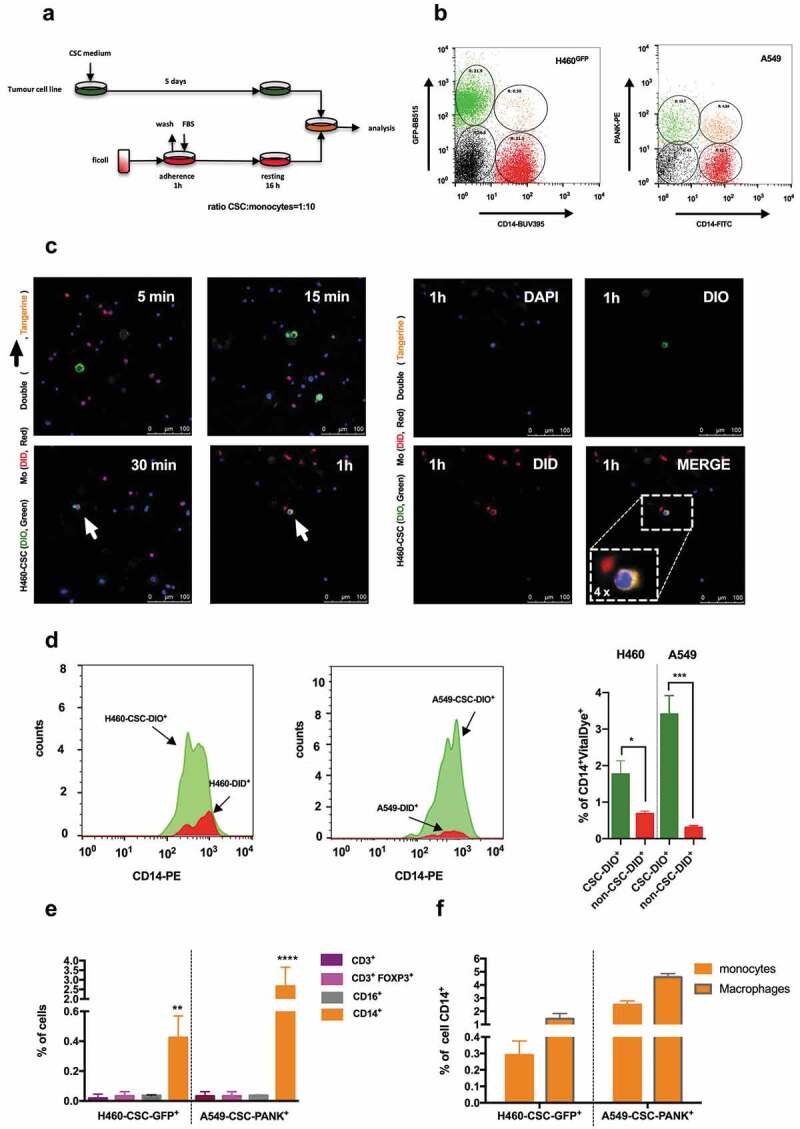
Figure 1.

Co-culture in vitro of cancer stem cells and human monocytes generates hybrid cells.
(a) Pipeline for in vitro fusion assays between cancer stem cells (green) and PBMCs’ isolated monocytes (red, CD14+). (b) Representative FACS analysis (n = 9; GFP+ and PANK+, green; CD14+, red) of hybrids yielding after 5 days of fusion assays with H460GFP-CSC (tangerine in left panel, GFP+CD14+) and A549-CSC (tangerine in right panel, PANK+CD14+). (c) Representative confocal images of double-positive events with vital colorants DIO (green, H460-CSC), DID (red, monocytes) and DAPI for nuclei (blue), after 5 min (i), 15 min (ii), 30 min (iii) and 1 h (iv) of co-culture (left panel); arrows indicate double-positive events (co-localization, tangerine), n = 3. In the right panel, the representative image at 1 h (iv) in the left panel, is first unmerged for the three channels (v, blue; vi, green; vii, red) and then magnified (4x) to clearly showing merged (viii) colors in a hybrid cell. (d) Representative overlay of histograms for FACS analysis of resulting fusions between human monocytes and H460-CSC (green, DIO+) vs. H460 (red, DID+) in the left panel, and A549-CSC (green, DIO+) vs. A549 (red, DID+) in the central panel, in a competition assay in which equal quantities of DIO+ and DID+ tumor cells were co-cultured with CD14+ monocytes for 5 days (ratio tumor cells:monocytes = 1:10). In the right panel, statistical resume of the results (n = 3; *p < .05, ***p < .001, two-tailed t-test, data are mean ± SD). (e) Analysis of resulting fusion events between H460GFP-CSC (left) and A549-CSC (right) with lymphocytes (CD3+), Treg (CD25+ FOXP3+), neutrophils (CD16+) and monocytes (CD14+) (for each one, n = 3; **p <.01, ****p < .0001, two-tailed t-test, data are mean ± SD). (f) Analysis of hybrids yielding from fusions between H460GFP-CSC (left) and A549-CSC (right) with monocytes or macrophages (bordered bars) after 5 days of co-cultures.
