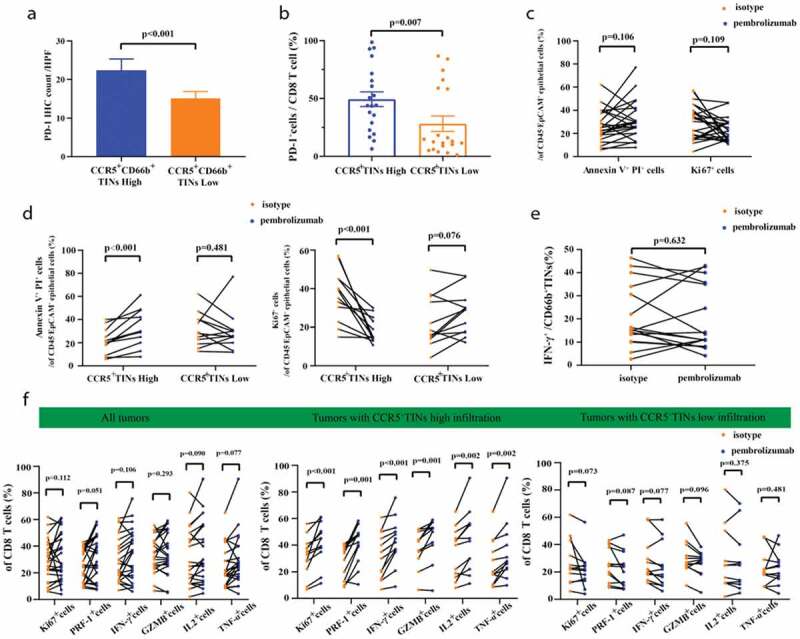
Figure 5.

High infiltration of CCR5+CD66b+TINs in MIBC could be associated with superior pembrolizumab response. (a) Quantification analysis (left) of PD-1 expression level between CCR5+TIN high/low subgroups in MIBC tissue microarray (TMA) by immunohistochemistry (IHC) (n = 141). (b) Flow cytometric analysis (right) of the PD-1+CD8+T cell frequencies of CD8 T cells (n = 40) between CCR5+CD66b+TINs high/low subgroups in fresh samples of MIBC. CCR5+CD66b+TINs High/low were grouped by median. (a-b) Data were analyzed using Mann-Whiney U test, and presented as mean ± SEM. (c) Flow cytometric analysis (left) of the Annexin V+ PI+ cells frequencies and Ki67+ cells frequencies of CD45−EpCAM+epithelial cells (n = 24) in fresh samples treated with isotype or Pembrolizumab for 12 hours. (d) Flow cytometric analysis of the Annexin V+PI+ cells frequencies and Ki67+ cells frequencies of CD45−EpCAM+epithelial cells (n = 24) in CCR5+CD66b+TINs high/low subgroups. (e) Flow cytometric analysis of the IFN-γ+ cells frequencies of CD66b+TINs cells (n = 16) in fresh samples treated with isotype or pembrolizumab for 12 hours. (f) Flow cytometric analysis of the Ki67+, PRF-1+, IFN-γ+, GZMB+, IL2+, TNF-α+ cells frequencies of CD8 T cells (n = 24) in fresh samples treated with isotype or pembrolizumab for 12 hours. (d, f) CCR5+ CD66b+TINs High/low were grouped by median. (c-f) Data were analyzed using Wilcoxon signed-rank test, and presented as mean ± SEM. IFN = interferon; GZMB = granzyme B; PRF-1 = perforin; TNF = Tumor Necrosis Factor.
