

Abstract
Aim: Previous studies on peripheral artery disease (PAD) only enrolled patients with atherosclerotic lesion limited to any one of isolated locations (aortoiliac [AI], femoropopliteal [FP], and below the knee [BTK]). However, the interventions for PAD in a real-world clinical setting are often simultaneously performed for several different locations.
Methods: We conducted a prospective multicenter study that included 2,230 patients with PAD who received intervention for lower extremity lesions in each area and across different areas. Patients were divided into 7 groups according to the combination of treatment locations. Overall survival (OS), major adverse limb events (MALEs), and risk factors for OS and MALEs were statistically analyzed.
Results: After adjustment for confounding factors, the attributable risk for OS was similar among isolated AI, FP, and BTK treatments. MALEs increased in correlation with the number of treatment locations. Dialysis and critical limb ischemia were the common risk factors for OS and MALEs. However, the contribution of other factors such as type of drug usage was different according to treatment locations.
Conclusions: In patients with PAD, OS was largely defined by comorbidities but not by lesion location. The background risk factors, underlying comorbidities, and event rates were different according to PAD location, suggesting that stratified treatment should be established for different patient populations.
Keywords: Endovascular therapy, Peripheral artery disease, Target location, Real-world data
Introduction
Peripheral artery disease (PAD) is a systemic atherothrombotic disease in which plaque builds up in the arteries that supply blood to the limbs. Approximately 200 million individuals worldwide are estimated to experience lower extremity PAD1). Despite remarkable advances in both medication and intervention therapies, the global prevalence of PAD continues to increase, and patients with PAD are at a high risk for developing major adverse cardiovascular events and major adverse limb events (MALEs)2, 3). To date, several previous studies have reported the prognosis and therapeutic outcomes of PAD4–6). Prior studies on endovascular therapy (EVT) examined target lesions limited to any one of isolated locations (aortoiliac [AI], femoropopliteal [FP], and below the knee [BTK]); however, the interventions for PAD in a real-world clinical setting are often simultaneously performed for several different locations. In addition, no previous prospective study on EVT has included all indications (claudication, critical limb ischemia, and acute limb ischemia) for patients with PAD. Therefore, a prospective multicenter study that covers all locations and indications is required to reveal real-world data.
Our group has recently reported the Toma-Code (TOkyo taMA peripheral vascular intervention research COmraDE study) registry7). This registry is unique in that it prospectively enrolled all patients with PAD at each lower limb location and did not exclude patients with multiple lesions. Moreover, this registry included all indications (claudication, critical limb ischemia, and acute limb ischemia).
Aim
The present study aimed to clarify patient characteristics and prognosis according to different treatment locations; to evaluate difference in the prognostic impact of treatment locations and their combinations using real-world data from the Toma-Code registry; and to clarify difference in risk factors for each treatment location.
Methods
Study Population and Design
The Toma-Code registry is a multicenter prospective registry that included 2230 consecutive patients with lower extremity PAD who underwent EVT in Japan from August 2014 to August 2016. All therapeutic indications were judged based on 2016 AHA/ACC Guideline on PAD7). A total of 6 university hospitals, 23 general hospitals, and 5 cardiovascular specialty hospitals participated in this study. The number of EVT procedures performed at these 34 hospitals per year was as follows: 2 facilities, 1–20; 7 facilities, 21–50; 11 facilities, 51–100; 7 facilities, 101–150; 3 facilities, 151–200; 2 facilities, 201–300; and 2 facilities, ≥ 301. The follow-up rate was 97.4% (prognostic data of 2,173 patients were analyzed), and the median follow-up period was 10.4 months.
In the present study, the participants were divided into the following 7 groups according to the combination of treatment locations: AI, FP, BTK, AI + FP, FP + BTK, AI + BTK, and AI + FP + BTK. Additionally, we studied the prognosis of each group. For example, if a patient received EVT in the AI and FP areas, then the patient would be assigned to the AI + FP group.
Clinical Measurements and Outcomes
Clinical measurement methods in the Toma-Code registry have been previously published8). Briefly, demographic, laboratory, and procedural data were collected from each patient's hospital chart or from database by independent researchers according to predetermined definitions, and the independent study office collectively managed all data. Patients were followed up at 1, 6, 12, 18, and 24 months after EVT. The major endpoints were all-cause death (overall survival [OS]) and MALEs, which were recorded from each institution's electronic health record system. A telephone survey of patients who were not followed up at each hospital after EVT was conducted to obtain recent information. MALE was defined as unscheduled major amputation, unscheduled major lower limb surgery or endovascular treatment, and acute limb ischemia event that required hospitalization. Furthermore, acute limb ischemia event was defined as limb-threatening ischemia that was confirmed using limb hemodynamic parameters or imaging and that led to the provision of an acute vascular intervention within 14 days of symptom onset9). Critical limb ischemia was defined as chronic ischemic pain at rest, ulcers, or gangrene, resulting in hospitalization and intervention7). Major amputation was defined as amputation due to a vascular event above the forefoot.
The study was performed in accordance with the Declaration of Helsinki and was approved by the ethics committee of Sakakibara Heart Institute (reference no. 14-023) and the committees of each participating facility. All patients provided written informed consent for their participation in the study. This study was registered at the University Hospital Medical Information Network-Clinical Trials Registry (UMIN-CTR no. UMIN000015100).
Statistical Analysis
Baseline parameters of each treatment location group are expressed as mean with standard deviation for continuous variables and as frequencies and proportions (percentages) for categorical variables. Difference among treatment location groups was assessed using analysis of variance and Fisher's exact test for continuous and categorical variables, respectively. Kaplan–Meier (KM) methods and log-rank test were employed to assess the effect of each treatment location group on the endpoints (OS, MALEs). Hazard ratios of each variable for endpoints (OS, MALEs) were calculated using Cox multivariate analysis after adjustment for potential confounding factors such as comorbidities and type of drug usage. All analyses were performed using SAS software package version 9.4 (SAS Institute, Cary, NC, USA). A probability value of p < 0.05 for all tests was considered statistically significant.
Results
Study Population Characteristics
A total of 2230 patients were enrolled within the study period and were distributed as follows to each combination of treatment locations: AI, 461 patients; FP, 850 patients; BTK, 230 patients; AI + FP, 314 patients; FP + BTK, 321 patients; AI + BTK, 10 patients; and AI + FP + BTK, 44 patients. Fig. 1 shows the distribution of patients in this study. Only 10 procedures were performed in the AI + BTK group, which were difficult to statistically analyze; hence, we did not include this group in the subsequent analysis.
Fig. 1.
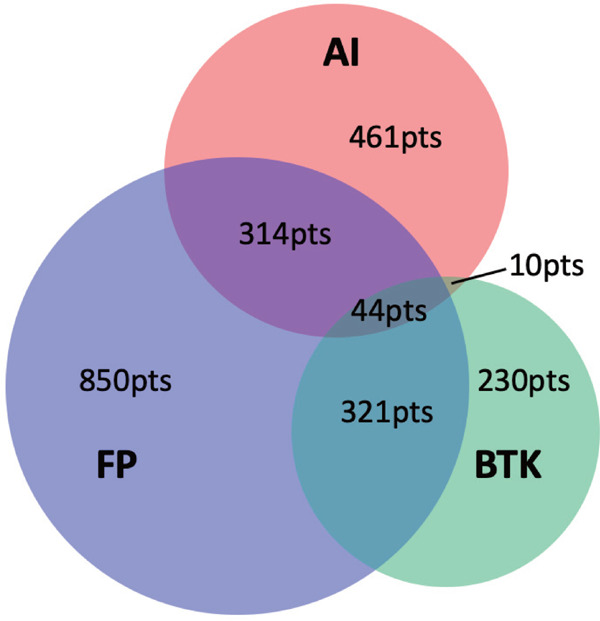
Numbers of interventional procedures performed at each different disease location
Venn diagram of procedure counts for each different disease location and their combinations. AI, aortoiliac; BTK, below the knee; FP, femoropopliteal; pts, patients.
Clinical characteristics and laboratory data before EVT are summarized in Table 1. The patients in this study were predominantly males (71.5%). Patients who received EVT at locations that involved the BTK area (BTK, AI + BTK, FP + BTK) tended to have a low body mass index (< 18), severe diabetes mellitus (DM) requiring insulin treatment, dialysis complication, heart failure, coronary artery disease, cerebrovascular disease, and history of major amputation. Furthermore, they tended to receive EVT more for critical limb ischemia than for claudication as treatment indication.
Table 1. Baseline patient characteristics of each EVT group.
| AI (n = 461) |
FP (n = 850) |
BTK (n = 230) |
AI + FP (n = 314) |
FP + BTK (n = 321) |
AI + FP + BTK (n = 44) |
AI + BTK (n = 10) |
p-value | |
|---|---|---|---|---|---|---|---|---|
| Age, mean ± SD (years) | 72.6 ± 8.4 | 73.2 ± 9.3 | 71.4 ± 11.5 | 74.1 ± 8.5 | 74.7 ± 9.4 | 74.3 ± 8.2 | 76.6 ± 10.3 | 0.001 |
| Male gender, n (%) | 376 (81.6%) | 574 (67.5%) | 167 (72.6%) | 238 (75.8%) | 200 (62.3%) | 33 (75.0%) | 7 (70%) | < 0.0001 |
| BMI, mean ± SD (kg/m2) | 22.7 ± 3.0 | 22.8 ± 3.6 | 22.4 ± 3.9 | 22.1 ± 3.9 | 21.7 ± 3.9 | 21.1 ± 3.3 | 18.7 ± 3.0 | < 0.0001 |
| BMI < 18, n (%) | 16 (3.5%) | 55 (6.5%) | 28 (12.5%) | 37 (11.9%) | 45 (14.2%) | 8 (18.2%) | 4 (40.0%) | < 0.0001 |
| ABI (Rt), mean ± SD | 0.82 ± 0.23 | 0.78 ± 0.21 | 0.91 ± 0.24 | 0.70 ± 0.20 | 0.77 ± 0.23 | 0.67 ± 0.21 | 0.92 ± 0.16 | < 0.0001 |
| ABI (Lt), mean ± SD | 0.78 ± 0.22 | 0.78 ± 0.21 | 0.89 ± 0.24 | 0.66 ± 0.19 | 0.78 ± 0.22 | 0.69 ± 0.24 | 0.95 ± 0.24 | < 0.0001 |
| SBP, mean ± SD (mmHg) | 136.7 ± 21.4 | 138.2 ± 23.0 | 135.82 ± 34.5 | 138.3 ± 23.4 | 139.1 ± 24.7 | 148.7 ± 29.0 | 137.7 ± 24.7 | 0.038 |
| DBP, mean ± SD (mmHg) | 74.2 ± 14.5 | 74.1 ± 13.9 | 74.17 ± 15.1 | 72.6 ± 12.9 | 72.9 ± 14.6 | 78.2 ± 14.6 | 74.4 ± 16.3 | 0.220 |
| HR, mean ± SD (bpm) | 73.5 ± 13.7 | 74.7 ± 13.7 | 80.74 ± 14.8 | 75.5 ± 16.1 | 77.3 ± 16.7 | 75.1 ± 16.9 | 74.5 ± 15.3 | < 0.0001 |
| DM (diet therapy), n (%) | 40 (8.7%) | 81 (9.5%) | 28 (12.2%) | 38 (12.1%) | 31 (9.7%) | 5 (11.4%) | 3 (30.0%) | < 0.0001 |
| DM (oral drug), n (%) | 100 (21.7%) | 250 (29.4%) | 61 (26.5%) | 81 (25.8%) | 105 (32.7%) | 13 (29.5%) | 1 (10.0%) | |
| DM (insulin), n (%) | 54 (11.7%) | 171 (20.1%) | 64 (27.8%) | 44 (14.0%) | 82 (25.5%) | 11 (25.0%) | 2 (20.0%) | |
| Past smoker, n (%) | 184 (39.9%) | 303 (35.6%) | 82 (35.7%) | 108 (34.4%) | 97 (30.2%) | 15 (34.1%) | 5 (50.0%) | < 0.0001 |
| Current smoker, n (%) | 121 (26.3%) | 209 (24.6%) | 36 (15.7%) | 91 (29.0%) | 36 (11.2%) | 9 (20.5%) | 3 (30.0%) | |
| HTN, n (%) | 378 (82.0%) | 735 (86.5%) | 166 (72.2%) | 266 (84.7%) | 249 (77.6%) | 38 (86.4%) | 7 (70.0%) | < 0.0001 |
| DL, n (%) | 299 (64.9%) | 526 (61.9%) | 104 (45.2%) | 186 (59.2%) | 132 (41.1%) | 23 (52.3%) | 2 (20.0%) | < 0.0001 |
| Dialysis, n (%) | 45 (9.8%) | 182 (21.4%) | 148 (64.3%) | 62 (19.7%) | 153 (47.7%) | 16 (36.4%) | 3 (30.0%) | < 0.0001 |
| Heart failure, n (%) | 37 (8.0%) | 97 (11.4%) | 42 (18.3%) | 35 (11.1%) | 53 (16.5%) | 10 (22.7%) | 0 (0%) | < 0.0001 |
| LVEF < 50%, n (%) | 34 (7.4%) | 81 (9.5%) | 43 (18.7%) | 33 (10.5%) | 43 (13.4%) | 3 (6.8%) | 2 (20.0%) | < 0.0001 |
| CAD, n (%) | 202 (43.8%) | 405 (47.6%) | 120 (52.2%) | 140 (44.6%) | 166 (51.7%) | 22 (50.0%) | 3 (30.0%) | 0.160 |
| CVD, n (%) | 51 (11.1%) | 121 (14.2%) | 38 (16.5%) | 47 (15.0%) | 55 (17.1%) | 11 (25.0%) | 0 (0%) | 0.047 |
| AF, n (%) | 38 (8.2%) | 75 (8.8%) | 34 (14.8%) | 35 (11.1%) | 54 (16.8%) | 6 (13.6%) | 1 (10.0%) | < 0.0001 |
| Non-ambulatory status, n (%) | 14 (3.0%) | 54 (6.4%) | 38 (16.5%) | 25 (8.0%) | 80 (24.9%) | 13 (29.5%) | 2 (20.0%) | < 0.0001 |
| AS, n (%) | 7 (1.5%) | 10 (1.2%) | 9 (3.9%) | 7 (2.2%) | 16 (5.0%) | 0 (0%) | 0 (0%) | 0.008 |
| Hx of major amputation, n (%) | 4 (0.9%) | 18 (2.1%) | 17 (7.4%) | 4 (1.3%) | 24 (7.5%) | 4 (9.1%) | 0 (0%) | < 0.0001 |
| Hx of lower extremity bypass, n (%) | 11 (2.4%) | 34 (4.0%) | 11 (2.4%) | 12 (3.8%) | 11 (3.4%) | 4 (9.1%) | 2 (20.0%) | 0.220 |
| Hx of PVI to the lower extremity, n (%) | 53 (11.5%) | 223 (26.3%) | 74 (32.2%) | 56 (17.9%) | 78 (24.3%) | 11 (25%) | 2 (20.0%) | < 0.0001 |
| ALI, n (%) | 14 (3.0%) | 28 (3.4%) | 10 (4.3%) | 8 (2.5%) | 19 (5.9%) | 4 (9.1%) | 1 (10.0%) | < 0.0001 |
| Claudication, n (%) | 397 (86.1%) | 675 (79.6%) | 15 (6.6%) | 240 (76.4%) | 61 (19.0%) | 7 (15.9%) | 0 (0%) | |
| CLI, n (%) | 50 (10.9%) | 144 (17.0%) | 205 (89.1%) | 66 (21.1%) | 240 (74.8%) | 33 (75.0%) | 9 (90.0%) | |
| ACEI/ARB, n (%) | 262 (56.8%) | 519 (61.1%) | 78 (33.9%) | 175 (55.7%) | 130 (40.5%) | 21 (47.7%) | 3 (30.0%) | < 0.0001 |
| Aspirin, n (%) | 338 (73.7%) | 592 (69.6%) | 146 (63.5%) | 216 (68.8%) | 211 (65.7%) | 32 (72.7%) | 5 (50.0%) | 0.12 |
| Thienopyridine, n (%) | 346 (75.1%) | 574 (67.5%) | 125 (54.3%) | 225 (71.7%) | 199 (62.0%) | 30 (68.2%) | 7 (70.0%) | < 0.0001 |
| Cilostazol, n (%) | 139 (30.2%) | 360 (42.4%) | 81 (35.2%) | 139 (44.3%) | 120 (37.4%) | 16 (36.4%) | 4 (40.0%) | 0.0004 |
| Statin, n (%) | 271 (58.8%) | 484 (56.9%) | 79 (34.3%) | 165 (52.5%) | 113 (35.2%) | 17 (38.6%) | 1 (10.0%) | < 0.0001 |
Values are presented as mean ± standard deviation or as number (%).
ABI, ankle–brachial index; ACEI/ARB, angiotensin-converting enzyme inhibitor/angiotensin II receptor blocker; AF, atrial fibrillation; AI, aortoiliac; ALI, acute limb ischemia; AS, aortic stenosis; BMI, body mass index; BTK, below the knee; CAD, coronary artery disease; CLI, critical limb ischemia; CVD, cerebrovascular disease; DBP, diastolic blood pressure; DL, dyslipidemia; DM, diabetes mellitus; EVT, endovascular therapy; FP, femoropopliteal; HR, heart rate; HTN, hypertension; Hx, history; LVEF, left ventricular ejection fraction; SBP, systolic blood pressure; SD, standard deviation.
Outcomes
Fig. 2 and Table 2 show the KM curves and Cox multivariate analysis for patients who received EVT at each combination of target locations (AI, FP, BTK, AI + FP, FP + BTK, AI + FP + BTK). Moreover, we analyzed and compared the hazard ratios for all combination patterns of treatment locations (Supplementary Fig. 1). Raw KM curves for OS and MALEs are shown in Fig. 2a and 2b, whereas KM curves after adjustment for each clinical factor (adjusted KM curves) are presented in Fig. 2c and 2d. KM curves showed that both OS and MALEs were significantly worse in patients receiving treatment that involved the BTK area than in those who only received treatment without involvement of BTK areas (Fig. 2a and 2b). Adjusted KM curves represent the essential prognostic impact of PAD at each location. For instance, although the isolated BTK treatment group had poorer prognosis than the isolated AI as well as isolated FP groups (Fig. 2a), the essential prognostic impact of PAD in the isolated BTK area itself is equal to that in the isolated AI as well as isolated FP areas (Fig. 2c). MALEs continuously occurred during the follow-up period after EVT in the isolated FP area, whereas the KM curves for treatment involving both the AI and BTK areas reached a plateau after 1–1.5 years passed. Supplementary Table 1–3 show the Cox multivariate analysis for PAD in the isolated AI, AI + FP, and AI + FP + BTK areas; isolated FP, AI + FP, FP + BTK, and AI + FP + BTK areas; and isolated BTK, FP + BTK, and AI + FP + BTK areas, respectively. These Cox multivariate analysis for each classified group showed that both benign and adverse prognostic factors were different according to each PAD location. With respect to OS, critical limb ischemia, left ventricular ejection fraction < 50%, and dialysis were common negative risk factors among all PAD locations. Major negative risk factors associated with MALEs were dialysis and critical limb ischemia. However, several differences in prognostic factors were also observed among treatment groups classified according to target locations (Supplementary Table 1–3). Table 3 presents the event rates per 100 person-years for OS and MALEs according to procedures performed at each treatment location. Treatment in the FP and BTK areas resulted in 20–30% and > 50% MALEs/year, respectively. Finally, Table 4 shows the details of death events and MALE according to the target area in EVT. There was no significant differences in the causes of events among six groups.
Fig. 2.
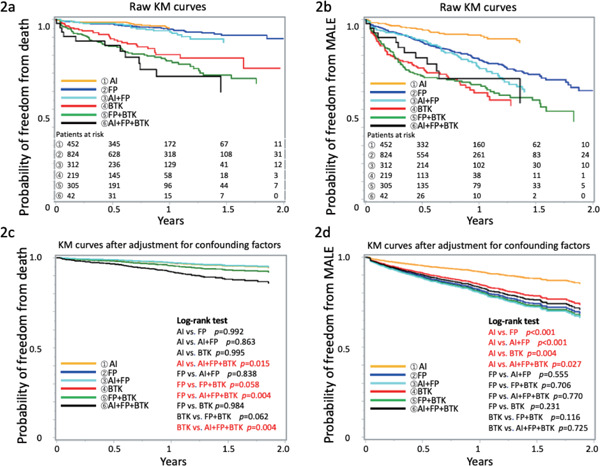
Raw and adjusted KM curves for patients
a, b: Raw KM curves for OS and MALEs in patients. c, d: KM curves after adjustment for each underlying clinical factor. AI, aortoiliac; BTK, below the knee; FP, femoropopliteal; MALEs, major adverse limb events; OS, overall survival.
Table 2. Multivariate Cox analysis for OS and MALEs.
| Risk factors for OS | HR (95% CI) | p-value | Risk factors for MALEs | HR (95% CI) | p-value | |
|---|---|---|---|---|---|---|
| Age in 10-year increments | 1.65 (1.31–2.07) | < 0.0001 | Age in 10-year increments | 1.03 (0.91–1.17) | 0.643 | |
| BMI < 18 | 1.79 (0.96–3.34) | 0.068 | BMI < 18 | 1.54 (1.01–2.35) | 0.048 | |
| DM | 1.56 (0.97–2.49) | 0.066 | DM | 1.00 (0.77–1.30) | 0.999 | |
| Dialysis | 3.39 (2.06–5.60) | < 0.0001 | Dialysis | 1.46 (1.09–1.97) | 0.012 | |
| CVD | 2.26 (1.34–3.66) | 0.001 | CVD | 1.17 (0.83–1.64) | 0.379 | |
| LVEF < 50% | 2.19 (1.29–3.72) | 0.004 | LVEF < 50% | 1.13 (0.78–1.66 | 0.515 | |
| ALI (vs. Claudication) | 1.83 (0.59–5.70) | 0.265 | ALI (vs. Claudication) | 1.63 (0.80–3.31) | 0.178 | |
| CLI (vs. Claudication) | 2.50 (1.42–4.42) | 0.002 | CLI (vs. Claudication) | 2.76 (2.02–3.78) | < 0.0001 | |
| ACEI/ARB | 0.67 (0.43–1.05) | 0.082 | ACEI/ARB | 0.79 (0.61–1.02) | 0.070 | |
| Aspirin | 0.65 (0.39–1.07) | 0.089 | Aspirin | 0.79 (0.59–1.06) | 0.116 | |
| Thienopyridine | 0.51 (0.32–0.80) | 0.004 | Thienopyridine | 0.96 (0.72–1.28) | 0.782 | |
| Cilostazol | 0.47 (0.28–0.78) | 0.003 | Cilostazol | 0.82 (0.61–1.09) | 0.173 | |
| Statin | 0.79 (0.50–1.23) | 0.294 | Statin | 1.09 (0.84–1.41) | 0.518 | |
| FP (vs. AI) | 1.00 (0.55–1.79) | 0.992 | FP (vs. AI) | 2.36 (1.65–3.39) | < 0.0001 | |
| BTK (vs. AI) | 1.00 (0.52–1.94) | 0.995 | BTK (vs. AI) | 1.93 (1.23–3.02) | 0.004 | |
| AI + FP (vs. AI) | 0.94 (0.47–1.88) | 0.863 | AI + FP (vs. AI) | 2.57 (1.72–3.84) | < 0.0001 | |
| FP + BTK (vs. AI) | 1.51 (0.82–2.78) | 0.891 | FP + BTK (vs. AI) | 2.49 (1.65–3.77) | < 0.0001 | |
| AI + FP + BTK (vs. AI) | 2.71 (1.21–6.05) | 0.015 | AI + FP + BTK (vs. AI) | 2.16 (1.09–4.25) | 0.027 |
ACEI/ARB, angiotensin-converting enzyme inhibitor/angiotensin II receptor blocker; AI, aortoiliac; ALI, acute limb ischemia; BMI, body mass index; BTK, below the knee; CI, confidence interval; CLI, critical limb ischemia; CVD, cerebrovascular disease; DM, diabetes mellitus; FP, femoropopliteal; HR, hazard ratio; LVEF, left ventricular ejection fraction; MALEs, major adverse limb events; OS, overall survival.
Supplementary Fig. 1.
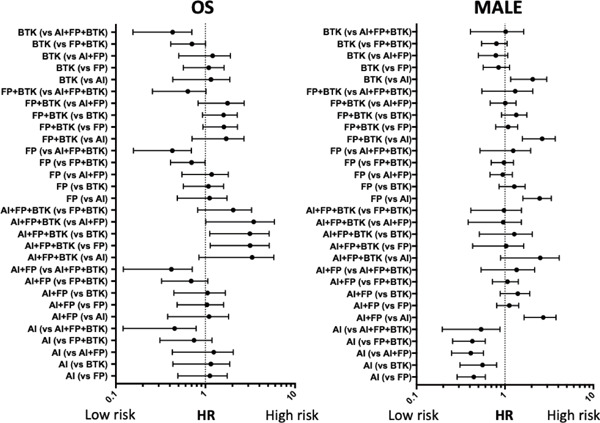
HR comparison of all combination patterns of treatment locations
AI, aortoiliac; BTK, below the knee; FP, femoropopliteal; HR, hazard ratio; MALE, major adverse limb events; OS, overall survival.
Supplementary Table 1. Multivariate Cox analysis for OS and MALEs in patients who received PVI in the AI, AI + FP, and AI + FP + BTK areas.
| Risk factors for OS | HR (95% CI) | p-value | Risk factors for MALEs | HR (95% CI) | p-value | |
|---|---|---|---|---|---|---|
| Age in 10-year increments | 1.26 (0.86–1.83) | 0.234 | Age in 10-year increments | 0.88 (0.71–1.09) | 0.235 | |
| BMI < 18 | 1.55 (0.67–3.57) | 0.303 | BMI < 18 | 2.09 (1.25–3.47) | 0.005 | |
| DM | 0.88 (0.46–1.66) | 0.686 | DM | 1.18 (0.8–1.73) | 0.407 | |
| Dialysis | 2.95 (1.53–5.71) | 0.001 | Dialysis | 1.72 (1.12–2.64) | 0.013 | |
| CVD | 0.95 (0.42–2.12) | 0.894 | CVD | 1.29 (0.80–2.10) | 0.299 | |
| LVEF < 50% | 3.56 (1.71–7.38) | 0.001 | LVEF < 50% | 1.19 (0.65–2.19) | 0.569 | |
| ALI | 3.52 (0.77–6.07) | 0.105 | ALI | 2.35 (0.84–6.55) | 0.102 | |
| CLI | 4.71 (2.26–9.83) | < 0.0001 | CLI | 2.25 (1.46–3.47) | 0.0002 | |
| ACEI/ARB | 0.48 (0.25–0.94) | 0.031 | ACEI/ARB | 1.03 (0.71–1.49) | 0.876 | |
| Aspirin | 0.48 (0.25–0.92) | 0.026 | Aspirin | 0.83 (0.54–1.29) | 0.410 | |
| Thienopyridine | 0.66 (0.34–1.30) | 0.232 | Thienopyridine | 0.95 (0.61–1.50) | 0.835 | |
| Cilostazol | 0.62 (0.32–1.20) | 0.153 | Cilostazol | 0.59 (0.38–0.93) | 0.022 | |
| Statin | 1.12 (0.59–2.12) | 0.731 | Statin | 0.71 (0.49–1.02) | 0.065 | |
| AI + FP (vs. AI) | 1.07 (0.52–2.23) | 0.856 | AI + FP (vs. AI) | 2.53 (1.66–3.85) | < 0.0001 | |
| AI + FP + BTK (vs. AI) | 2.99 (1.20–7.42) | 0.018 | AI + FP + BTK (vs. AI) | 1.85 (0.89–3.86) | 0.100 |
ACEI/ARB, angiotensin-converting enzyme inhibitor/angiotensin II receptor blocker; AI, aortoiliac; ALI, acute limb ischemia; BMI, body mass index; BTK, below the knee; CI, confidence interval; CLI, critical limb ischemia; CVD, cerebrovascular disease; DM, diabetes mellitus; FP, femoropopliteal; HR, hazard ratio; LVEF, left ventricular ejection fraction; MALEs, major adverse limb events; OS, overall survival; PVI, percutaneous vascular intervention.
Supplementary Table 2. Multivariate Cox analysis for OS and MALEs in patients who received PVI in the FP, AI + FP, FP + BTK, and AI + FP + BTK areas.
| Risk factors for OS | HR (95% CI) | p-value | Risk factors for MALEs | HR (95% CI) | p-value | |
|---|---|---|---|---|---|---|
| Age in 10-year increments | 1.58 (1.28–1.94) | < 0.0001 | Age in 10-year increments | 1.01 (0.9–1.12) | 0.925 | |
| BMI < 18 | 1.67 (1.06–2.65) | 0.028 | BMI < 18 | 1.30 (0.93–1.82) | 0.123 | |
| DM | 1.67 (1.11–2.52) | 0.014 | DM | 1.04 (0.83–1.31) | 0.731 | |
| Dialysis | 2.59 (1.76–3.82) | < 0.0001 | Dialysis | 1.56 (1.22–1.99) | 0.0004 | |
| CVD | 1.42 (0.94–2.17) | 0.10 | CVD | 1.08 (0.81–1.43) | 0.620 | |
| LVEF < 50% | 3.18 (2.11–4.81) | < 0.0001 | LVEF < 50% | 1.26 (0.91–1.76) | 0.167 | |
| ALI | 3.48 (1.49–8.14) | 0.004 | ALI | 1.72 (0.96–3.07) | 0.068 | |
| CLI | 3.08 (1.90–5.00) | < 0.0001 | CLI | 2.04 (1.56–2.66) | < 0.0001 | |
| ACEI/ARB | 0.75 (0.52–1.08) | 0.123 | ACEI/ARB | 0.73 (0.59–0.91) | 0.005 | |
| Aspirin | 0.65 (0.44–0.97) | 0.034 | Aspirin | 0.81 (0.63–1.05) | 0.110 | |
| Thienopyridine | 0.80 (0.54–1.18) | 0.250 | Thienopyridine | 0.98 (0.76–1.26) | 0.850 | |
| Cilostazol | 0.78 (0.52–1.17) | 0.230 | Cilostazol | 0.85 (0.66–1.09) | 0.197 | |
| Statin | 0.90 (0.62–1.31) | 0.590 | Statin | 1.04 (0.83–1.30) | 0.726 | |
| AI + FP (vs. FP) | 0.95 (0.55–1.66) | 0.856 | AI + FP (vs. FP) | 1.09 (0.82–1.45) | 0.543 | |
| FP + BTK (vs. FP) | 1.55 (1.00–2.39) | 0.049 | FP + BTK (vs. FP) | 1.12 (0.84–1.49) | 0.442 | |
| AI + FP + BTK (vs. FP) | 2.81 (1.41–5.58) | 0.003 | AI + FP + BTK (vs. FP) | 1.00 (0.54–1.85) | 0.997 |
ACEI/ARB, angiotensin-converting enzyme inhibitor/angiotensin II receptor blocker; AI, aortoiliac; ALI, acute limb ischemia; BMI, body mass index; BTK, below the knee; CI, confidence interval; CLI, critical limb ischemia; CVD, cerebrovascular disease; DM, diabetes mellitus; FP, femoropopliteal; HR, hazard ratio; LVEF, left ventricular ejection fraction; MALEs, major adverse limb events; OS, overall survival; PVI, percutaneous vascular intervention.
Supplementary Table 3. Multivariate Cox analysis for OS and MALEs in patients who received PVI in the BTK, FP + BTK, and AI + FP + BTK areas.
| Risk factors for OS | HR (95% CI) | p-value | Risk factors for MALEs | HR (95% CI) | p-value | |
|---|---|---|---|---|---|---|
| Age in 10-year increments | 1.61 (1.28–2.02) | < 0.0001 | Age in 10-year increments | 1.02 (0.88–1.19) | 0.812 | |
| BMI < 18 | 1.71 (1.07–2.75) | 0.026 | BMI < 18 | 1.17 (0.75–1.81) | 0.490 | |
| DM | 1.46 (0.93–2.29) | 0.103 | DM | 0.93 (0.66–1.31) | 0.665 | |
| Dialysis | 2.06 (1.31–3.22) | 0.002 | Dialysis | 1.65 (1.18–2.30) | 0.004 | |
| CVD | 1.82 (1.13–2.91) | 0.013 | CVD | 0.77 (0.5–1.20) | 0.252 | |
| LVEF < 50% | 2.70 (1.69–4.32) | < 0.0001 | LVEF < 50% | 1.15 (0.75–1.77) | 0.533 | |
| ALI | 3.90 (1.23–12.36) | 0.021 | ALI | 1.07 (0.40–2.84) | 0.898 | |
| CLI | 2.35 (1.00–5.51) | 0.051 | CLI | 1.80 (1.08–2.98) | 0.023 | |
| ACEI/ARB | 0.45 (0.28–0.71) | 0.001 | ACEI/ARB | 0.89 (0.64–1.22) | 0.454 | |
| Aspirin | 0.68 (0.44–1.07) | 0.094 | Aspirin | 0.76 (0.54–1.09) | 0.14 | |
| Thienopyridine | 0.93 (0.60–1.46) | 0.760 | Thienopyridine | 0.95 (0.67–1.34) | 0.748 | |
| Cilostazol | 0.75 (0.48–1.20) | 0.230 | Cilostazol | 0.68 (0.47–0.99) | 0.042 | |
| Statin | 0.93 (0.59–1.46) | 0.760 | Statin | 1.30 (0.94–1.79) | 0.114 | |
| FP + BTK (vs. BTK) | 1.45 (0.94–2.25) | 0.093 | FP + BTK (vs. BTK) | 1.31 (0.94–1.82) | 0.112 | |
| AI + FP + BTK (vs. BTK) | 2.49 (1.24–5.01) | 0.010 | AI + FP + BTK (vs. BTK) | 1.20 (0.63–2.28) | 0.584 |
ACEI/ARB, angiotensin-converting enzyme inhibitor/angiotensin II receptor blocker; AI, aortoiliac; ALI, acute limb ischemia; BMI, body mass index; BTK, below the knee; CI, confidence interval; CLI, critical limb ischemia; CVD, cerebrovascular disease; DM, diabetes mellitus; FP, femoropopliteal; HR, hazard ratio; LVEF, left ventricular ejection fraction; MALEs, major adverse limb events; OS, overall survival; PVI, percutaneous vascular intervention.
Table 3. Event rates per 100 person-years of all-cause death and MALEs according to the target area in EVT.
| Number of pts | All-cause death |
MALEs |
|||
|---|---|---|---|---|---|
| Events | n/100 pts-year | Events | n/100 pts-year | ||
| AI | 461 | 16 | 4 | 37 | 9.6 |
| FP | 850 | 44 | 6 | 167 | 25.8 |
| BTK | 230 | 34 | 21.4 | 70 | 57.6 |
| AI + FP | 314 | 21 | 7.5 | 74 | 29.9 |
| FP + BTK | 321 | 65 | 27.3 | 104 | 55.2 |
| AI + FP + BTK | 44 | 12 | 34 | 12 | 44.4 |
AI, aortoiliac; BTK, below the knee; FP, femoropopliteal; MALEs, major adverse limb events; pts, patients; EVT, endovascular therapy.
Table 4. The details of Death events and MALE according to the target area in EVT.
| Death | Cardiac death | Non-cardiovascular death | p-value |
|---|---|---|---|
| AI | 3 | 13 | 0.952 |
| FP | 15 | 29 | |
| BTK | 9 | 25 | |
| AI + FP | 8 | 13 | |
| FP + BTK | 18 | 47 | |
| AI + FP + BTK | 2 | 10 |
| MALE | Unscheduled major amptation | Unscheduled major lower limb surgery | Unscheduled endovascular treatment | Acute limb ischemia | p-value |
|---|---|---|---|---|---|
| AI | 6 | 9 | 22 | 2 | 0.080 |
| FP | 18 | 13 | 138 | 6 | |
| BTK | 17 | 3 | 50 | 2 | |
| AI + FP | 2 | 2 | 64 | 4 | |
| FP + BTK | 18 | 6 | 78 | 2 | |
| AI + FP + BTK | 1 | 0 | 11 | 1 |
AI, aortoiliac; BTK, below the knee; FP, femoropopliteal; MALEs, major adverse limb events; pts, patients; EVT, endovascular therapy.
Discussion
Several previous studies have indicated an unfavorable prognosis for PAD in Japan and Western countries10–12). Many registries for studying the etiology and prognosis of PAD were previously reported; nonetheless, all of these have narrowed their study population by limiting the indications and target locations in the lower limbs. In contrast, we provided the first multicenter prospective cohort registry that included all interventions irrespective of target locations and indications (e.g., not only patients with claudication or critical limb ischemia but also those with acute limb ischemia event were included). Thus, this registry revealed real-world data on EVT for PAD in current clinical practice.
Fig. 3 illustrates the association between risk factors and the level of each PAD location (isolated AI, FP, or BTK) based on the results presented in Table 1. The results of our study, which enrolled patients receiving EVT, are basically consistent with those of a previous study13) in that the clinical phenotype of peripheral atherosclerosis varies with the prevalence of cardiovascular risk factors such as gender, DM, dyslipidemia, and smoking. In addition, we further investigated considerably more types of comorbidities in the present study. Compared with patients who received EVT at the isolated AI or FP level, patients who received EVT at the BTK level tended to have severe comorbidities (e.g., severe DM, end-stage renal disease requiring dialysis, heart failure) and other vascular diseases (e.g., coronary artery disease, cerebrovascular disease). Therefore, they are thought to be at the end stage of atherosclerotic diseases. Likewise, comorbidity of atrial fibrillation, which is one of the diseases related to atherosclerosis, was largely more prevalent in patients with BTK lesion than in those with AI or FP lesion. This result is in agreement with the finding of a previous study that reported a much higher prevalence of atrial fibrillation in PAD patients with severe disease status14). Uniquely, patients with FP lesion were predominantly females and tended to have hypertension compared with other patients, suggesting the pathogenesis of PAD at the FP level might be different from that of PAD at other levels.
Fig. 3.
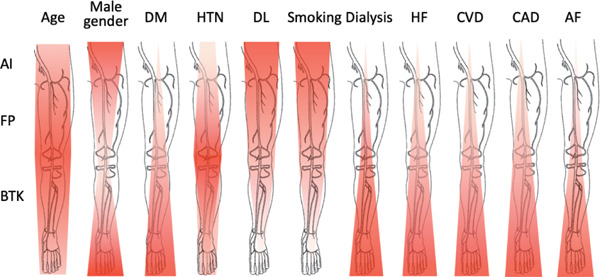
Association between risk factors and each level of atherosclerotic target lesions
Red overlay on the anatomic cartoon illustrates the incidence of each type of risk factors associated with the pattern of atherosclerotic lesions. The darker red color denotes the location in which comorbidities were mostly observed in the study population. AF, atrial fibrillation; AI, aortoiliac; BTK, below the knee; CAD, coronary artery disease; CVD, cerebrovascular disease; DL, dyslipidemia; DM, diabetes mellitus; FP, femoropopliteal; HF, heart failure; HTN, hypertension.
Based on clinical experience, it could be comprehensible that patients with PAD in the BTK area have poor prognosis. In our registry, as shown in Fig. 2a, patients with isolated lesion in the BTK area and multiple lesions involving the BTK area had poor prognosis, as compared with those with lesions limited to other areas. However, only severe PAD with lesions distributed over all areas (AI + FP + BTK) showed a significant survival risk after adjustment for other confounding factors (Fig. 2c). This result is inconsistent with the finding of a previous retrospective cohort study, which showed that distal disease location was associated with worse survival after adjustment for potential confounders15). Our data suggest that OS was largely defined by patient background (including underlying diseases, comorbidities, and dialysis), but not by lesion location alone. Although we did not investigate lower limb muscle strength and activities of daily living, patients with multiple and widespread PAD lesions from the AI area to the BTK area are considered to have considerably impaired muscle strength and activities of daily living, which may adversely affect the patient's prognosis16, 17).
With respect to MALEs, the prognosis of treatment for the FP area was surprisingly even worse than that for the BTK area after adjustment for each underlying clinical factor. As the mortality rate was relatively high in patients with lesions involving the BTK area, some patients had probably died prior to experiencing adverse limb events. However, further investigations are required to elucidate this contradictory prognosis between FP and BTK lesions. MALE as an outcome in patients receiving EVT for the FP area was reported in 2010 6), which is similar to our data. This indicates that the outcome of EVT for the FP area has not sufficiently improved despite technical advances in recent years.
Notably, other prognostic factors such as type of drug usage were different according to PAD location, suggesting that there might be different pathogenesis for each type of disease location. Aspirin use was an independent benign prognostic factor in patients who received EVT in the AI and FP areas. However, no significant effect of aspirin use on OS was observed in patients with BTK lesion. We assume that this is because the disease severity of PAD and other underlying comorbidities are much more serious in patients with vascular stenosis in the BTK area; thus, aspirin use is no longer effective. With respect to cilostazol use, our result was consistent with that of previous reports that described the benefit of cilostazol for reducing MALEs18, 19). Angiotensin-converting enzyme inhibitor/angiotensin II receptor blocker use was an independent benign prognostic factor in patients who received EVT in the AI and BTK areas. This result is consistent with that of previous studies that reported angiotensin-converting enzyme inhibitor/angiotensin II receptor blocker use to be beneficial for patients at high risk for cardiovascular events20, 21).
Interestingly, the beneficial effect of angiotensin-converting enzyme inhibitor/angiotensin II receptor blocker use on OS could not reach statistical significance in patients with FP lesion; however, angiotensin-converting enzyme inhibitor/angiotensin II receptor blocker use showed significantly benign effect on MALEs in those with FP lesion. Although we cannot find reasonable explanation for this result at this point, the background pathogenesis of FP lesion might be considerably different from that of AI or BTK lesions. As for statin, previous reports from the sub-analysis of a large cohort registry showed that statin use was associated with a 20–25% risk reduction in major adverse cardiovascular events and ∼18% risk reduction in adverse limb outcomes (including worsening symptoms, peripheral revascularization, and ischemic amputations)22, 23). However, in our study, statin use could not reach statistical significance for better OS and MALE outcomes. All patients enrolled in our study received EVT for PAD; conversely, previous studies to study the impact of statin use for PAD22, 23) enrolled only patients diagnosed with symptomatic PAD. Taking this into account, statin use is probably beneficial only for patients in the relatively early stage of PAD. This postulation can be supported by our present findings in which the beneficial effect on MALEs showed marginal significance in patients who received EVT for AI lesion (which was thought to be relatively mild with respect to disease severity) (Supplementary Table 1).
In our study, the event rate of all-cause death adjusted for potential confounding factors was high only in the case of disease location involving the BTK area. However, only disease location limited to the AI lesion showed a low rate of MALEs. Even procedures involving the FP and AI + FP lesions had a high event rate of 25.8 and 29.9 per 100 person-years, respectively. Despite advances in EVT for PAD, our data indicate that patency after EVT is permissible only in the treatment for AI lesion.
Study Limitations
Our registry included a large number of participants with PAD from several institutions and provided the latest real-world evidence; nevertheless, the present study has several limitations. First, our study only included Japanese patients; thus, whether its results can be directly applied to patients of other ethnicities remains unclear. Second, although all patients enrolled in our registry were considered for the indication of EVT according to the latest American Heart Association/American College of Cardiology guidelines7), there might be some differences in treatment indication among hospitals. Finally, the follow-up period of our registry was relatively short. Therefore, we will perform long-term follow-up of this study population.
Conclusions
The present study showed real-world evidence on percutaneous intervention for lower extremity PAD according to disease locations including multiple lesions. The background risk factors, underlying comorbidities, and event rates were different according to PAD location, suggesting that stratified treatment should be established for different patient populations. Despite various advances in medication and interventional technology for PAD in recent years, the outcomes remain unsatisfactory. Further innovation of treatment techniques and improvement in treatment strategy are warranted.
Acknowledgements
The authors thank the Office of Administrative and Accounting Support for Clinical Research of Sakakibara Heart Institute, especially Mrs. Yoshiko Shimomura. The Toma-Code Registry would have been unsuccessful without her assistance.
Disclosures
This work was supported by the Vascular Disease Research Project of the Japan Research Promotion Society for Cardiovascular Diseases. All authors have no relationship with the industry and other relevant entities to disclose.
References
- 1). Fowkes FG, Rudan D, Rudan I, Aboyans V, Denenberg JO, McDermott MM, Norman PE, Sampson UK, Williams LJ, Mensah GA, Criqui MH. Comparison of global estimates of prevalence and risk factors for peripheral artery disease in 2000 and 2010: a systematic review and analysis. Lancet, 2013; 382: 1329-1340 [DOI] [PubMed] [Google Scholar]
- 2). Criqui MH, Aboyans V. Epidemiology of peripheral artery disease. Circ Res, 2015; 116: 1509-1526 [DOI] [PubMed] [Google Scholar]
- 3). Hess CN, Norgren L, Ansel GM, Capell WH, Fletcher JP, Fowkes FGR, Gottsäter A, Hitos K, Jaff MR, Nordanstig J, Hiatt WR. A structured review of antithrombotic therapy in peripheral artery disease with a focus on revascularization: a TASC (InterSociety Consensus for the Management of Peripheral Artery Disease) initiative. Circulation, 2017; 135: 2534-2555 [DOI] [PubMed] [Google Scholar]
- 4). Tsujimura T, Iida O, Fujita M, Masuda M, Okamoto S, Ishihara T, Nanto K, Kanda T, Okuno S, Matsuda Y, Fujihara M, Yokoi Y, Mano T. Two-year Clinical Outcomes Post Implantation of EpicTM Self-Expanding Nitinol Stents for the Aortoiliac Occlusive Disease in Patients with Peripheral Arterial Disease. J Atheroscler Thromb, 2018; 25: 344-349 [DOI] [PMC free article] [PubMed] [Google Scholar]
- 5). Giles KA, Pomposelli FB, Spence TL, Hamdan AD, Blattman SB, Panossian H, Schermerhorn ML. Infrapopliteal angioplasty for critical limb ischemia: relation of TransAtlantic InterSociety Consensus class to outcome in 176 limbs. J Vasc Surg, 2008; 48: 128-136 [DOI] [PubMed] [Google Scholar]
- 6). Soga Y, Iida O, Hirano K, Yokoi H, Nanto S, Nobuyoshi M. Mid-term clinical outcome and predictors of vessel patency after femoropopliteal stenting with self-expandable nitinol stent. J Vasc Surg, 2010; 52: 608-615 [DOI] [PubMed] [Google Scholar]
- 7). Gerhard-Herman MD, Gornik HL, Barrett C, Barshes NR, Corriere MA, Drachman DE, Fleisher LA, Fowkes FG, Hamburg NM, Kinlay S, Lookstein R, Misra S, Mureebe L, Olin JW, Patel RA, Regensteiner JG, Schanzer A, Shishehbor MH, Stewart KJ, Treat-Jacobson D, Walsh ME. 2016 AHA/ACC guideline on the management of patients with lower extremity peripheral artery disease: executive summary: a report of the American College of Cardiology/American Heart Association Task Force on Clinical Practice Guidelines. Circulation, 2017; 135: e686-e725 [DOI] [PMC free article] [PubMed] [Google Scholar]
- 8). Higashitani M, Uemura Y, Mizuno A, Utsunomiya M, Yamaguchi T, Matsui A, Ozaki S, Tobita K, Tosaka A, Oida A, Suzuki K, Kodama T, Jujo K, Doijiri T, Takahashi Y, Matsuno S, Kaneko N, Moriguchi A, Kishi S, Anzai H, Toma-Code Registry Investigators Cardiovascular outcome and mortality in patients undergoing endovascular treatment for symptomatic peripheral artery disease - short-term results of the Toma-Code registry. Circ J, 2018; 82: 1917-1925 [DOI] [PubMed] [Google Scholar]
- 9). Creager MA, Kaufman JA, Conte MS. Clinical practice. Acute limb ischemia. N Engl J Med, 2012; 366: 2198-2206 [DOI] [PubMed] [Google Scholar]
- 10). Reinecke H, Unrath M, Freisinger E, Bunzemeier H, Meyborg M, Lüders F, Gebauer K, Roeder N, Berger K, Malyar NM. Peripheral arterial disease and critical limb ischaemia: still poor outcomes and lack of guideline adherence. Eur Heart J, 2015; 36: 932-938 [DOI] [PubMed] [Google Scholar]
- 11). Diehm C, Allenberg JR, Pittrow D, Mahn M, Tepohl G, Haberl RL, Darius H, Burghaus I, Trampisch HJ, German Epidemiological Trial on Ankle Brachial Index Study Group Mortality and vascular morbidity in older adults with asymptomatic versus symptomatic peripheral artery disease. Circulation, 2009; 120: 2053-2061 [DOI] [PubMed] [Google Scholar]
- 12). Kumakura H, Kanai H, Aizaki M, Mitsui K, Araki Y, Kasama S, Iwasaki T, Ichikawa S. The influence of the obesity paradox and chronic kidney disease on long-term survival in a Japanese cohort with peripheral arterial disease. J Vasc Surg, 2010; 52: 110-117 [DOI] [PubMed] [Google Scholar]
- 13). Diehm N, Shang A, Silvestro A, Do DD, Dick F, Schmidli J, Mahler F, Baumgartner I. Association of cardiovascular risk factors with pattern of lower limb atherosclerosis in 2659 patients undergoing angioplasty. Eur J Vasc Endovasc Surg, 2006; 31: 59-63 [DOI] [PubMed] [Google Scholar]
- 14). Conway DS, Lip GY. Comparison of outcomes of patients with symptomatic peripheral artery disease with and without atrial fibrillation (the West Birmingham Atrial Fibrillation Project). Am J Cardiol, 2004; 93: 1422-1425 [DOI] [PubMed] [Google Scholar]
- 15). Chen Q, Smith CY, Bailey KR, Wennberg PW, Kullo IJ. Disease location is associated with survival in patients with peripheral arterial disease. J Am Heart Assoc, 2013; 2: e000304. [DOI] [PMC free article] [PubMed] [Google Scholar]
- 16). Addison O, Prior SJ, Kundi R, Serra MC, Katzel LI, Gardner AW, Ryan AS. Sarcopenia in peripheral arterial disease: prevalence and effect on functional status. Arch Phys Med Rehabil, 2018; 99: 623-628 [DOI] [PMC free article] [PubMed] [Google Scholar]
- 17). Sugai T, Watanabe T, Otaki Y, Goto J, Watanabe K, Toshima T, Takahashi T, Yokoyama M, Tamura H, Nishiyama S, Arimoto T, Takahashi H, Shishido T, Watanabe M. Decreased psoas muscle computed tomography value predicts poor outcome in peripheral artery disease. Circ J, 2018; 82: 3069-3075 [DOI] [PubMed] [Google Scholar]
- 18). Soga Y, Iida O, Hirano K, Suzuki K, Kawasaki D, Miyashita Y, Tsuchiya T, Nobuyoshi M. Impact of cilostazol after endovascular treatment for infrainguinal disease in patients with critical limb ischemia. J Vasc Surg, 2011; 54: 1659-1667 [DOI] [PubMed] [Google Scholar]
- 19). Soga Y, Yokoi H, Kawasaki T, Nakashima H, Tsurugida M, Hikichi Y, Nobuyoshi M. Efficacy of cilostazol after endovascular therapy for femoropopliteal artery disease in patients with intermittent claudication. J Am Coll Cardiol, 2009; 53: 48-53 [DOI] [PubMed] [Google Scholar]
- 20). Heart Outcomes Prevention Evaluation Study Investigators. Yusuf S, Sleight P, Pogue J, Bosch J, Davies R, Dagenais G. Effects of an angiotensin-converting-enzyme inhibitor, ramipril, on cardiovascular events in high-risk patients. N Engl J Med, 2000; 342: 145-153 [DOI] [PubMed] [Google Scholar]
- 21). ONTARGET Investigators. Yusuf S, Teo KK, Pogue J, Dyal L, Copland I, Schumacher H, Dagenais G, Sleight P, Anderson C. Telmisartan, ramipril, or both in patients at high risk for vascular events. N Engl J Med, 2008; 358: 1547-1559 [DOI] [PubMed] [Google Scholar]
- 22). Heart Protection Study Collaborative Group. Randomized trial of the effects of cholesterol-lowering with simvastatin on peripheral vascular and other major vascular outcomes in 20,536 people with peripheral arterial disease and other high-risk conditions. J Vasc Surg, 2007; 45: 645-654 [DOI] [PubMed] [Google Scholar]
- 23). Kumbhani DJ, Steg PG, Cannon CP, Eagle KA, Smith SC, Jr, Goto S, Ohman EM, Elbez Y, Sritara P, Baumgartner I, Banerjee S, Creager MA, Bhatt DL, REACH Registry Investigators Statin therapy and long-term adverse limb outcomes in patients with peripheral artery disease: insights from the REACH registry. Eur Heart J, 2014; 35: 2864-2872 [DOI] [PMC free article] [PubMed] [Google Scholar]