Abstract
Purpose
To illustrate the change in emergency department (ED) imaging utilization at a multicenter health system in the state of Ohio during the COVID-19 pandemic.
Methods
A retrospective observational study was conducted assessing ED imaging volumes between March 1, 2020, and May 11, 2020, during the COVID-19 crisis. A rolling 7-day total value was used for volume tracking and comparison. Total imaging utilization in the ED was compared with new COVID-19 cases in our region. Utilization was first categorized by modality and then by plain films and computed tomography (CT) scans grouped by body part. CT imaging of the chest was specifically investigated by assessing both CT chest only exams and CT chest, abdomen, and pelvis (C/A/P) exams. Ultimately, matching pair-wise statistical analysis of exam volumes was performed to assess significance of volume change.
Results
Our multicenter health system experienced a 46% drop in imaging utilization (p < 0.0001) during the pandemic. Matching pair-wise analysis showed a statistically significant volume decrease by each modality and body part. The exceptions were non-contrast chest CT, which increased (p = 0.0053), and non-trauma C/A/P CT, which did not show a statistically significant volume change (p = 0.0633).
Conclusion
ED imaging utilization trends revealed through actual health system data will help inform evidence-based decisions for more accurate volume predictions and therefore institutional preparedness for current and future pandemics.
Keywords: COVID-19, Imaging utilization, Multimodality
Introduction
The COVID-19 pandemic has resulted in a wide spectrum of impact on the medical community throughout the USA. Since the World Health Organization officially labeled COVID-19 a global pandemic on March 11, 2020, both US federal and state policies rapidly evolved to curtail the spread of the virus [1, 2]. Healthcare systems attempted to limit the number of patients they serve to decrease the risk of exposure by postponing non-essential imaging studies and procedures [2]. These restrictions, in combination with stay-at-home orders, resulted in a sharp and precipitous decline in demand for imaging services globally [3]. While demand for radiology services in both the outpatient and inpatient settings is more easily anticipated and managed accordingly, the emergency department (ED) setting is inherently unique in its general unpredictability. This unpredictability becomes even more apparent during a public health crisis such as COVID-19, when self-imposed restrictions are simultaneously met with preparations for patient surges [2, 3].
The purpose of this study is to illustrate our health system’s experience with imaging utilization in the ED setting during a 10-week period amidst the COVID-19 pandemic. Predictive models and anecdotal articles suggest ED imaging volumes have declined by around 50%; however, minimal actual data has been published to substantiate these figures [4–6]. By quantifying the imaging utilization change experienced at our multi-centered system, we hope similar organizations may be able to extrapolate the effect of the crisis on their own institutions. Organizations with different experiences should be encouraged to publicize their own data in an effort to illuminate a more accurate picture of how this crisis has changed our practices and how we can better prepare for the next pandemic.
Methods
Setting
This retrospective observational study was exempted by the Institutional Review Board and patient consent was waived. Our healthcare institution serves northeast Ohio including the Cleveland metropolitan area and its surrounding counties. It is an integrated system of over 150 sites, including 18 hospitals, 21 emergency rooms, 11 urgent care centers, and numerous physician offices across the region [7]. The central main campus hospital is the only Level 1 trauma center in the system. There are three Level 3 trauma centers and no Level 2 centers.
Our healthcare institution serves a total of nine counties containing a population of nearly 3 million people, which makes up about 25% of the population of Ohio [8]. In 2019, over 1.3 million imaging exams were performed over the entire health system; 27% of these exams were performed in the emergency setting [9].
COVID-19
The direct health effects of the virus compose the main crisis of the pandemic. At the time of this writing, the number of confirmed cases in the USA has surpassed 3.1 million and has led to over 133,000 deaths [10]. In Ohio, over 62,000 cases have been confirmed resulting in over 8700 hospitalizations, 2100 ICU admissions, and 3000 confirmed deaths. Compared with other states, Ohio has the 16th highest number of positive cases overall and the 13th highest number of COVID-related deaths. The nine counties served have seen over 14,700 of these cases (23% of the total cases in Ohio). Cuyahoga county, which houses the main campus hospital, makes up 57% of the population of this nine-county fingerprint and contains 60% of its COVID-19 cases [11].
At our institution, the general imaging policy for suspected COVID-19 patients is to start with chest radiographs for those of moderate acuity. If the patient is experiencing hypoxia not explained by chest radiograph, then a non-contrast chest CT or an angiographic CT for pulmonary embolism (PE) would be obtained depending on clinical suspicion for PE. Performing a chest CT is not routine for these patients.
The major events and policy decisions used to anchor the relative chronology of imaging utilization change include the following:
March 9, 2020, when Ohio was officially placed into a state of emergency after the first three positive cases of COVID-19 were confirmed.
March 11, 2020, when the World Health Organization officially labeled COVID-19 a global pandemic.
March 15, 2020, when restaurants and bars were ordered closed.
March 17, 2020, when elective and non-essential procedures were to be postponed in an effort to conserve personal protective equipment (PPE).
March 22, 2020, when the official stay-at-home order was implemented [2].
Imaging utilization
Data was obtained from a business intelligence and analytics platform that aggregates data primarily from the Radiology Information System (RIS) and Picture Archiving and Communication System (PACS) to construct performance statistics by analyzing all radiologist-generated reports (3M M*Modal Scout, Pittsburgh, PA, USA) [12]. The quantity of accession numbers created was used to estimate the total number of exams performed. The platform generated a list of all accession numbers associated with imaging exams completed in the ED setting between February 24, 2020, and May 11, 2020, throughout the system. This list of 50,234 accession numbers was exported into Microsoft Excel and sorted into exams completed per day. The data was further organized into an aggregated 7-day running total, which was used as a measure of weekly volume due to the large variance between the number of exams performed during weekdays versus during weekends. This value served as the main basis of volume tracking and comparison.
The system-wide ED exams within all modalities were then tracked and charted chronologically. A “normal” average weekly volume was derived using the 7-day aggregate from March 1, 2020, to March 9, 2020. This average weekly volume was consistent with that of early 2019 and early 2020; we therefore used it as the normal comparison. The ED exams were then categorized by imaging modality, which primarily included plain films, computed tomography (CT), magnetic resonance imaging (MRI), ultrasound, and nuclear medicine studies. Any exams that were not classified into these modalities were considered as “other.” Subsequently, plain films and CTs were broken down by body part. This was done manually by examining imaging study descriptions provided from the Current Procedural Terminology (CPT) codes. Chest imaging utilization was specifically expounded due to its high involvement in the COVID-19 disease process [13]. Finally, we approximated trauma imaging utilization by reviewing the CT chest, abdomen, and pelvis (C/A/P) exam indications. This was done manually by examining CPT code descriptions and utilizing PACS to distinguish indication. No clinical parameters or findings were scrutinized in this study.
Statistical analysis
Statistical analysis was performed to determine if there was a difference in the number of ED imaging exams performed before the state of emergency was declared in Ohio (March 9, 2020) and during the system-wide trough of utilization amidst the crisis. The percentage change in the sum total exams for a given modality before (March 1, 2020, to March 9, 2020) and during (April 11, 2020, to April 19, 2020) the utilization trough of the pandemic was calculated. Subsequently, statistical significance of the mean difference in the number of scans performed before and after was determined using paired t test (normal distribution) or Wilcoxon signed-rank test (non-normal distribution) for continuous variables. The normality of the distribution was verified using the Shapiro-Wilk test.
In the next step, modality-wise day-to-day comparison of number of exams was performed by selecting two specific time durations: one before the pandemic and one during the utilization trough. Matching pair-wise analysis was again performed for the number of scans for each modality subtype as listed in Table 1 using paired t test or Wilcoxon signed-rank test after verifying the normality of the distribution using the Shapiro-Wilk test. A two-tailed p value of < 0.05 was taken as statistically significant. All statistical analyses were conducted using JMP® Software (JMP® PRO, Version 14.0.0 SAS Institute Inc., Cary, NC, 1989–2007).
Table 1.
Matching pair-wise analysis results assessing statistical significance of change in ED imaging volumes are provided. “Normal volume” denotes the normalized mean system-wide ED imaging volume before the state of emergency was declared in Ohio on March 9, 2020. The proportions within each subsection are provided in parentheses. “Volume during COVID-19 pandemic” denotes the mean volume during the system-wide trough of imaging utilization amidst the crisis (April 11, 2020–April 19, 2020). The proportions within each subsection are again provided in parentheses. The calculated “Mean difference” between these two columns is provided along with the lower and upper limits of the 95% confidence interval. “% Change from normal” indicates the percentage by which the volume dropped during COVID-19 compared with normal
| Normal volume (%) | Volume during COVID-19 pandemic (%) | Mean difference ± SE | % Change from normal | 95% CI | p value | |
|---|---|---|---|---|---|---|
| Overall ED imaging | 6296 (100) | 3421 (100) | − 2875 ± 47 | − 46% | − 2983, − 2767 | < 0.0001* |
| Modality | ||||||
| Plain films | 3680 (58) | 1901 (56) | − 1779 ± 34 | − 48% | − 1858, − 1699 | < 0.0001* |
| CT | 2232 (35) | 1307 (38) | − 925 ± 14 | − 41% | − 958, − 892 | < 0.0001* |
| Ultrasound | 303 (5) | 181 (5) | − 122 ± 2 | − 40% | − 126, − 118 | < 0.0001* |
| MRI | 64 (1) | 30 (1) | − 34 ± 2 | − 53% | − 39, − 29 | < 0.0001* |
| Nuclear medicine | 12 (0) | 0 (0) | − 12 ± 1 | − 100% | − 14, − 11 | < 0.0001* |
| Plain films by body part | ||||||
| Chest | 2066 (56) | 1138 (60) | − 928 ± 25 | − 45% | − 986, − 871 | < 0.0001* |
| Spine and extremities | 1406 (38) | 677 (36) | − 729 ± 15 | − 52% | − 763, − 695 | < 0.0001* |
| Abdomen and/or pelvis | 177 (5) | 74 (4) | − 103 ± 3 | − 58% | − 110, − 97 | < 0.0001* |
| Head and/or neck | 19 (1) | 8 (0) | − 11 ± 1 | − 58% | − 12, − 9 | < 0.0001* |
| CT by body part | ||||||
| Head and/or neck | 862 (39) | 484 (37) | − 378 ± 11 | − 44% | − 402, − 353 | < 0.0001* |
| Abdomen and/or pelvis | 633 (28) | 363 (28) | − 270 ± 5 | − 43% | − 281, − 258 | < 0.0001* |
| Spine and extremities | 437 (20) | 248 (19) | − 189 ± 5 | − 43% | − 200, − 176 | < 0.0001* |
| Chest only | 253 (11) | 168 (13) | − 84 ± 6 | − 34% | − 98, − 71 | < 0.0001* |
| C/A/P | 47 (2) | 43 (3) | − 4 ± 2 | − 9% | − 9, 1 | 0.0857 |
| CT chest imaging | ||||||
| CT chest angio | 210 (77) | 125 (67) | − 85 ± 5 | − 40% | − 96, − 74 | < 0.0001* |
| CT chest IV | 16 (6) | 8 (4) | − 9 ± 1 | − 50% | − 12, − 5 | < 0.0002* |
| CT chest WO | 26 (10) | 35 (19) | 9 ± 2 | + 35% | 3, 14 | 0.0053* |
| CT C/A/P non-trauma | 8 (3) | 12 (6) | 4 ± 2 | + 50% | 0, 8 | 0.0633 |
| CT C/A/P trauma | 12 (4) | 7 (4) | − 5 ± 1 | − 42% | − 7, − 2 | 0.002* |
A negative sign indicates decrease in volume. An asterisk (*) indicates a statistically significant two-tailed p value < 0.05. SE, standard error; CI, confidence interval; Angio, angiography; IV, with intravenous contrast; WO, without intravenous contrast; C/A/P, chest, abdomen, and pelvis
Results
Overall ED imaging utilization
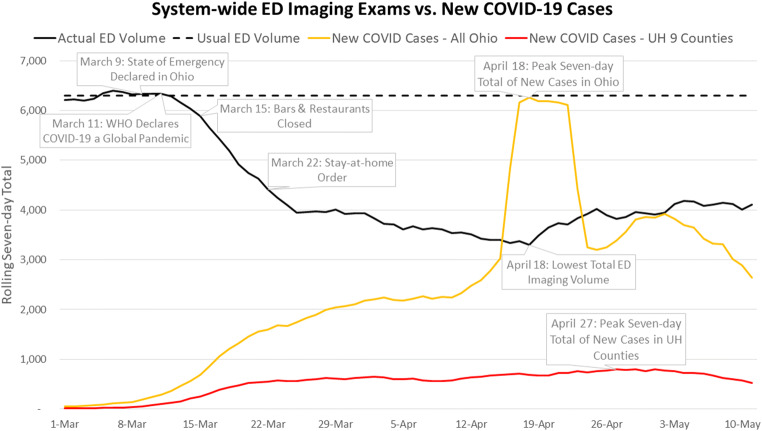
Figure 1 and Table 1 show that our usual system-wide ED volume is approximately 6296 imaging exams per week. This volume level was seen through early March and then quickly declined after a state of emergency was declared in Ohio on March 9, 2020. During this 10-week span of the COVID-19 crisis, a statistically significant decrease in volume was seen throughout the system specifically between April 11, 2020, and April 19, 2020. The mean overall imaging volume decreased by 46% (2875 exams) from its usual mark seen prior to the crisis (p < 0.0001). The superimposed graph of the new COVID-19 cases in Ohio actually shows a peak 7-day total of 6265 cases on April 18, 2020, the same day our system experienced its lowest 7-day total volume of 3298 exams [11]. However, when looking specifically at the number of new COVID-19 cases in only the nine counties the system serves, a more flattened curve is evident from mid-to-late March through early May. A relative peak number of new cases was observed on April 27, 2020.
Fig. 1.
The rolling 7-day total number of imaging exams performed in the emergency department setting within the healthcare institution. Indicated on the actual ED volume line are key policy dates. The dashed horizontal line represents the normalized or expected number of total exams performed over a 7-day period between March 1, 2020, and March 9, 2020. The 7-day total number of new COVID-19 cases overall in the state of Ohio and in the nine-county fingerprint is superimposed
Normal volume by modality
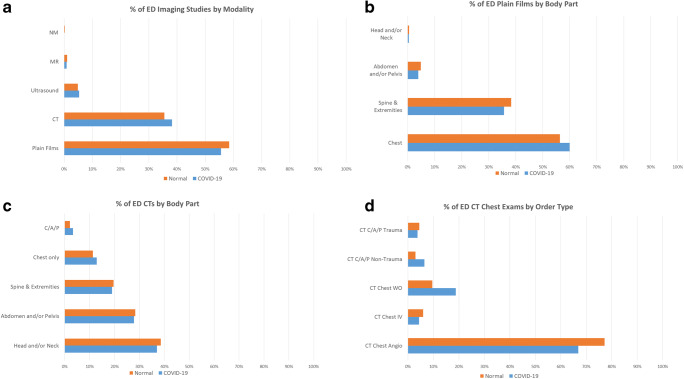
Figure 2 compares our usual ED imaging utilization proportions before the COVID-19 pandemic to utilization proportions during the volume trough (April 11, 2020–April 19, 2020).
Fig. 2.
ED volume proportions before the COVID-19 pandemic (March 1, 2020–March 9, 2020) compared with ED volume proportions during the volume trough (April 11, 2020–April 19, 2020) amidst the pandemic. a By modality. b Plain films categorized by body part. c CT exams categorized by body part. d Chest CT exams broken down by order type. CR, plain films; CT, computed tomography; US, ultrasound; MRI, magnetic resonance imaging; NM, nuclear medicine; C/A/P, chest, abdomen, and pelvis; Angio, angiography; IV, with intravenous contrast; WO, without intravenous contrast
Figure 2a shows that plain films and CTs normally make up a combined 94% (5912 of 6296 exams) of normal ED imaging volume; ultrasound composes 5% (303 of 6296 exams), while MRI, nuclear medicine, and other imaging modalities combine to make up 1% (81 of 6296 exams). During the COVID-19 volume drop, the proportion of CTs increased relative to the other imaging modalities. Plain films and CT were chosen for further interrogation by body part.
Figure 2b shows that the majority of plain films are chest only, making up 56% (2066 of 3668 exams) of the normal total. Spine and extremities compose 38% (1406 of 3668 exams). Exams for abdomen only, pelvis only, and both were combined into the abdomen and/or pelvis category, which made up 5% (177 of 3668 exams). Head and/or neck imaging was grouped together to form 1% (19 of 3668 exams) of all studies. During COVID-19, the proportion of plain film chest imaging increased relative to other body parts from 56% (2066 of 3668 exams) to 60% (1138 of 1897 exams).
In Fig. 2c, we see that, in contrast to plain films, chest only imaging in CT makes up 11% (253 of 2232 exams) of the normal volume. Chest is also included in the C/A/P exams, which make up an additional 2% (47 of 2232 exams). Head and/or neck composes 39% (862 of 2232 exams), abdomen and/or pelvis 28% (633 of 2232 exams), and spine and extremities 20% (437 of 2232 exams). During COVID-19, there was a slight increase in the proportion of both chest only CTs, from 11% (253 of 2232 exams) to 13% (168 of 1306 exams), and C/A/P CTs, from 2% (47 of 2232 exams) to 3% (43 of 1306 exams), compared with CT imaging of the other major body parts.
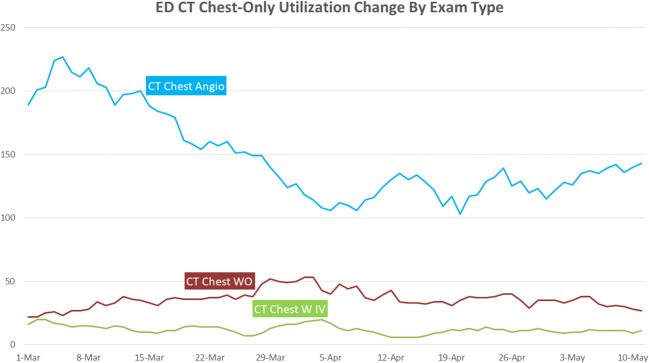
Finally, Fig. 2d shows that normally CT angiography composes 77% (210 of 272 exams) of overall orders involving the chest for CT imaging. Non-contrast chest CT makes up 10% (26 of 272 exams), with contrast makes up 6% (16 of 272 exams), trauma C/A/P studies make up 4% (12 of 272 exams), and non-trauma C/A/P studies compose 3% (8 of 272 exams). During COVID-19, the proportion of non-trauma CT C/A/P increased to 6% (12 of 187 exams) and non-contrast chest CT increased to 19% (35 of 187 exams). The 9% increase in proportion by non-contrast chest CT was the highest in this group.
Change in volume by modality
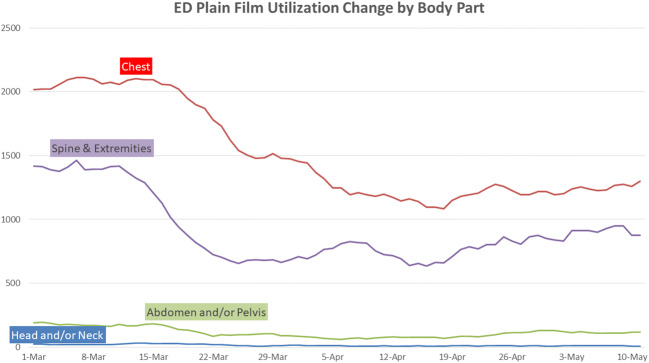
Plain film volume is split by the four highest volume body part categories in Fig. 3 and each is trended chronologically through the relevant 10-week timeframe of the COVID-19 crisis. Each category experienced a volume trough between April 11, 2020, and April 19, 2020. Chest plain films, the highest volume category, experienced a mean drop in volume by 45% (928 exams) from its usual number (p < 0.0001). Spine and extremities, the second highest volume category, dropped by 52% (729 exams) from its usual amount (p < 0.0001). Abdomen and/or pelvis (103 exams) and head and/or neck (11 exams) each fell by 58% from their normal number of imaging studies (p < 0.0001 for both). At their lowest points, chest plain films thus maintained the highest relative amount of volume compared with other categories. Table 1 further details the statistically significant mean drop in volume of each body part category for plain films.
Fig. 3.
Actual 7-day total ED plain film volume between March 1, 2020, and May 11, 2020 split by the four highest volume body part categories: chest, spine and extremities, abdomen and/or pelvis, and head and/or neck
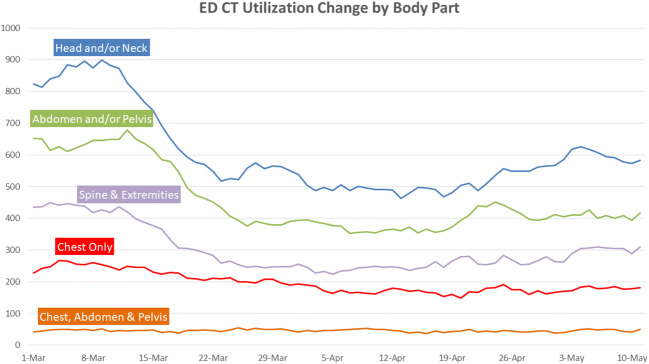
CT volume is split by the five primary body part exams in Fig. 4 and trended similarly to Fig. 3. Head and/or neck, the highest volume category for this modality, experienced a mean volume drop of 44% (378 exams) from its usual value (p < 0.0001). Abdomen and/or pelvis CT volume fell by 43% (270 exams) at its lowest point (p < 0.0001), and spine and extremities volume by 43% (189 exams) at its lowest point (p < 0.0001). The CT categories involving imaging of the chest, however, differed in statistical significance. The 34% (84 exams) decrease in chest only CTs was significant (p < 0.0001), while the 9% (4 exams) decrease in C/A/P CTs was not significant (p = 0.0857).
Fig. 4.
Actual 7-day total ED CT volume between March 1, 2020, and May 11, 2020 split by the five highest volume body part exams: head and/or neck; abdomen and/or pelvis; spine and extremities; chest only; and chest, abdomen, and pelvis
Chest CTs
A normal breakdown of the types of chest only CTs completed in the ED showed that 83% (210 of 253 exams) are angiographic studies (primarily used to assess for PE). During COVID-19, the mean volume from this study dropped by 40% (85 exams) as demonstrated in Fig. 5 and Table 1 (p < 0.0001). Chest CT with contrast fell by 50% (9 exams) at its nadir (p < 0.0001). Non-contrast chest CT actually experienced an increase by 35% (9 studies) in overall utilization between April 11, 2020, and April 19, 2020 (p = 0.0053).
Fig. 5.
Actual 7-day total ED chest CT volume between March 1, 2020, and May 11, 2020 split by type of chest study: CT chest angio, CT chest WO, and CT chest W IV. Angio, angiography; WO, without intravenous contrast; W IV, with intravenous contrast
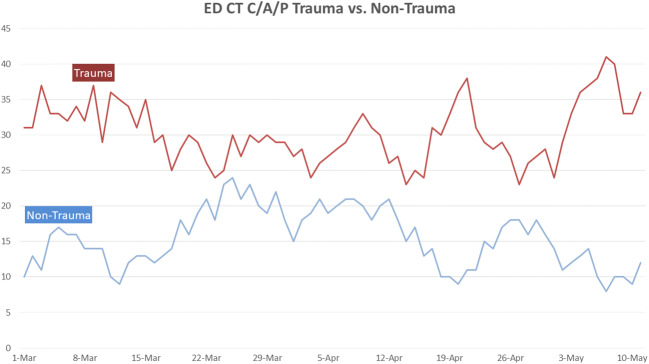
To complete the assessment of chest imaging within the CT domain, the CT C/A/P exams were assessed in Fig. 6. Anecdotally, these are generally performed for trauma patients; on a usual basis, trauma indications make up 69% (33 of 48 exams) of CT C/A/P studies while the rest are categorized as “Non-Trauma” for simplicity. Table 1 demonstrates that the 42% (5 exams) decrease in the mean volume of trauma CT C/A/P studies was statistically significant (p = 0.002), while the 50% (4 exams) increase in mean non-trauma CT C/A/P studies was not a statistically significant change (p = 0.0633).
Fig. 6.
Actual 7-day total ED CT C/A/P exams performed between March 1, 2020, and May 11, 2020 categorized by trauma vs. non-trauma
Discussion
Imaging utilization in the ED setting at our health system was significantly impacted by the COVID-19 pandemic and the policies enacted to curtail its spread, dropping by 46% from its normal level (p < 0.0001). Figure 1 shows a sharp decline in total imaging volume soon after a state of emergency was declared in Ohio on March 9, 2020. This decline continued over the next 6 weeks as further restrictions, including closing of retail, bars, and restaurants, and a stay-at-home order, were issued and healthcare organizations postponed non-essential exams and procedures. Although the latter policy to postpone non-essential exams was impactful on overall hospital volumes, the ED imaging volume drop was felt to be relatively more disrupted by decreased civilian movement within the community due to stay-at-home orders [4].
An important distinction demonstrated by Fig. 1 is the relationship between the new COVID-19 cases overall in Ohio and specifically the new COVID-19 cases in the nine counties served by our system. Interestingly, the 7-day running peak of new cases in Ohio on April 18, 2020, coincided with the timeframe of lowest ED imaging utilization at our system. The lack of an uptick in the nine counties during this same timeframe indicates that this Ohio peak was driven by cases from elsewhere in the state. Combined with the 46% decrease in ED imaging volume at our system during this period, the relatively flat, low-volume curve of the new cases in the nine counties supports the anecdotal idea that strictly from an ED imaging utilization perspective the northeast Ohio region was less impacted by the direct health effects of the COVID-19 pandemic and more impacted by the policies set forth to curtail its spread. In contrast, a similar study conducted at five University of California (UC) health centers demonstrated a 35% overall decrease in ED imaging volumes during a similar timeframe [5]. At the time of this writing, California has thus far seen the second highest number of positive COVID-19 cases in the country compared with Ohio, which has the 16th highest. The relative difference in ED volume drop, 35% versus our 46%, may be due to a higher number of COVID-19-positive patients presenting through the ED at these UC health systems.
Moreover, there were two specific studies that showed a different utilization trend compared with the others during this time period (Table 1). Non-contrast chest CTs demonstrated a statistically significant increase (p = 0.0053) and non-trauma CT C/A/P studies showed no statistically significant change (p = 0.0633) compared to their normal volumes. Put together, these studies were likely often used by ED providers to assess for COVID-19 infection as dictated by the general institutional policy described in the “Methods” section. These observations supported our hypothesis that chest imaging would be relatively less impacted compared with other anatomical regions due to its high involvement in the COVID-19 disease process [13].
Another subset of chest imaging, trauma CT C/A/P studies, did show a statistically significant decrease in volume. These exams compose 69% of all ED CT C/A/Ps normally and their decline likely reflects the aforementioned decrease in civilian movement due to stay-at-home orders. The UC health system study demonstrated similar findings [5].
Since the volume trough in mid-April, the preliminary volume data has been trending upward as demonstrated in Fig. 1. If a new wave of virus outbreak occurs, a state of uncertainty will again rise. Additionally, public concerns about maintaining social distancing in the absence of an effective vaccine or treatment may remain even after stay-at-home orders are lifted and businesses are reopened [14]. Universal masking mandates have been placed in the healthcare workplaces and civilians appear to be following suit [9]. Continuous monitoring and follow-up studies will be important for forecasting demand and reshaping policies in various parts of the country.
There are multiple limitations to this study. First, from data captured in internal departmental reports from prior years, M*Modal estimates volume within 3–10% of the actual number of exams performed. Prior year data has also shown changes in coding practices, thus limiting accurate comparisons of volume across multiple years. This was the primary reason the normalized baseline ED imaging volume was based on a short timespan prior to the state of emergency declaration on March 9, 2020. Additionally, based on the large data set, specific indications for all imaging and imaging results were not examined. This, combined with the lag in COVID-19 testing results for suspected patients, precluded an accurate assessment of the number of confirmed COVID-19 cases that presented through our EDs. Finally, the data from this study only captures the experience of one institution in one region of the country during a 10-week span of the COVID-19 crisis. As discussed, the value of this study is emphasized when compared with similar studies such as the one conducted by the UC system. When aggregating these varying institutional experiences, we can gain a more accurate picture of how imaging utilization in the ED setting was affected during this pandemic. Further studies of this format can also delve into other radiology subspecialty-specific changes in volume.
All in all, the significant decline in ED imaging utilization during this 10-week period reflected the degree to which both the direct health effects of COVID-19 and the governmental policies enacted to slow its spread affected northeast Ohio. Our study did reveal that, within this background of low volume within all modalities and body parts, the change in chest imaging utilization was less pronounced than in other body parts. In fact, non-contrast chest CT demonstrated a statistically significant increase in volume compared with its normal level, while non-trauma CT C/A/P did not show a significant change. Furthermore, our 21 ED systems with one Level 1 and three Level 3 trauma centers showed a small but statistically significant decrease in overall trauma CT C/A/P volume. As health systems continue to navigate the uncertainty of the pandemic while the country progressively opens up, these studies will help inform evidence-based decisions for more accurate volume predictions, policy changes, and potential staff repurposing. These results will also be helpful in preparing applications for federal and state funding relief as part of institutional recovery plans.
Data availability
Data and material are available upon request to the corresponding author.
Compliance with ethical standards
Conflict of Interest
The authors declare that they have no conflict of interest.
Code availability
Not applicable.
Footnotes
Publisher’s note
Springer Nature remains neutral with regard to jurisdictional claims in published maps and institutional affiliations.
Contributor Information
Keval D. Parikh, Email: Keval.Parikh@UHhospitals.org
Nikhil H. Ramaiya, Email: Nikhil.Ramaiya@UHhospitals.org
Elias G. Kikano, Email: egk8@case.edu
Sree Harsha Tirumani, Email: SreeHarsha.Tirumani@UHhospitals.org.
Jonathan Pierce, Email: Jonathan.Pierce@UHhospitals.org.
Carl Butcher, Email: Carl.Butcher@UHhospitals.org.
Jeffrey L. Sunshine, Email: Jeffrey.Sunshine@UHhospitals.org
Donna M. Plecha, Email: Donna.Plecha@UHhospitals.org
References
- 1.Ghebreyesus TA (2020) WHO Director-General’s opening remarks at the media briefing on COVID-19 - 11 March 2020
- 2.Public Health Orders (2020) Ohio Department of Health. https://coronavirus.ohio.gov/wps/portal/gov/covid-19/resources/public-health-orders/public-health-orders. Accessed May 10, 2020 2020
- 3.Stempniak M (2020) Imaging volume dipped upward of 60% at Mednax radiology practices in April. Radiology Business Journal
- 4.Cavallo JJ, Forman HP (2020) The economic impact of the COVID-19 pandemic on radiology practices. Radiology:201495. doi:10.1148/radiol.2020201495. [DOI] [PMC free article] [PubMed]
- 5.Houshyar R, Tran-Harding K, Glavis-Bloom J, Nguyentat M, Mongan J, Chahine C, Loehfelm TW, Kohli MD, Zaragoza EJ, Murphy PM, Kampalath R (2020) Effect of shelter-in-place on emergency department radiology volumes during the COVID-19 pandemic. Emerg Radiol. 10.1007/s10140-020-01797-y [DOI] [PMC free article] [PubMed]
- 6.Walach E (2020) COVID-19 Impact on CT Imaging Volume. AIDOC. https://www.aidoc.com/blog/ct-imaging-volumes-covid19/. Accessed May 10 2020
- 7.Radiology Services 2020 (2020). University Hospitals
- 8.QuickFacts Ohio. United States Census Bureau. https://www.census.gov/quickfacts/fact/table/OH/LFE305218. Accessed May 10 2020
- 9.Rosipko B (2020) Radiology Recovery Plan (trans: Radiology). University Hospitals Health System, Cleveland
- 10.Cases of Coronavirus Disease (COVID-19) in the U.S. (2020) Centers for Disease Control and Prevention. https://www.cdc.gov/coronavirus/2019-ncov/cases-updates/cases-in-us.html. Accessed May 14 2020.
- 11.Coronavirus (COVID-19). (2020) Ohio Department of Health. https://coronavirus.ohio.gov/wps/portal/gov/covid-19/home. Accessed May 14 2020.
- 12.M*Modal Company Overview. 3M. https://mmodal.com/resources/product-brochures/mmodal-company-overview/. Accessed May 10 2020
- 13.Fang Y, Zhang H, Xie J, Lin M, Ying L, Pang P, Ji W (2020) Sensitivity of chest CT for COVID-19: comparison to RT-PCR. Radiology:200432. doi:10.1148/radiol.2020200432. [DOI] [PMC free article] [PubMed]
- 14.Lee CI, Raoof S, Patel SB, Pyatt RS, Jr, Kirsch DS, Mossa-Basha M, Recht M, Carlos RC. Coronavirus disease 2019 (COVID-19) and your radiology practice: case triage, staffing strategies, and addressing revenue concerns. J Am Coll Radiol. 2020;17:752–754. doi: 10.1016/j.jacr.2020.04.025. [DOI] [PMC free article] [PubMed] [Google Scholar]
Associated Data
This section collects any data citations, data availability statements, or supplementary materials included in this article.
Data Availability Statement
Data and material are available upon request to the corresponding author.


