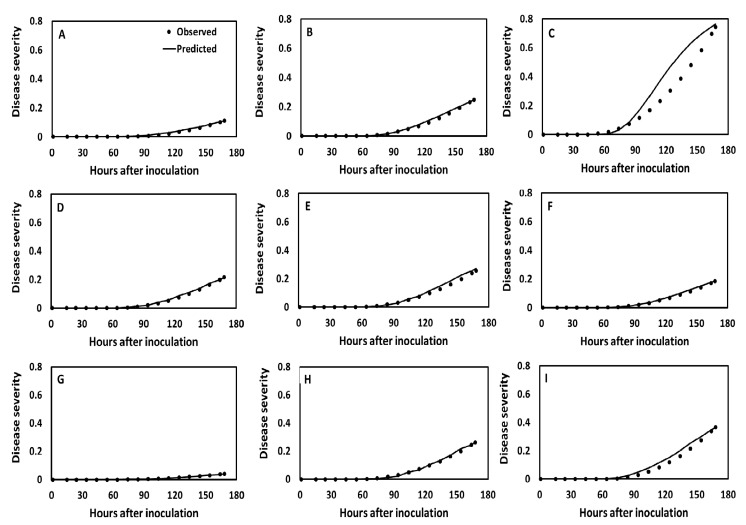
Figure 3.
Observed (dots) and predicted (continuous line) disease progress curves of an isolate of Phytophthora infestans clone US-23 at different constant (A-C) and oscillating (D-I) temperatures (T). A, T = 12 °C; B, T = 17 °C; C, T = 23 °C; D, T = 12 ± 5 °C; E, T = 17 ± 5 °C; F, T = 23 ± 5 °C; G, T = 12 ± 10 °C; H, T = 17 ± 10 °C; and I, T = 23 ± 10 °C. The simulated disease progress curves were obtained with BLIGHTSIM and the observed disease severities in a growth chamber experiment at Gainesville, Florida.

