

Significance Statement
The arteriovenous fistula (AVF) is the preferred vascular access for hemodialysis, but several studies have shown that the primary patency rate at 1 year is approximately 60%. Percutaneous transluminal angioplasty (PTA) is the first line of treatment for AVF stenosis. However, the rate of restenosis after angioplasty is high and the primary patency rate after PTA treatment in AVFs at 6, 12, and 24 months is 61%, 42%, and 35%, respectively. Currently, no durable therapies prolong patency after angioplasty. This paper describes the use of adipose-derived mesenchymal stem cells to reduce stenosis after PTA treatment in a murine AVF model and provides rationale for potential clinical use.
Keywords: arteriovenous fistula, stem cell, vascular access
Visual Abstract

Abstract
Background
Percutaneous transluminal angioplasty (PTA) is the first line of treatment for stenosis in the arteriovenous fistula (AVF) created to provide access for hemodialysis, but resenosis still occurs. Transplants of adipose-derived mesenchymal stem cells (AMSCs) labeled with green fluorescent protein (GFP) to the adventitia could reduce pro-inflammatory gene expression, possibly restoring patency in a murine model of PTA for venous stenosis.
Methods
Partial nephrectomy of male C57BL/6J mice induced CKD. Placement of the AVF was 28 days later and, 14 days after that, PTA of the stenotic outflow vein was performed with delivery of either vehicle control or AMSCs (5×10⁵) to the adventitia of the vein. Mice were euthanized 3 days later and gene expression for interleukin-1 beta (IL-1β) and tumor necrosis factor-alpha TNF-α) analyzed, and histopathologic analysis performed on day 14 and 28. GFP (+) AMSCs were tracked after transplantation for up to 28 days and Doppler ultrasound performed weekly after AVF creation.
Results
Gene and protein expression of IL-1β and TNF-α, fibrosis, proliferation, apoptosis and smooth muscle actin decreased, and the proportions of macrophage types (M2/M1) shifted in a manner consistent with less inflammation in AMSC-transplanted vessels compared to controls. After PTA, AMSC-treated vessels had significantly higher wall shear stress, average peak, and mean velocity, with increased lumen vessel area and decreased neointima/media area ratio compared to the control group. At 28 days after delivery, GFP (+) AMSC were present in the adventitia of the outflow vein.
Conclusions
AMSC-treated vessels had improved vascular remodeling with decreased proinflammatory gene expression, inflammation, and fibrotic staining compared to untreated vessels.
In 2018, approximately 12% of the United States Medicare budget for ESKD treatment was spent on dialysis vascular access–related services.1 Although the arteriovenous fistula (AVF) is the preferred vascular access for hemodialysis, several studies have shown that the primary patency rate of AVF at 1 year is approximately 60%.2,3 The major cause of AVF failure is venous neointimal hyperplasia (VNH), and this is caused by multiple factors including inflammation, uremia, hypoxia, and shear stress leading to deposition of cellular and extracellular matrix in the intimal layer and subsequent venous stenosis formation.4 Percutaneous transluminal angioplasty (PTA) is the first line of treatment for AVF stenosis.2 However, there is a high rate of restenosis after angioplasty and the primary patency rate at 6, 12, and 24 months is 61%, 42%, and 35%, respectively.5
Mesenchymal stem cells (MSCs) are multipotent cells that can be derived from many different sources including muscle, fat, bone marrow, blood, placenta, and umbilical cord.6 There is increasing interest in the use of stem cell–based regenerative therapies for the treatment of vascular stenosis. Several studies have demonstrated that endothelial progenitor cells or MSCs can prevent vascular injury and stenosis formation after angioplasty in arteries.7–9 A recent study from our laboratory showed that human adipose-derived MSCs (AMSCs) transplanted to the outflow vein of AVF at the time of creation could reduce venous stenosis formation in AVFs placed in mice by decreasing proinflammatory gene expression.10 Moreover, we are currently completing a phase 1 trial using AMSCs for preventing vascular stenosis in hemodialysis AVFs (ClinicalTrials.gov identifier, NCT02808208).
We recently created a murine model of angioplasty of venous stenosis associated with AVF.11,12 Using this model, we hypothesized that adventitial transplantation of AMSCs to stenotic outflow veins treated with PTA would have reduced gene expression of proinflammatory cues including IL-1β and TNF-α and venous stenosis formation. We determined the gene changes after AMSC delivery and histomorphometric and hemodynamic changes using ultrasound (US). Finally, we tracked AMSCs isolated from GFP mice that were transplanted to the outflow vein treated with PTA in wild-type mice. In addition, we determined if the AMSCs differentiated into other cell types such as α-smooth muscle actin (α-SMA)– and fibroblast-specific protein-1 (FSP-1)–positive cells as well as their proliferative capacity.
Methods
The Mayo Clinic Institutional Animal Care and Use Committee approved this study. C57BL/6J and GFP (C57BL/6J background) male mice (Jackson Laboratories, Bar Harbor, ME) aged 6–8 weeks were used. They were housed in 12-h light/dark cycles at 22°C and 41% relative humidity with access to food and water ad libitum. Mice were anesthetized using a combination of ketamine (120 mg/kg) and xylazine (10 mg/kg) administered by intraperitoneal injection before all procedures. Before surgery, one dose of buprenorphine-sustained release (0.05–0.1 mg/kg body sc) was administered for pain relief.
AMSC Isolation from Mouse Fat Pad and Characterization
Male C57BL/6J mice or GFP mice were used to isolate AMSC cells. The epididymal fat pads were excised aseptically, minced, and digested with 0.01% collagenase type I (Worthington Biochemical, Lakewood, NJ) in serum-free DMEM for 60 minutes at 37°C. The suspension was centrifuged at 1100 × g for 10 minutes after addition of complete medium (advanced MEM with 5% human platelet lysate; catalog number PLTMax100R; Mill Creek Life Sciences, Rochester MN), 2 mM Glutamax (catalog number 35050061; Thermo Fischer, Waltham, MA), and 20 U/ml heparin and antibiotic and antimycotic mixture (catalog number 15240062; Thermo Fischer). The cell pellet was resuspended in complete medium and passed through a 100-μm cell strainer (BD Biosciences, San Jose, CA) to remove undigested tissue and subsequently passed through a 40-μm cell strainer (BD Biosciences) to remove endothelial cells. The resulting cell suspension was then centrifuged at 1100 × g for 10 minutes. The cell pellet was resuspended in 5 ml of RBC lysis buffer (catalog number 00-4300-54; Invitrogen, Eugene, OR) and centrifuged at 1100 × g for 10 minutes. The resultant pellet was resuspended in complete medium and cultured in T-25 flasks at 37°C in 5% carbon dioxide.
AMSC Characterization
AMSCs were isolated from three different male C57BL/6J mice on different days (Figure 1A). Total RNA was isolated and whole transcriptomic analysis using RNA sequencing (RNA-seq) was performed as described previously.13 Expression values were normalized as reads per kilobase of transcript per million mapped reads (RPKM) for each gene. Heatmaps were created using GENE-E (Broad Institute, Cambridge, MA).
Figure 1.
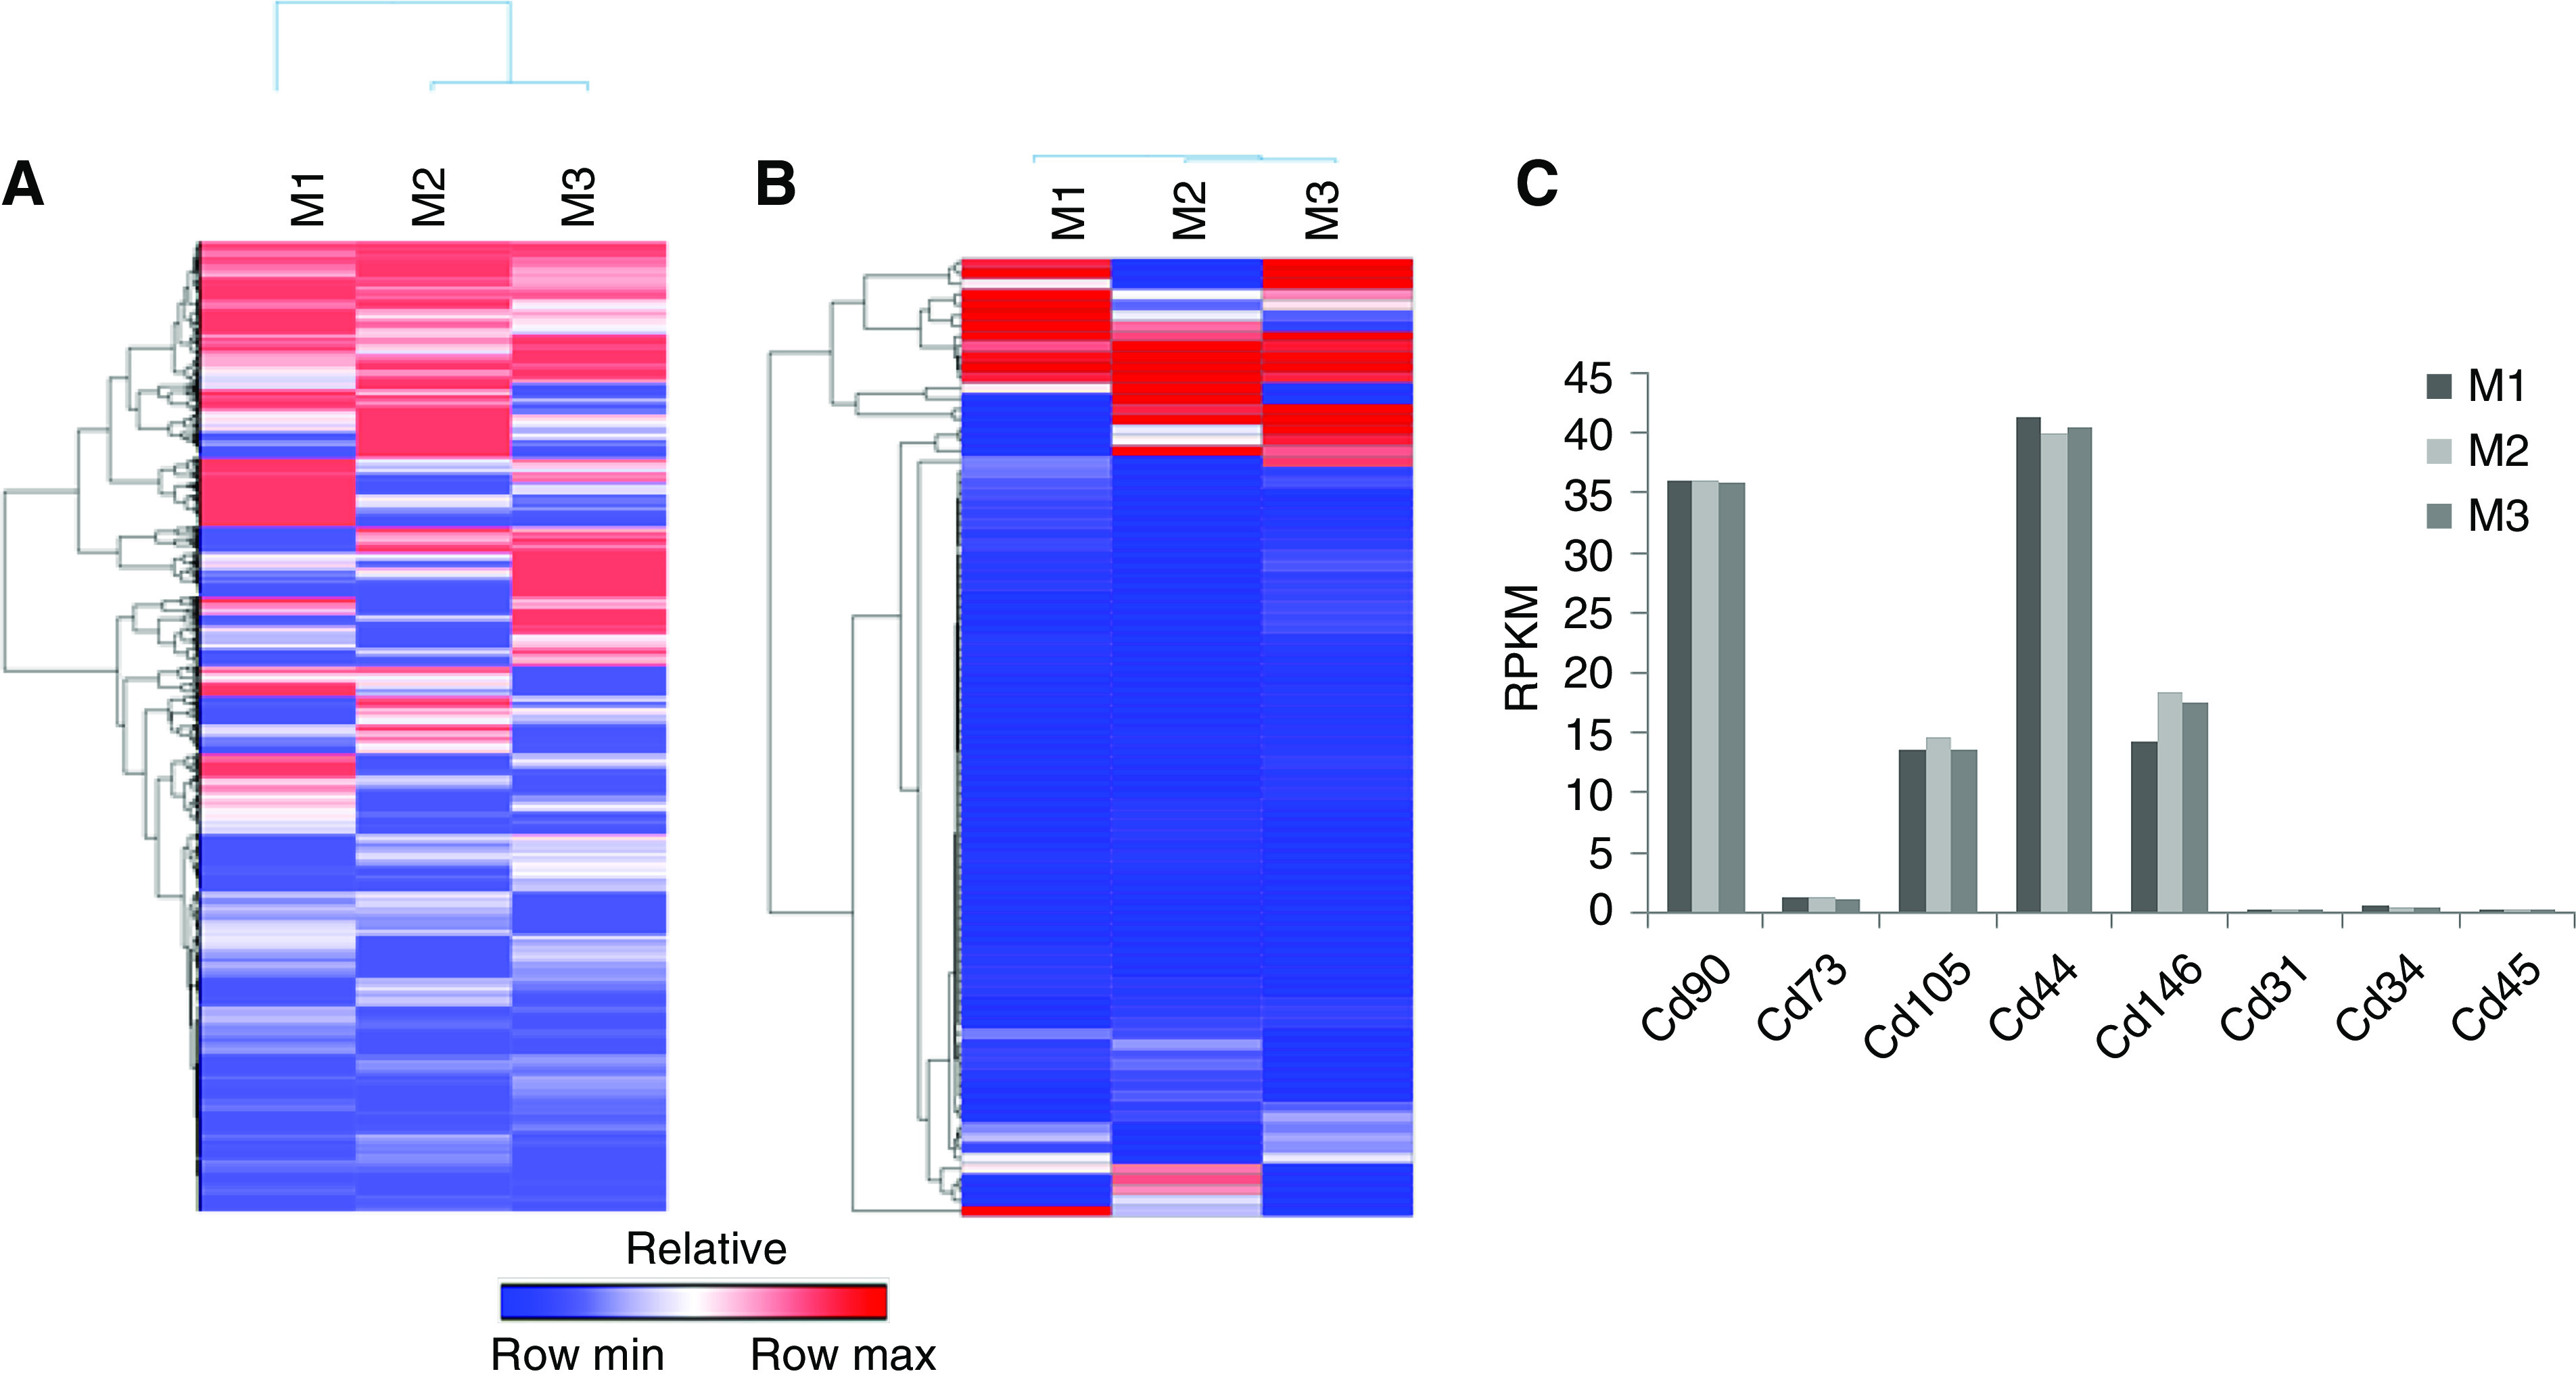
AMSCs characterizations using whole transcriptomic RNA-seq analysis. AMSCs were isolated from three C57BL/6J mice and the RNA underwent whole transcriptomic RNA-seq analysis. (A) Expression values were normalized as RPKM for each gene. Heatmaps were created using GENE-E for all genes that have an FC>0.01. (B) Heat map of RPKMs of all Cd markers that have an FC>0.01. (C) RPKMs for Cd markers showed positive expression of Cd90, Cd73, Cd105, Cd44, and Cd146; and negative expression of Cd31, Cd34, and Cd45. M1, M2, and M3 indicate AMSCs were from C57BL/6J mice. FC, fold change.
Animal Surgeries To Induce CKD, Place an AVF, and Perform Angioplasty
First, CKD was created by surgical ligation of the arterial blood supply to the upper pole of the left kidney accompanied by removal of the right kidney.14 Four weeks later, an AVF was created by anastomosing the end of the right external jugular vein to the side of the left common carotid artery (LCCA) using an 11-0 nylon suture (Aros Surgical Instruments Corporation, Newport Beach, CA).11,12 Venous stenosis developed12 2 weeks after AVF placement and this was treated by performing a PTA procedure. Doppler US was performed before the PTA procedure as described later. The LCCA and outflow vein were isolated after making a transverse skin incision with the use of the dissecting Leica operating microscope (Leica Microsystems, Wetzlar, Germany). The distal and proximal end of the LCCA and distal end of outflow vein were clamped using three microsurgical clamps (S&T AG Microsurgical Instruments, Neuhausen, Switzerland). Next, the outflow vein was punctured and the lumen was flushed with 1 ml of heparinized saline (100 U/ml). The balloon catheter (1.25 mm×6.0 mm coronary balloon catheter; Medtronic Inc., Minneapolis, MN) was advanced carefully through the puncture point into the outflow vein to the anastomosis under visual inspection using the Leica operating microscope. The balloon was inflated to 14 atm for 30 seconds (Supplemental Figure 1A). After the PTA procedure, the balloon was deflated and removed and the lumen was flushed with 1 ml heparinized saline (100 U/ml). The puncture site was sutured with 11-0 nylon suture. The outflow vein and LCCA were unclamped and the patency of the vein was confirmed visually. US was then performed as described later. For the PTA+AMSC group, before incision closure, 5×10⁵ AMSCs in 10 μl of serum-free medium were transplanted onto the adventitia of the PTA-treated outflow vein (Supplemental Figure 1, A and B). In the PTA+vehicle mouse, 10 μl of serum-free medium without AMSCs was delivered. The diameter of the outflow vein was measured intraoperatively.
Murine BUN and Creatinine Assay
At day −42 (before CKD surgery) and day 14, 0.2 ml of blood was collected from each mouse for kidney function examination and another 0.5 ml of blood was collected at euthanasia. Using an Abaxis Vetscan VS2 machine (Abaxis Inc., Union city, CA), serum BUN and creatinine were determined by the QuantiChrom Urea Assay Kit (BioAssay Systems, Hayward, CA) and the Mouse Creatinine Assay Kit (Crystal Chem, Elk Grove Village, IL), respectively.
Doppler US Examination
We used a Doppler scanner (Doppler Flow Velocity System; INDUS Instruments, Houston, TX) with a high-frequency, 20-MHz transducer probe to evaluate the AVF patency by determining the velocity of the blood flow. Eight consecutive cycles were recorded. The peak velocity (PV), mean velocity (MV), and pulsatility index (PI) were analyzed using the Doppler signal processing workstation version 1.627 (Doppler Flow Velocity System; INDUS Instruments) using the murine peripheral blood flow mode. The average wall shear stress (WSS) was calculated by the equation WSS=4ηV/r, and the Reynolds number (Re) by the equation Re=ρ Vmean D/η, where η is blood viscosity, V is peak flow velocity (cm/s), Vmean is mean flow velocity (cm/s), r is the radius (cm), D is the diameter (cm), and ρ is blood density. Blood viscosity and blood density were assumed to be constant at 0.035 P and 1.057 g/cm3, respectively.15–18 We measured the intraoperative inflow arterial diameter and outflow vein diameter at time of AVF placement, PTA, and euthanasia. During the noninvasive Doppler detection, the outflow vein could be easily compressed with the probe. We calculated the AVF flow rate (ml/min)=VAmean×π×Da2×60/400,19 where VAmean is the MV of the inflow artery and Da is the inflow arterial diameter.
Murine Tissue Collection and Processing
Six mice per group were euthanized for gene expression analysis by fixing in RNA stabilization reagent (Qiagen, Hilden, Germany). Outflow veins were dissected and prepared for histomorphometric analysis by fixing in 10% formalin reagent (Fisher Scientific, Pittsburgh, PA) (Supplemental Figure 1C). Each vessel was embedded longitudinally as described previously.11 Typically, an average of 60 consecutive 4-μm sections were obtained per outflow vein (V1 and V2) per animal for analysis.
Real-Time PCR
At day 3, AMSC-treated or control outflow veins were harvested for gene expression analysis using quantitative real-time PCR (RT-PCR) as described previously.10 The primers used are shown in Supplemental Table 1. cDNA was synthesized using the iScript kit (Bio-Rad, Hercules, CA) according to the manufacturer’s instructions. All RT-PCRs were carried out using the iTaq Universal SYBR Green Master Mix (Bio-Rad) in a C1000 thermal cycler equipped with a CFX96 Real Time System (Bio-Rad) and the quantification cycles (cq) values were measured by the Bio-Rad CFX Manager software. The difference in cq (∆cq) values of AMSC or vehicle-treated outflow veins were normalized with Tata box binding protein (TBP) 1, glyceraldehyde-3-phosphate dehydrogenase, and tubulin, and the fold change in gene expression was calculated following the 2−(ΔΔCT) method.
Immunohistochemistry and Immunofluorescence Staining
Staining was performed on paraffin-embedded sections by using the same axial outflow vein sections from the AMSC-treated or control outflow veins using the EnVision (Dako, Carpinteria, CA) method with a heat-induced antigen-retrieval step.20 The primary antibodies used are listed in Supplemental Table 2. Peroxidase activity was visualized using 3,3′-diaminobenzidine as chromogen. Slides stained with IgG corresponding to the primary antibody species served as negative controls. Prolong Gold antifade reagent with 4′,6-diamidino-2-phenylindole (Invitrogen) was used for nuclear staining and mounting for immunofluorescence staining.
Terminal Deoxynucleotidyl Transferase–Mediated Digoxigenin-Deoxyuridine Nick-End Labeling and Picrosirius Red Staining
The terminal deoxynucleotidyl transferase (TdT)–mediated digoxigenin-deoxyuridine nick-end labeling (TUNEL) assay was performed on paraffin-embedded sections to evaluate apoptosis according to the manufacturer’s instructions (TACS 2 TdT DAB In Situ Apoptosis Detection Kit; Thermo Scientific). Stained slides without TdT enzyme were used as negative controls. Picrosirius Red (Sigma-Aldrich, St. Louis, MO) staining was performed to evaluate vascular fibrosis and collagen 1 and 3 content.
Morphometric and Image Analysis
Outflow veins were stained for hematoxylin and eosin to assess for venous remodeling and viewed using a Zeiss Imager. Images were digitized to capture a minimum of 1936×1460 pixels covering one entire cross-section using an M2 Microscope (Carl Zeiss) with an Axiocam 503 color camera (Carl Zeiss) and analyzed using ZEN 2 (blue edition) version 2.0 (Carl Zeiss) as described elsewhere.20
Statistical Analysis
Results are presented as the mean±SEM. Statistical differences were tested by either a one-way or two-way ANOVA with a post hoc Bonferroni correction or unpaired t test. The level of significance was set at NS P>0.05, *P<0.05, **P<0.01, ***P<0.001, or #P<0.0001. GraphPad Prism version 8 (GraphPad Software Inc, La Jolla, CA) was used for all statistical analysis.
Results
AMSC Characterization Using Whole Transcriptomic Analysis Using RNA-Seq
AMSCs were isolated from three 6- to 8-week-old C57BL/6J mice on different days. Whole transcriptomic analysis was performed using RNA-seq and a heatmap was generated for all genes (25723) that have detectable expression (RPKM>0.01) (Figure 1A). To assess the quality of these MSCs, we also examined the subset of genes that encode proteins expressed at the cell surface, including all known cluster of differentiation (Cd) proteins (Figure 1B). Previous studies have shown that mRNA expression data obtained by RNA-seq provides accurate qualitative biomarkers for AMSC characterization.21 Our AMSCs were positive for expression of Cd90, Cd73, Cd105, Cd44, and Cd146, but negative for Cd31, Cd34, and Cd45, consistent with previous observations with human AMSCs.21 Normalized read values of Cd markers (in RPKM) are very similar across AMSCs derived from three different mice (Figure 1C). Hence, the mouse AMSCs isolated in this study are qualitatively similar to human AMSCs, and exhibit similar expression of cell surface markers. This analysis indicates consistency in the preparation and biologic properties of AMSCs used in our study.
Surgical Outcomes
A total of 50 C57BL/6J mice (vehicle group, n=18; AMSC group, n=32) comprise this study (Supplemental Figure 1C). There was no significant difference between the average body weight of the mice treated with AMSCs or vehicle control (Supplemental Figure 2A). Outflow vein patency was assessed using Doppler US and better patency was observed in AMSC-treated mice compared with controls (Supplemental Figure 2B). There was no difference in the average BUN (Supplemental Figure 2C) and average creatinine between the two groups at any time point (Supplemental Figure 2D).
Hemodynamic Changes after PTA Treatment plus AMSC Transplantation Compared with Controls
After AVF creation, the Doppler signal of the outflow vein had an arterial waveform with spectral broadening (Figure 2A). The diameter of the outflow vein was measured intraoperatively at AVF placement, pre- and postangioplasty, and at euthanasia in each animal (Figure 2B). At 28 days after angioplasty, the average diameter of the outflow vein was significantly increased in the AMSC-treated vessels compared with controls (AMSC, 1.00±0.06 mm; control, 0.45±0.10 mm; average increase, 222%; P<0.05; Figure 2B). The diameter of the inflow artery was measured intraoperatively at AVF placement, pre- and postangioplasty, and euthanasia in each animal and there was no difference between both groups at any time point (Supplemental Figure 2E). The velocity of the blood flow is used to detect stenosis formation in clinical and experimental AVFs.22,23 The PV of the outflow vein was determined by performing Doppler US weekly after AVF creation. Before angioplasty, there was no significant difference in the average PV between the two groups (Figure 2C). The average PV had increased significantly in the AMSC-treated vessels compared with controls at day 7 (AMSC, 217.92±4.02 cm/s; control, 167.61±3.51 cm/s; average increase, 130%; P<0.0001; Figure 2C), day 14 (AMSC, 203.23±5.63 cm/s; control, 144.63±9.75 cm/s; average increase, 41%; P<0.001; Figure 2C), day 21 (AMSC, 150.32±5.24 cm/s; control, 51.72±17.56 cm/s; average increase, 291%; P<0.05; Figure 2C), and day 28 (AMSC, 146.81±5.80 cm/s; control, 30.09±13.28 cm/s; average increase, 488%; P<0.01; Figure 2C). Moreover, we demonstrated the PV had a positive correlation with outflow vein diameter (linear regression r2=0.75, P<0.0001; Figure 2D). Thus, these data suggest that, in this AVF model, higher PV indicates better AVF patency.
Figure 2.
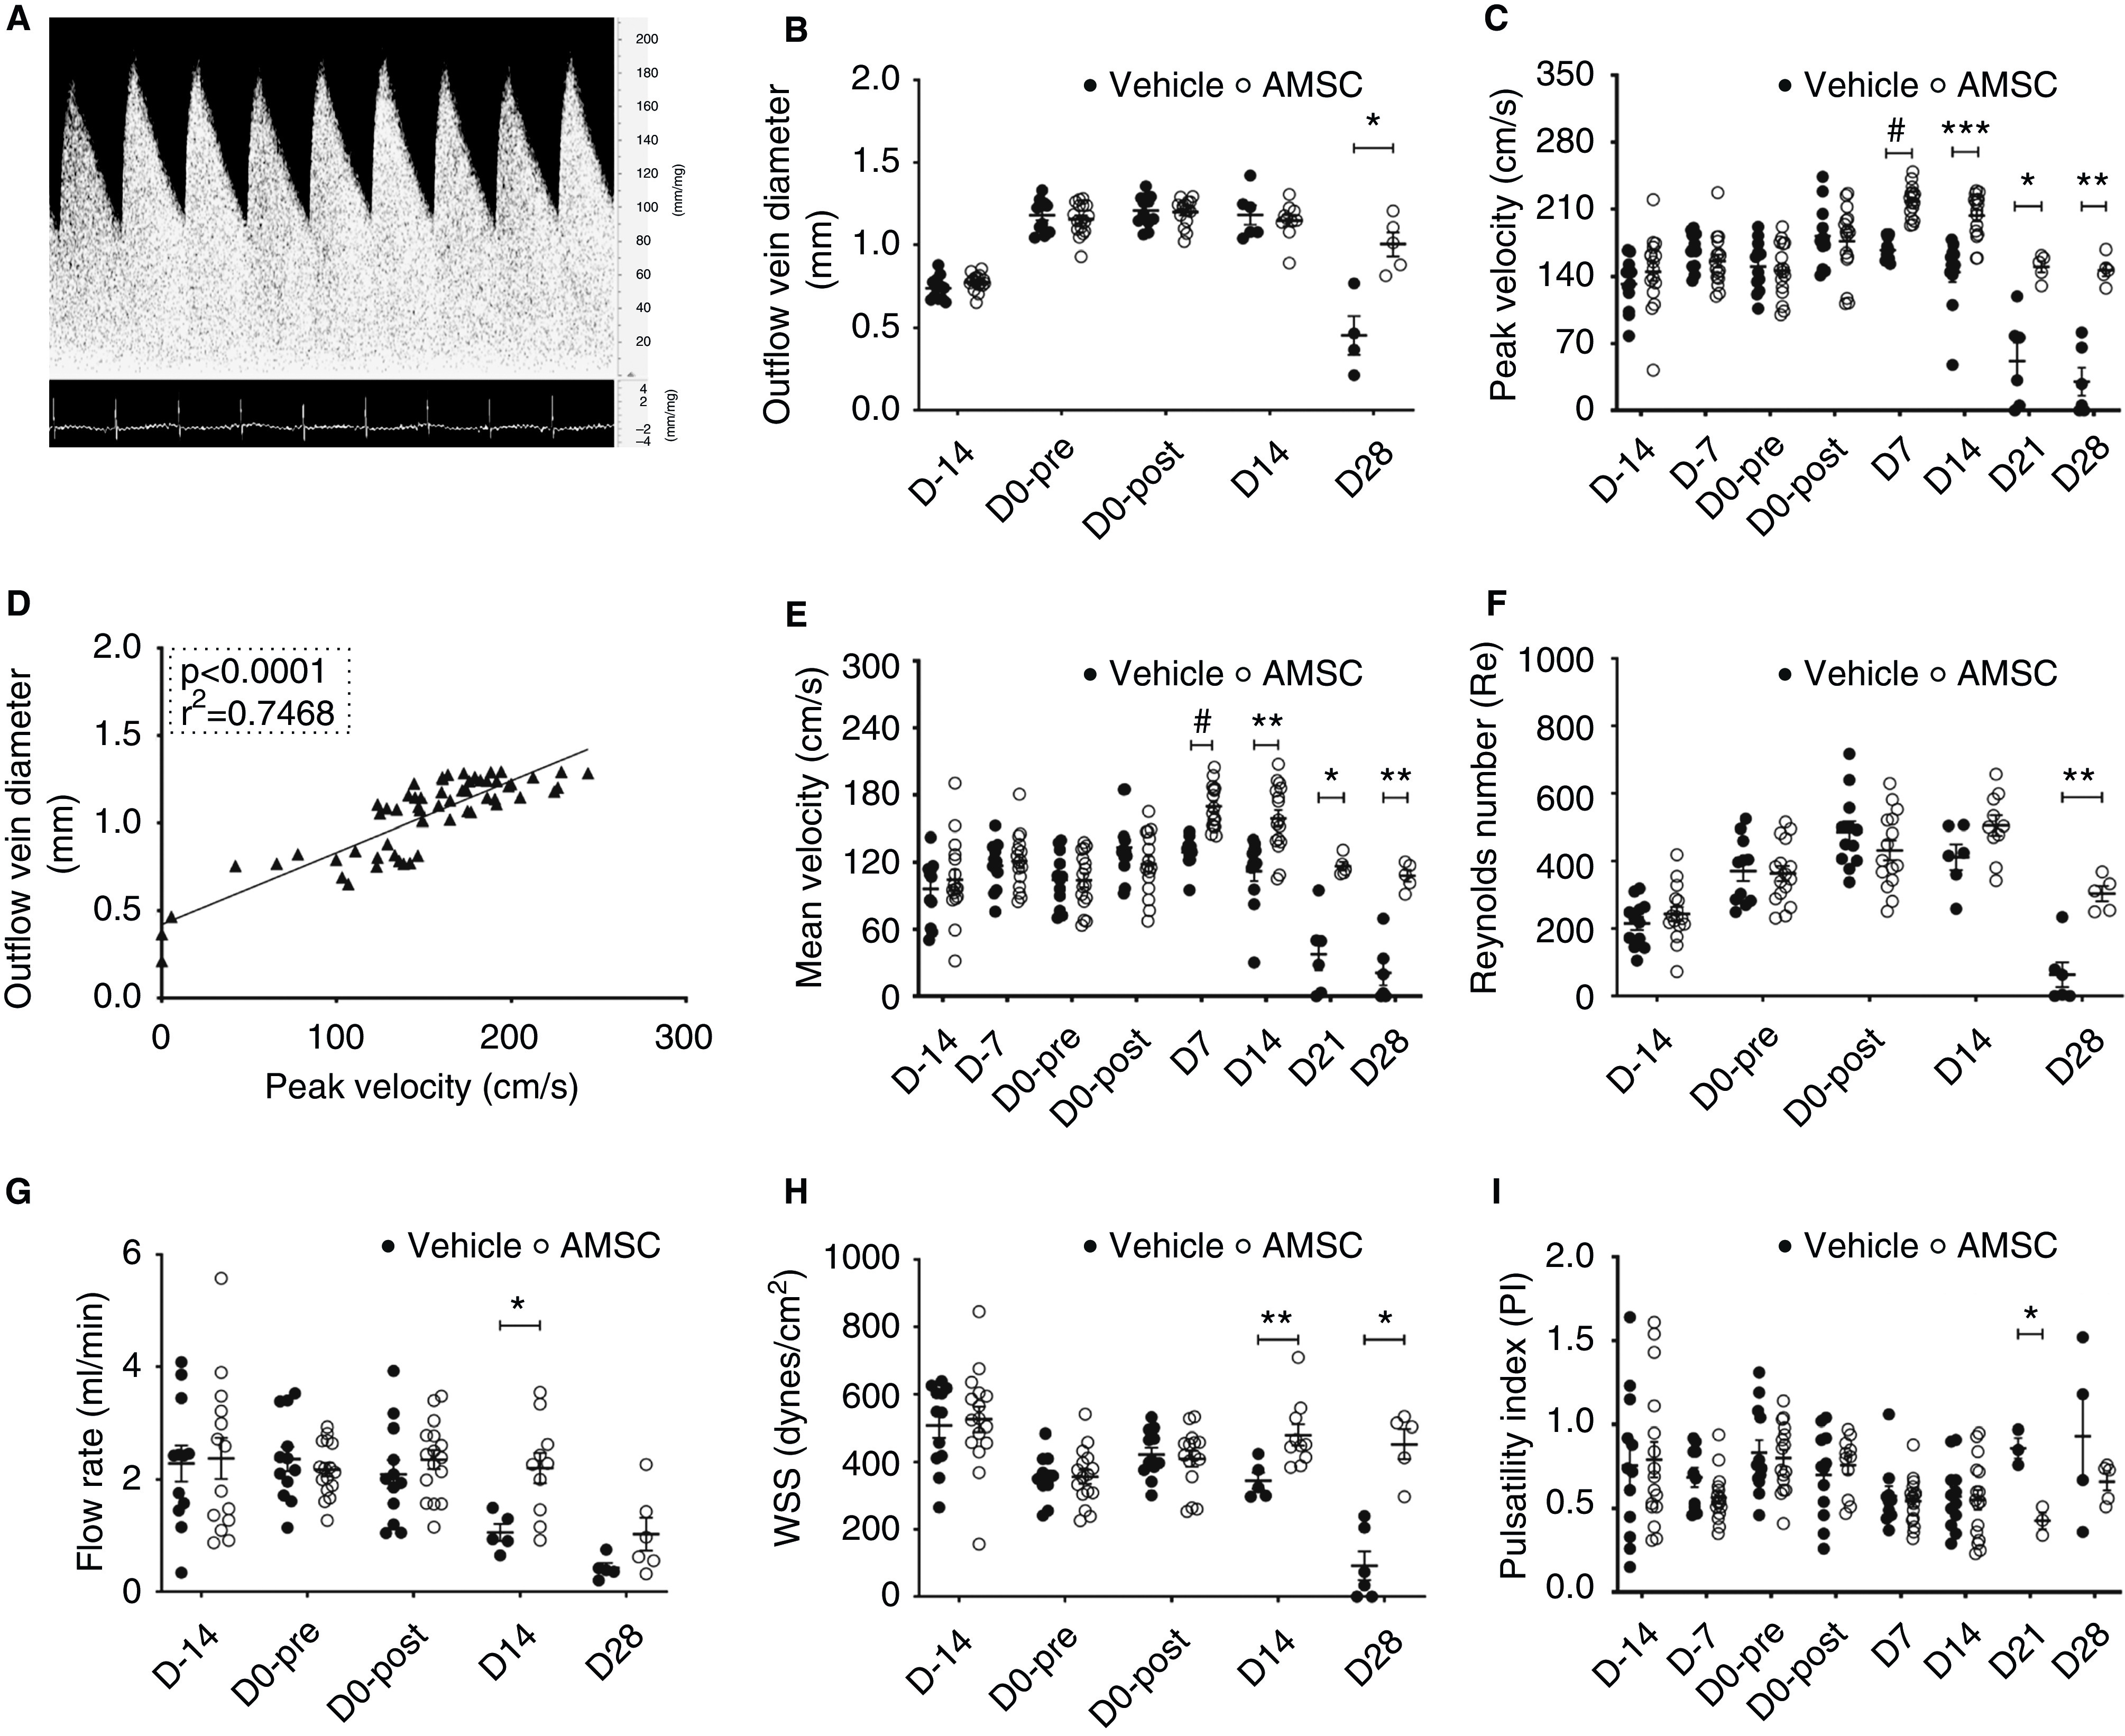
AMSCs transplantation improves hemodynamics of PTA treated vessels. (A) Representative Doppler signal of outflow vein showing an arterial waveform. (B) At day 28 (D28), there was a significant increase in the average diameter of the outflow veins of AMSC-treated vessels compared with controls. (C) There was a significant increase in the PV of the blood in the outflow veins at 7, 14, 21, and 28 days after PTA in the AMSC-treated vessels compared with controls. (D) Regression analysis showed a positive correlation between peak velocities and outflow vein diameters (linear regression r2=0.75, P<0.0001). (E) There was a significant increase in the average MV of the blood in the outflow veins at 7, 14, 21, and 28 days in the AMSC-treated vessels compared with controls. (F) Each Re was <1000 at each time point. (G) At day 21, there was a significant increase in the average flow rate of AMSC-treated vessels compared with control vessels. (H) There was a significant increase in the average WSS at 14 and 28 days after PTA in the AMSC-treated vessels compared with controls. (I) At day 21, there was a significant decrease in the average PI in the AMSC-treated vessels compared with controls. Each scatterplot bar graph represents the mean±SEM of four to 16 animals. Two-way ANOVA with Bonferroni correction was performed. Significant differences are indicated. *P<0.05, **P<0.01, ***P<0.001, #P<0.0001.
The MV showed similar changes as the PV. There was a significant increase in the average MV in the AMSC-treated vessels compared with controls at day 7 (AMSC, 169.78±4.71 cm/s; control, 128.79±4.33 cm/s; average increase, 132%; P<0.0001; Figure 2E), day 14 (AMSC, 158.93±7.31 cm/s; control, 112.12±8.47 cm/s; average increase, 142%; P<0.01; Figure 2E), day 21 (AMSC, 116.60±3.48 cm/s; control, 37.64±13.19 cm/s; average increase, 310%; P<0.05; Figure 2E) and day 28 (AMSC, 107.89±4.72 cm/s; control, 20.97±10.19 cm/s; average increase, 514%; P<0.01; Figure 2E).
The Re has been used to assess the presence of turbulent blood flow in clinical and experimental AVFs.16,24 In both groups, the average Re was <1000 (Figure 2F), and this indicates a lack of turbulence in AVFs.25 By day 28, the average Re was significantly increased in the AMSC-treated vessels compared with controls (AMSC, 303.65±20.46; control, 63.25±33.74; average increase, 480%; P<0.01; Figure 2F). Additionally, we calculated the blood flow in the inflow artery, which is used in clinical and animal studies to assess the AVF function.19,26 The blood flow in the inflow artery was easier to measure because of the rapid heart rate of the mouse and its effect on the jugular vein, which is more compliant. In the vehicle group, the average blood flow rate decreased after the PTA procedure (Figure 2G). By day 14, the average flow rate was significantly increased in the AMSC-treated vessels compared with controls (AMSC, 2.20±0.26 ml/min; control, 1.06±0.14 ml/min; average increase, 208%; P<0.05; Figure 2G). We next determined the change in WSS over time in both groups. Low WSS has been linked to VNH in clinical and experimental AVFs.11,27 There was a significant increase in the average WSS of AMSC-treated vessels compared with controls at day 14 (AMSC, 479.65±29.37 dyn/cm2; control, 344.41±21.91 dyn/cm2; average increase, 139%; P<0.01; Figure 2H) and day 28 (AMSC, 452.19±39.46 dyn/cm2; control, 91.79±39.17 dyn/cm2; average increase, 493%; P<0.05; Figure 2H).
Finally, we evaluated the PI. A PI >1.04 has been shown to be associated with increased incidence of AVF stenosis and thrombosis.28 At day 21 there was a significant decrease in the average PI of AMSC-treated vessels compared with controls (AMSC, 0.43±0.04; control, 0.86±0.05; average decrease, 150%; P<0.05; Figure 2I).
Decreased Gene and Protein Expression of IL-1β and TNF-α in AMSC-Treated Vessels
AMSCs can reduce proinflammatory gene expression.10 We assessed the expression of IL-1β and TNF-α using quantitative RT-PCR in AMSC-treated vessels compared with controls at day 3 after PTA (Figure 3). We observed that the average gene expression of IL-1β and TNF-α was significantly decreased in the AMSC-treated vessels compared with controls (IL-1β: AMSC, 0.62±0.11; control, 1.08±0.12; average decrease, 43%; P<0.05; Figure 3A; and TNF-α: AMSC, 0.34±0.10; control, 1.03±0.10; average decrease, 67%; P<0.01; Figure 3B). We next performed staining for IL-1β (Figure 3C) and TNF-α (Figure 3D). We observed that the average staining for IL-1β and TNF-α was significantly decreased in the AMSC-treated vessels compared with controls at day 14 (IL-1β: AMSC, 4.75±0.62; control, 6.96±0.51; average decrease, 32%; P<0.05; Figure 3E; and TNF-α: AMSC, 1.76±0.26; control, 5.70±0.87; average decrease, 69%; P<0.001; Figure 3F). We next performed double staining of IL-1β and TNF-α with CD68, FSP-1, and α-SMA to identify the cells that may express these cytokines (Supplemental Figures 3 and 4). IL-1β mostly showed positive costaining for CD68 and less in the FSP-1 and α-SMA (+) cells in the AMSC-treated vessels compared with controls (Supplemental Figure 3). For TNF-α staining, the positive costaining occurred mainly in the CD68 (+) cells, and less in the FSP-1 (+) cells (Supplemental Figure 4).
Figure 3.
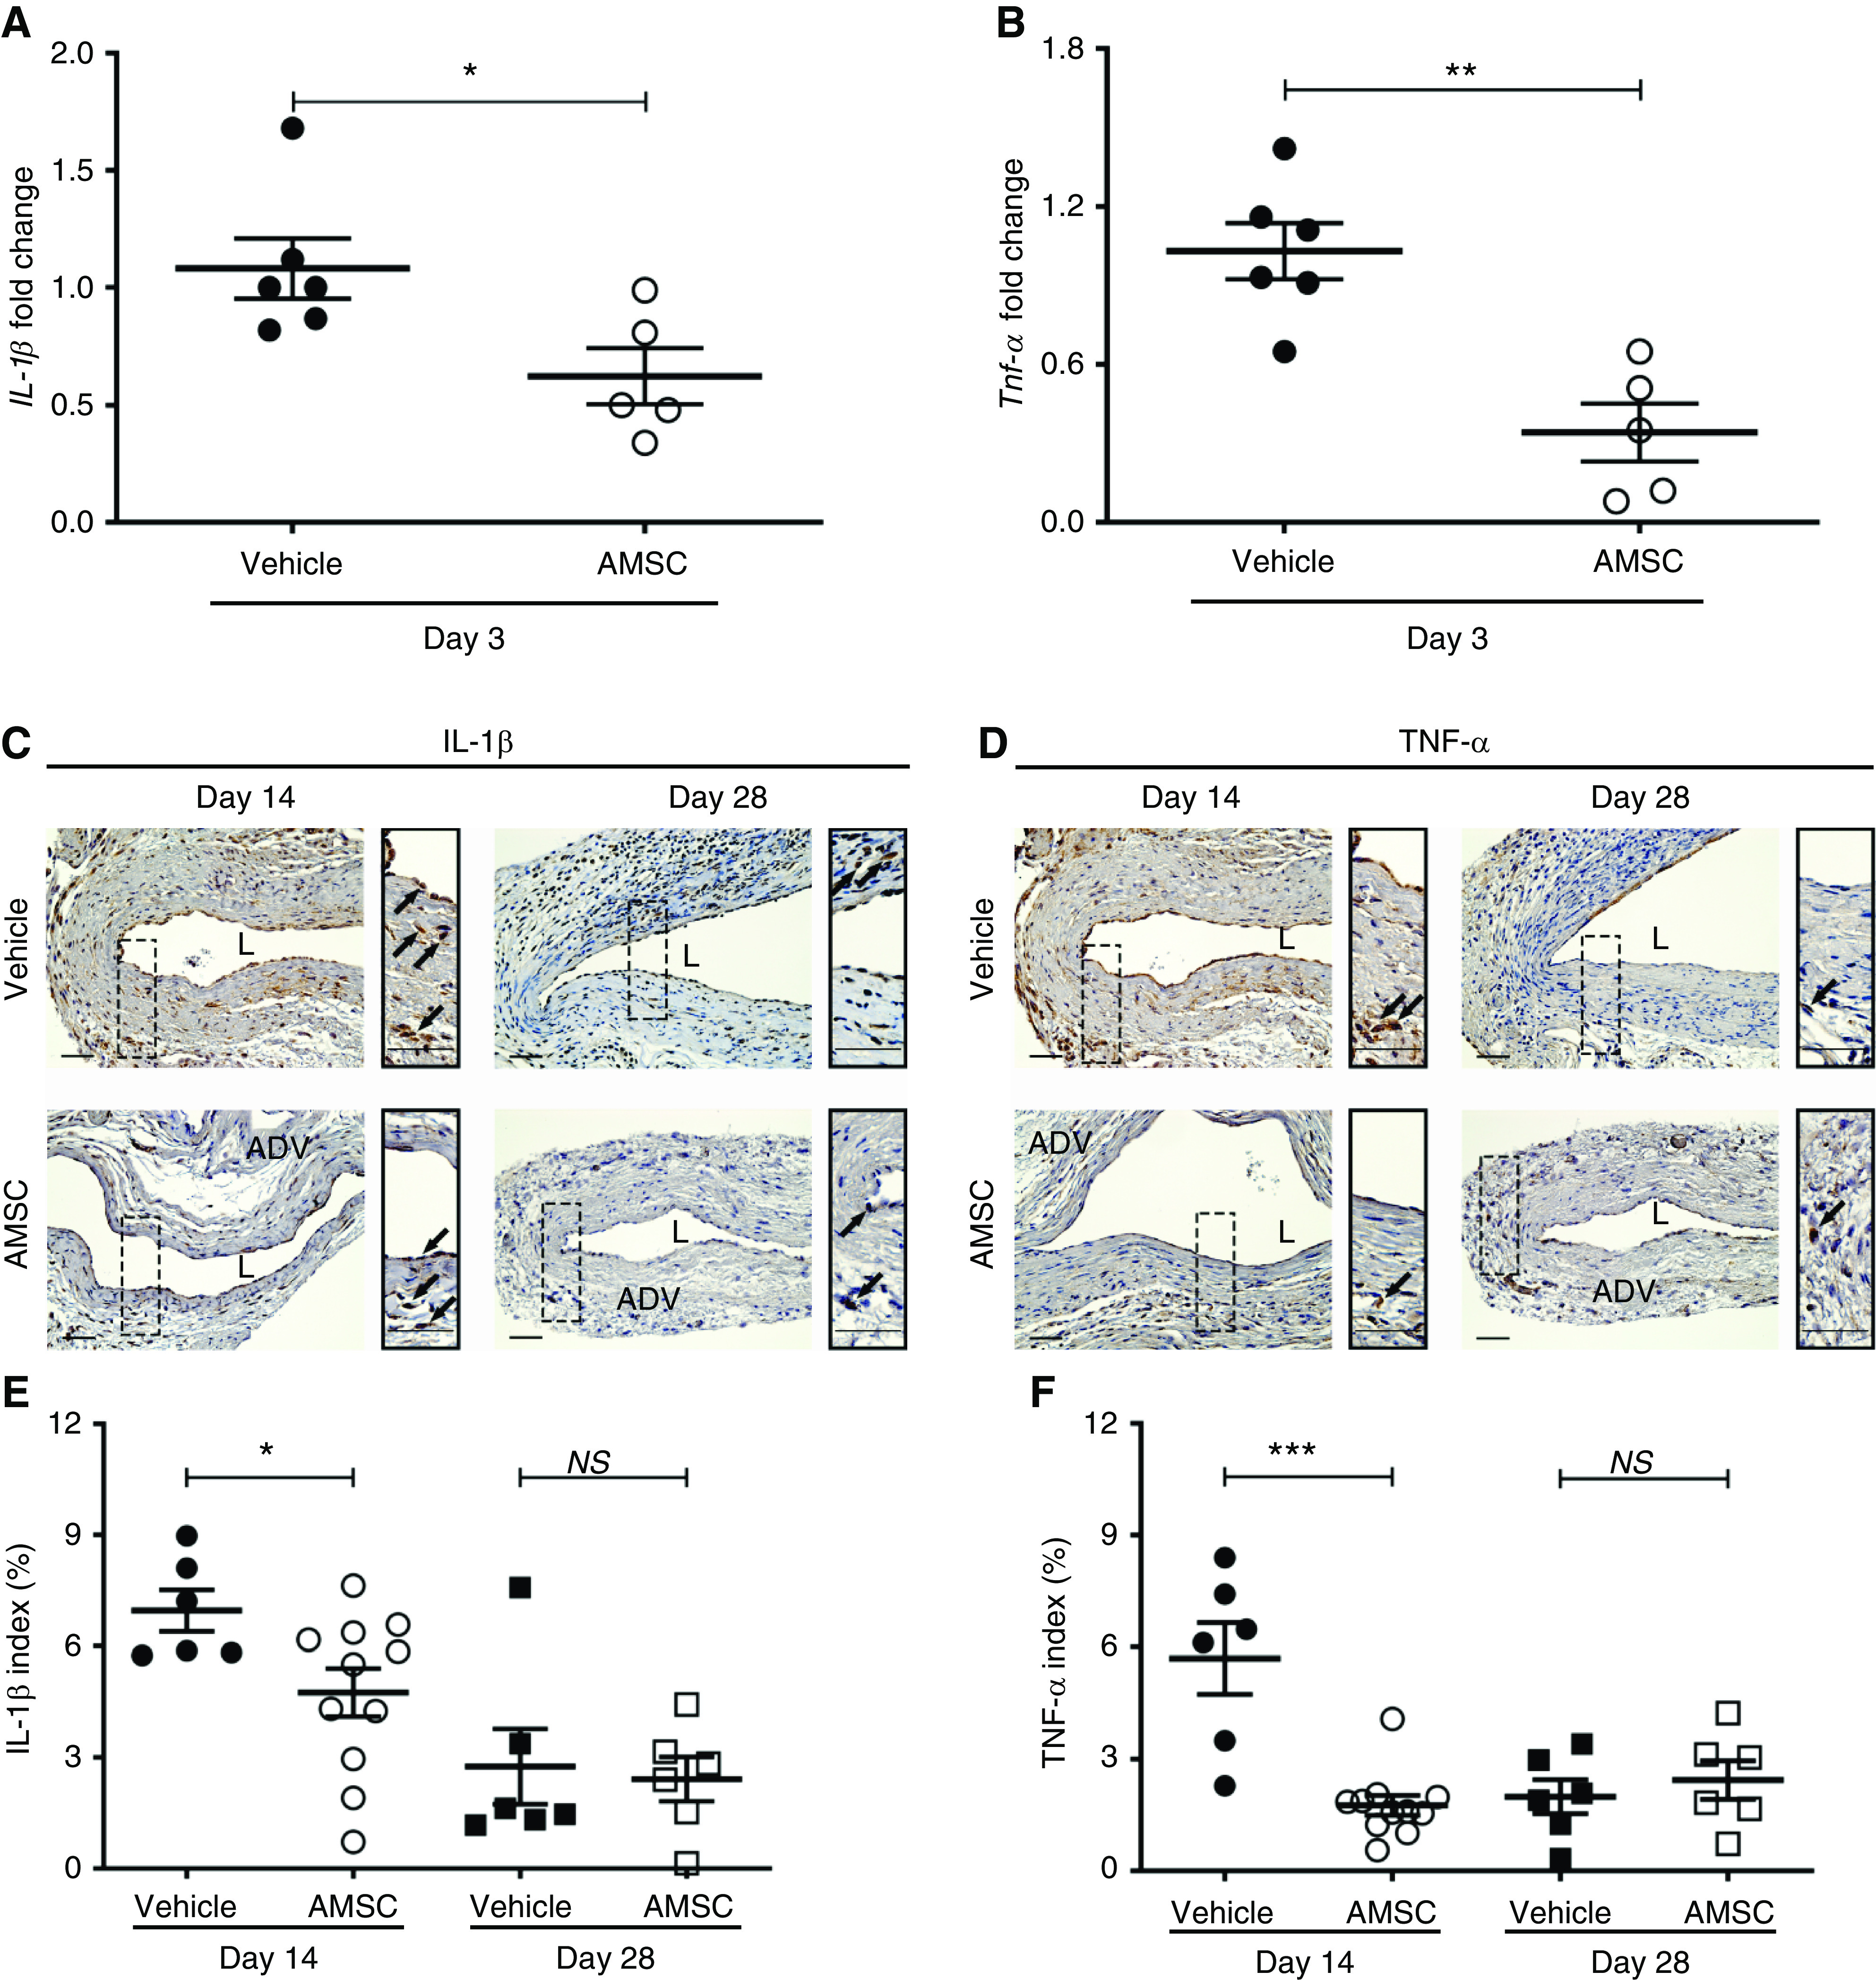
Decrease in average proinflammatory gene expression and cytokines in outflow veins after AMSC treatment. (A and B) are pooled data from RT-PCR analysis of IL-1β and TNF-α in AMSC-treated vessels compared with controls at day 3 in CKD mice. There was significant reduction in the average gene expression of IL-1β (P<0.05) and TNF-α (P<0.01) in the AMSC-treated vessels compared with in controls. (C and D) Representative immunostaining of IL-1β and TNF-α is shown. At day 14, there was more positive staining throughout the vessel wall in controls, whereas the positive staining of the AMSC-treated veins was in the adventitial layer. (E and F) At day 14, semiquantitative analysis showed a significant reduction in the average IL-1β and TNF-α staining in the AMSC-treated vessels compared with controls. Brown staining is positive for IL-1β and TNF-α. Solid arrows indicate positive staining. Scale bar, 50 μm. Each scatterplot bar graph represents the mean±SEM of five to 11 animals. t test was performed. Significant differences are indicated. *P<0.05, **P<0.01, ***P<0.001. ADV, adventitia; L, lumen.
Outward Remodeling of AMSC-Treated Vessels Compared with Controls
We performed histomorphometric analysis on hematoxylin and eosin–stained, paraffin-embedded outflow vein sections from day 14 and 28 (Figure 4, A and B). The outflow vein was divided into two sections labeled V1 and V2. The distal segment was the puncture site used to insert the balloon to perform the PTA procedure. V1 was next to it and V2 was near the anastomosis of the AVF (Supplemental Figure 5B). We determined the lumen vessel area, neointima area, and neointima/media area (N/M) ratio for these two locations at day 14 from the AMSC-treated group and control group. The average vessel lumen area of the V1 segment was as follows: AMSC, 74,978.62±6743.90 μm2; vehicle, 50,027.09±3689.60 μm2; average increase, 150%; P<0.05 (Supplemental Figure 5C). The V2 segment comparison was as follows: AMSC, 70,034.78±7356.04 μm2; vehicle, 50,177.15±5065.98 μm2; average increase, 140%; P=0.08 (Supplemental Figure 5C). The average neointima area of V1 location was as follows: AMSC, 14,936.88± 1659.11 μm2; vehicle, 21,489.95±2014.35 μm2; average decrease, 30%; P<0.05 (Supplemental Figure 5D). The average neointima area of the V2 location was as follows: AMSC, 18,789.67±1897.59 μm2; vehicle, 28,744.65±4650.62 μm2; average increase, 35%; P<0.05 (Supplemental Figure 5D). The average N/M ratio of the V1 location was as follows: AMSC, 0.34±0.03; vehicle, 0.56±0.03; average decrease, 39%; P<0.0001 (Supplemental Figure 5E). The average N/M ratio of V2 was as follows: AMSC, 0.36±0.03; vehicle, 0.59±0.04; average decrease, 39%; P<0.001 (Supplemental Figure 5E). Based on these measurements, we evaluated the V1 location for the AMSC-treated vessels compared with controls for day 14 and 28. The average lumen vessel area was significantly increased in the AMSC-treated vessels compared with controls at day 14 (AMSC, 74,978.62±6743.90 μm2; control, 50,027.09±3689.60 μm2; average increase, 150%; P<0.05; Figure 4C). The average ratio of the N/M was significantly decreased in the AMSC-treated vessels compared with controls at day 14 (AMSC, 0.34±0.03; control, 0.56±0.03; average decrease, 39%; P<0.0001; Figure 4D) and day 28 (AMSC, 0.47±0.03; control, 0.78±0.03; average decrease, 40%; P<0.0001; Figure 4D). The average cell wall density was significantly decreased in the AMSC-treated vessels compared with controls at day 14 (AMSC, 13,642.91±842.33/mm2; control, 21,734.82±1785.43/mm2; average decrease, 37%; P<0.001; Figure 4E) and day 28 (AMSC, 19,572.48±1345.64/mm2; control, 28,565.28±1585.26/mm2; average decrease, 31%; P<0.01; Figure 4E).
Figure 4.
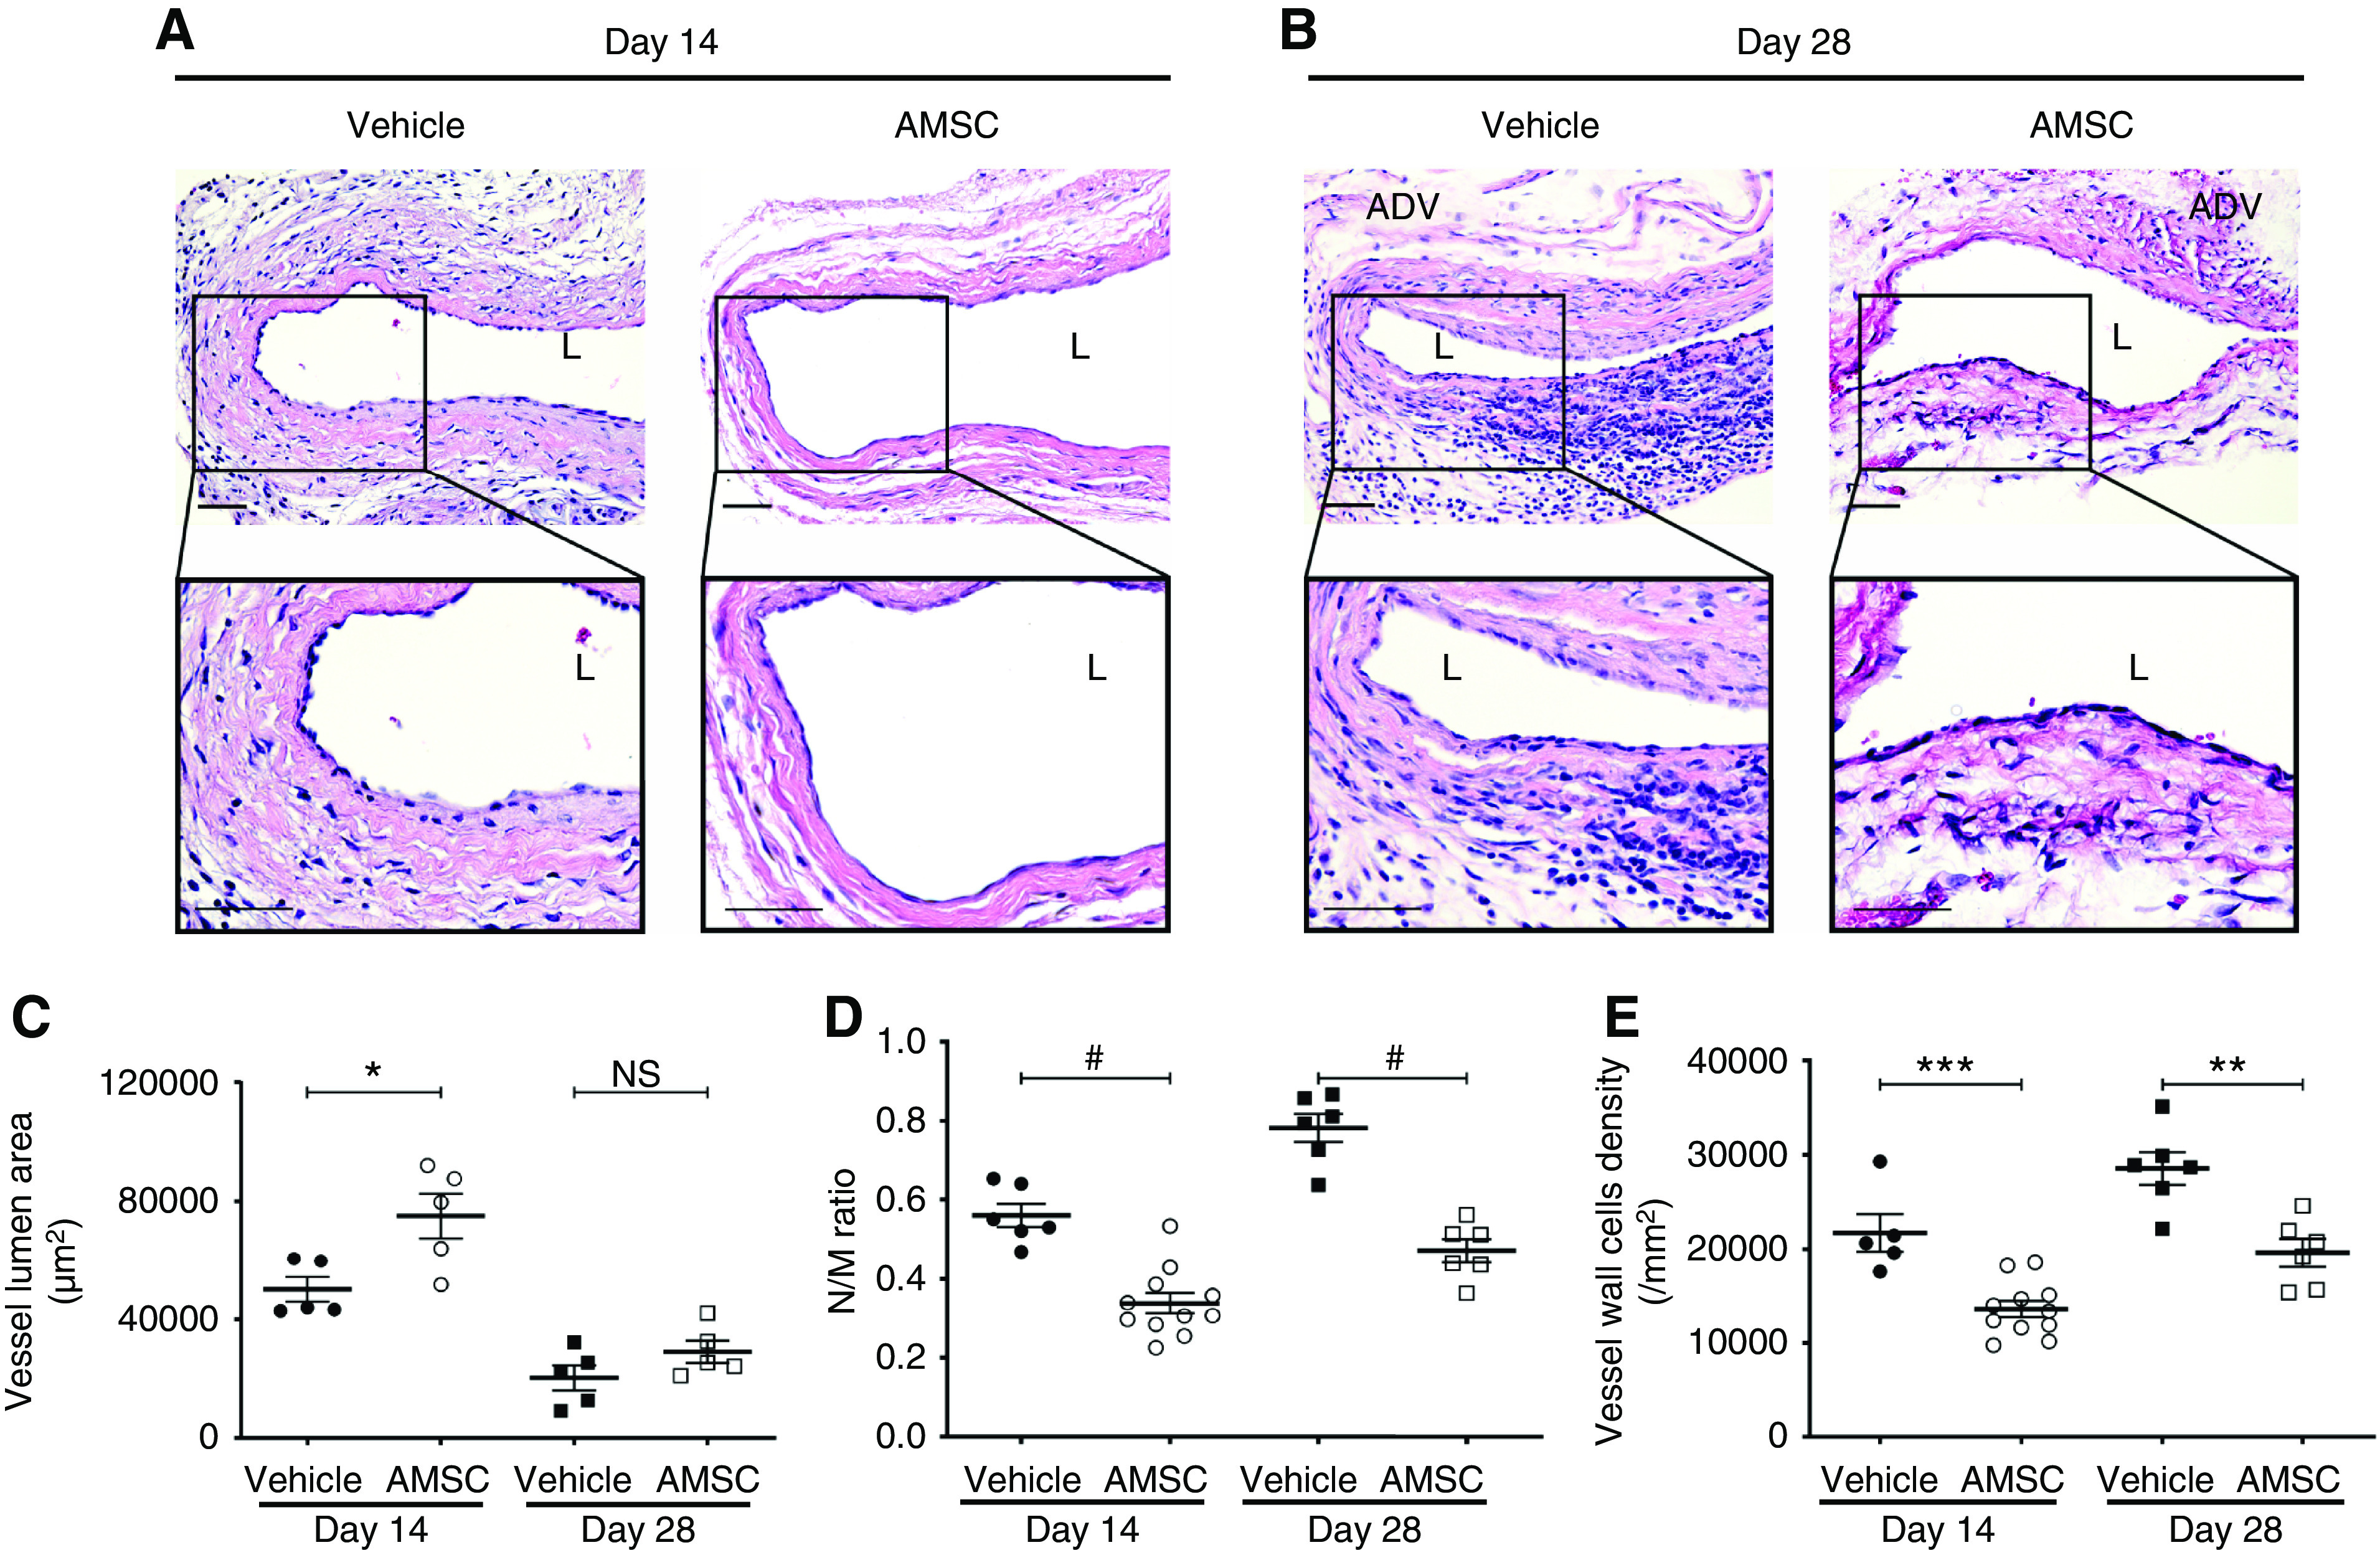
AMSC-treated vessels show outward remodeling compared with controls. (A and B) Representative hematoxylin and eosin sections for vehicle and AMSC-treated outflow veins at 14 and 28 days after PTA. (C) There was a significant increase in the average lumen area of AMSC-treated vessels compared with controls at day 14 (P<0.05). (D and E) There was a significant reduction in the average N/M ratio and vessel wall cell density in the AMSC-treated vessels compared with controls at 14 and 28 days after PTA. Scale bar, 50 μm. Each scatterplot bar graph represents the mean±SEM of five to 11 animals. t test was performed. Significant differences are indicated. *P<0.05, **P<0.01, ***P<0.001, #P<0.0001. ADV, adventitia; L, lumen.
Staining of α-SMA, Myosin Heavy Chain 11, FSP-1, and Picrosirius Red was Reduced in AMSC-Treated Vessels Compared with Controls
It has been observed that there is increased expression of α-SMA, FSP-1, and fibrosis staining in failed AVF specimens and an experimental murine angioplasty model.4,11 The changes in the outflow veins after AMSC transplantation in murine angioplasty vessels have not been determined. We first performed α-SMA staining and observed that α-SMA (+) cells were primarily observed in the neointima (Figure 5, A and B). Negative IgG staining was shown in Supplemental Figure 6. Semiquantitative analysis for α-SMA (+) cells was performed and there was a significant reduction in the average α-SMA index of AMSC-treated vessels compared with controls at day 14 (AMSC, 2.68%±0.44%; control, 6.28%±0.89%; average decrease, 57%; P<0.01; Figure 5C). We next evaluated the presence of the contractile phenotype of smooth muscle cells using myosin heavy chain 11 (MYH11) staining. There was a significant increase in the average MYH11 index of AMSC-treated vessels compared with controls at day 14 (AMSC, 8.00%±0.87%; control, 4.70%±0.93%; average increase, 172%; P<0.05; Figure 5D). Because FSP-1 (+) cells may differentiate into α-SMA (+) cells, we determined the FSP-1 index and hypothesized there would be a decrease in the AMSC-treated vessels compared with controls. There was a significant reduction in the average FSP-1 index of AMSC-treated vessels compared with controls at day 14 (AMSC, 7.73%±1.26%; control, 14.85%±1.82%; average decrease, 48%; P<0.01; Figure 5E) and day 28 (AMSC, 3.84%±0.78%; control, 8.52%±1.71%; average decrease, 55%; P<0.05; Figure 5E).
Figure 5.
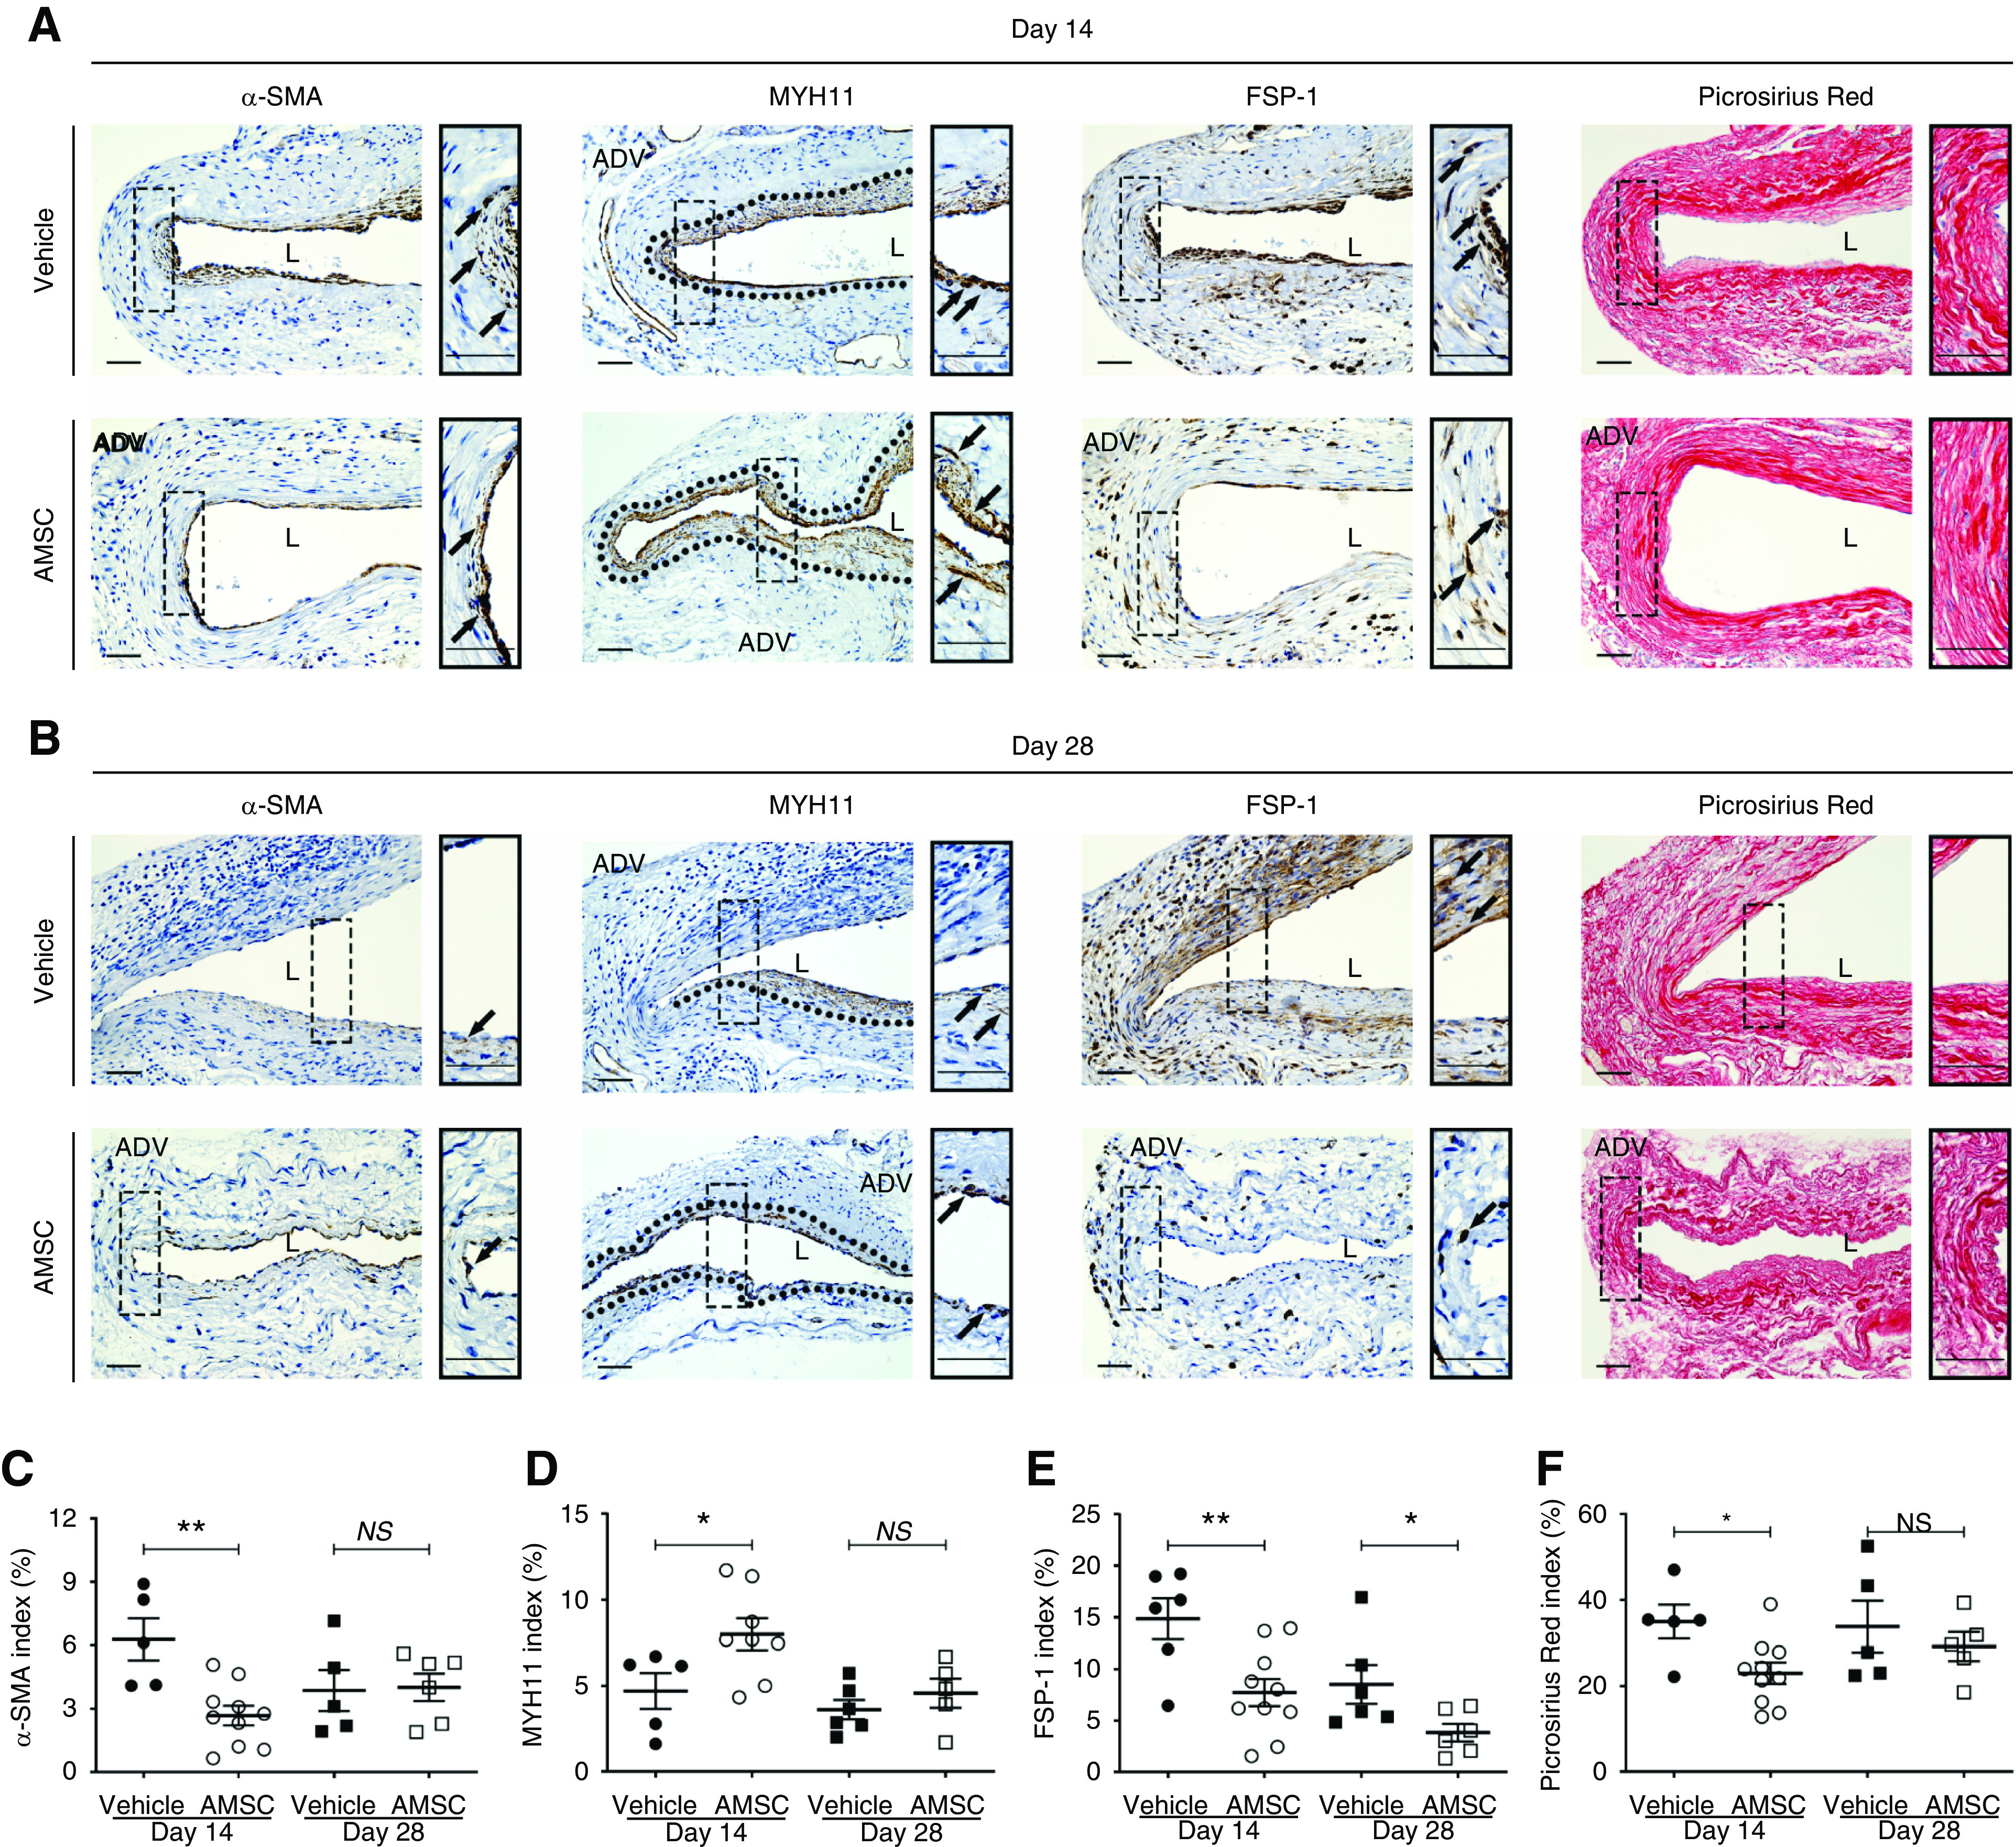
AMSCs transplantation decreases fibrosis in the PTA treated vessels. (A and B) Representative staining of α-SMA, MYH11, FSP-1, and Picrosirius Red is shown. (C, E, and F) Semiquantitative analysis showed a significant reduction in the average α-SMA, FSP-1, and Picrosirius Red staining at day 14 of AMSC-treated vessels compared with controls. At day 28, the average FSP-1 index was significantly reduced in AMSC-treated vessels. (D) There was a significant increase in the average MYH11 index of AMSC-treated vessels compared with controls at day 14. Cells staining brown are positive for α-SMA, MYH11, and FSP-1. Dark red color is positive for Picrosirius Red collagen staining. Solid arrows represent positive cells; black dashed line represents positive staining area. Scale bar, 50 μm. Each scatterplot bar graph represents the mean±SEM of five to ten animals. t test was performed. Significant differences are indicated. *P<0.05, **P<0.01. ADV, adventitia; L, lumen.
Fibrosis has been linked to restenosis after angioplasty.29 Picrosirius Red staining was performed in AMSC-treated vessels compared with controls to determine fibrosis. There was a significant decrease in the Picrosirius Red staining at day 14 in the AMSC-treated vessels compared with controls (AMSC, 22.98%±2.35%; control, 34.94%±3.52%; average decrease, 34%; P<0.05; Figure 5F).
Decrease in Inducible Nitric Oxide Synthase with an Increase in Arginase-1 Expression in AMSC-Treated Vessels
RT-PCR data showed there was less gene expression of several proinflammatory genes at day 3 in the AMSC-treated vessels compared with controls. We performed CD68, inducible nitric oxide synthase (iNOS), and arginase-1 (Arg-1) staining to assess vascular inflammation changes after angioplasty in AMSC-treated vessels compared with controls (Figure 6, A and B). We first assessed for the presence of CD68 (+) cells and observed there was no significant difference in the average CD68 index at day 14 or 28 between both groups (Figure 6, A and B). We next assessed for iNOS (M1, proinflammatory macrophages) and Arg-1 (M2, reparative macrophages) staining to determine if there was a difference in these macrophage subtypes. The average iNOS index (M1) was significantly decreased in the AMSC-treated vessels when compared with controls at day 14 (AMSC, 1.14%±0.21%; control, 2.25%±0.40%; average decrease, 49%; P<0.05; Figure 6C) accompanied with a significant increase in the average Arg-1 index (AMSC, 11.54%±0.94%; control, 5.99%±0.84%; average increase, 193%; P<0.01; Figure 6D). The average M2/M1 ratio was determined and there was a significant increase in the average M2/M1 ratio in the AMSC-treated vessels when compared with controls at day 14 (AMSC, 8.44±1.20; control, 3.22±0.32; average increase, 262%; P<0.01; Figure 6E).
Figure 6.
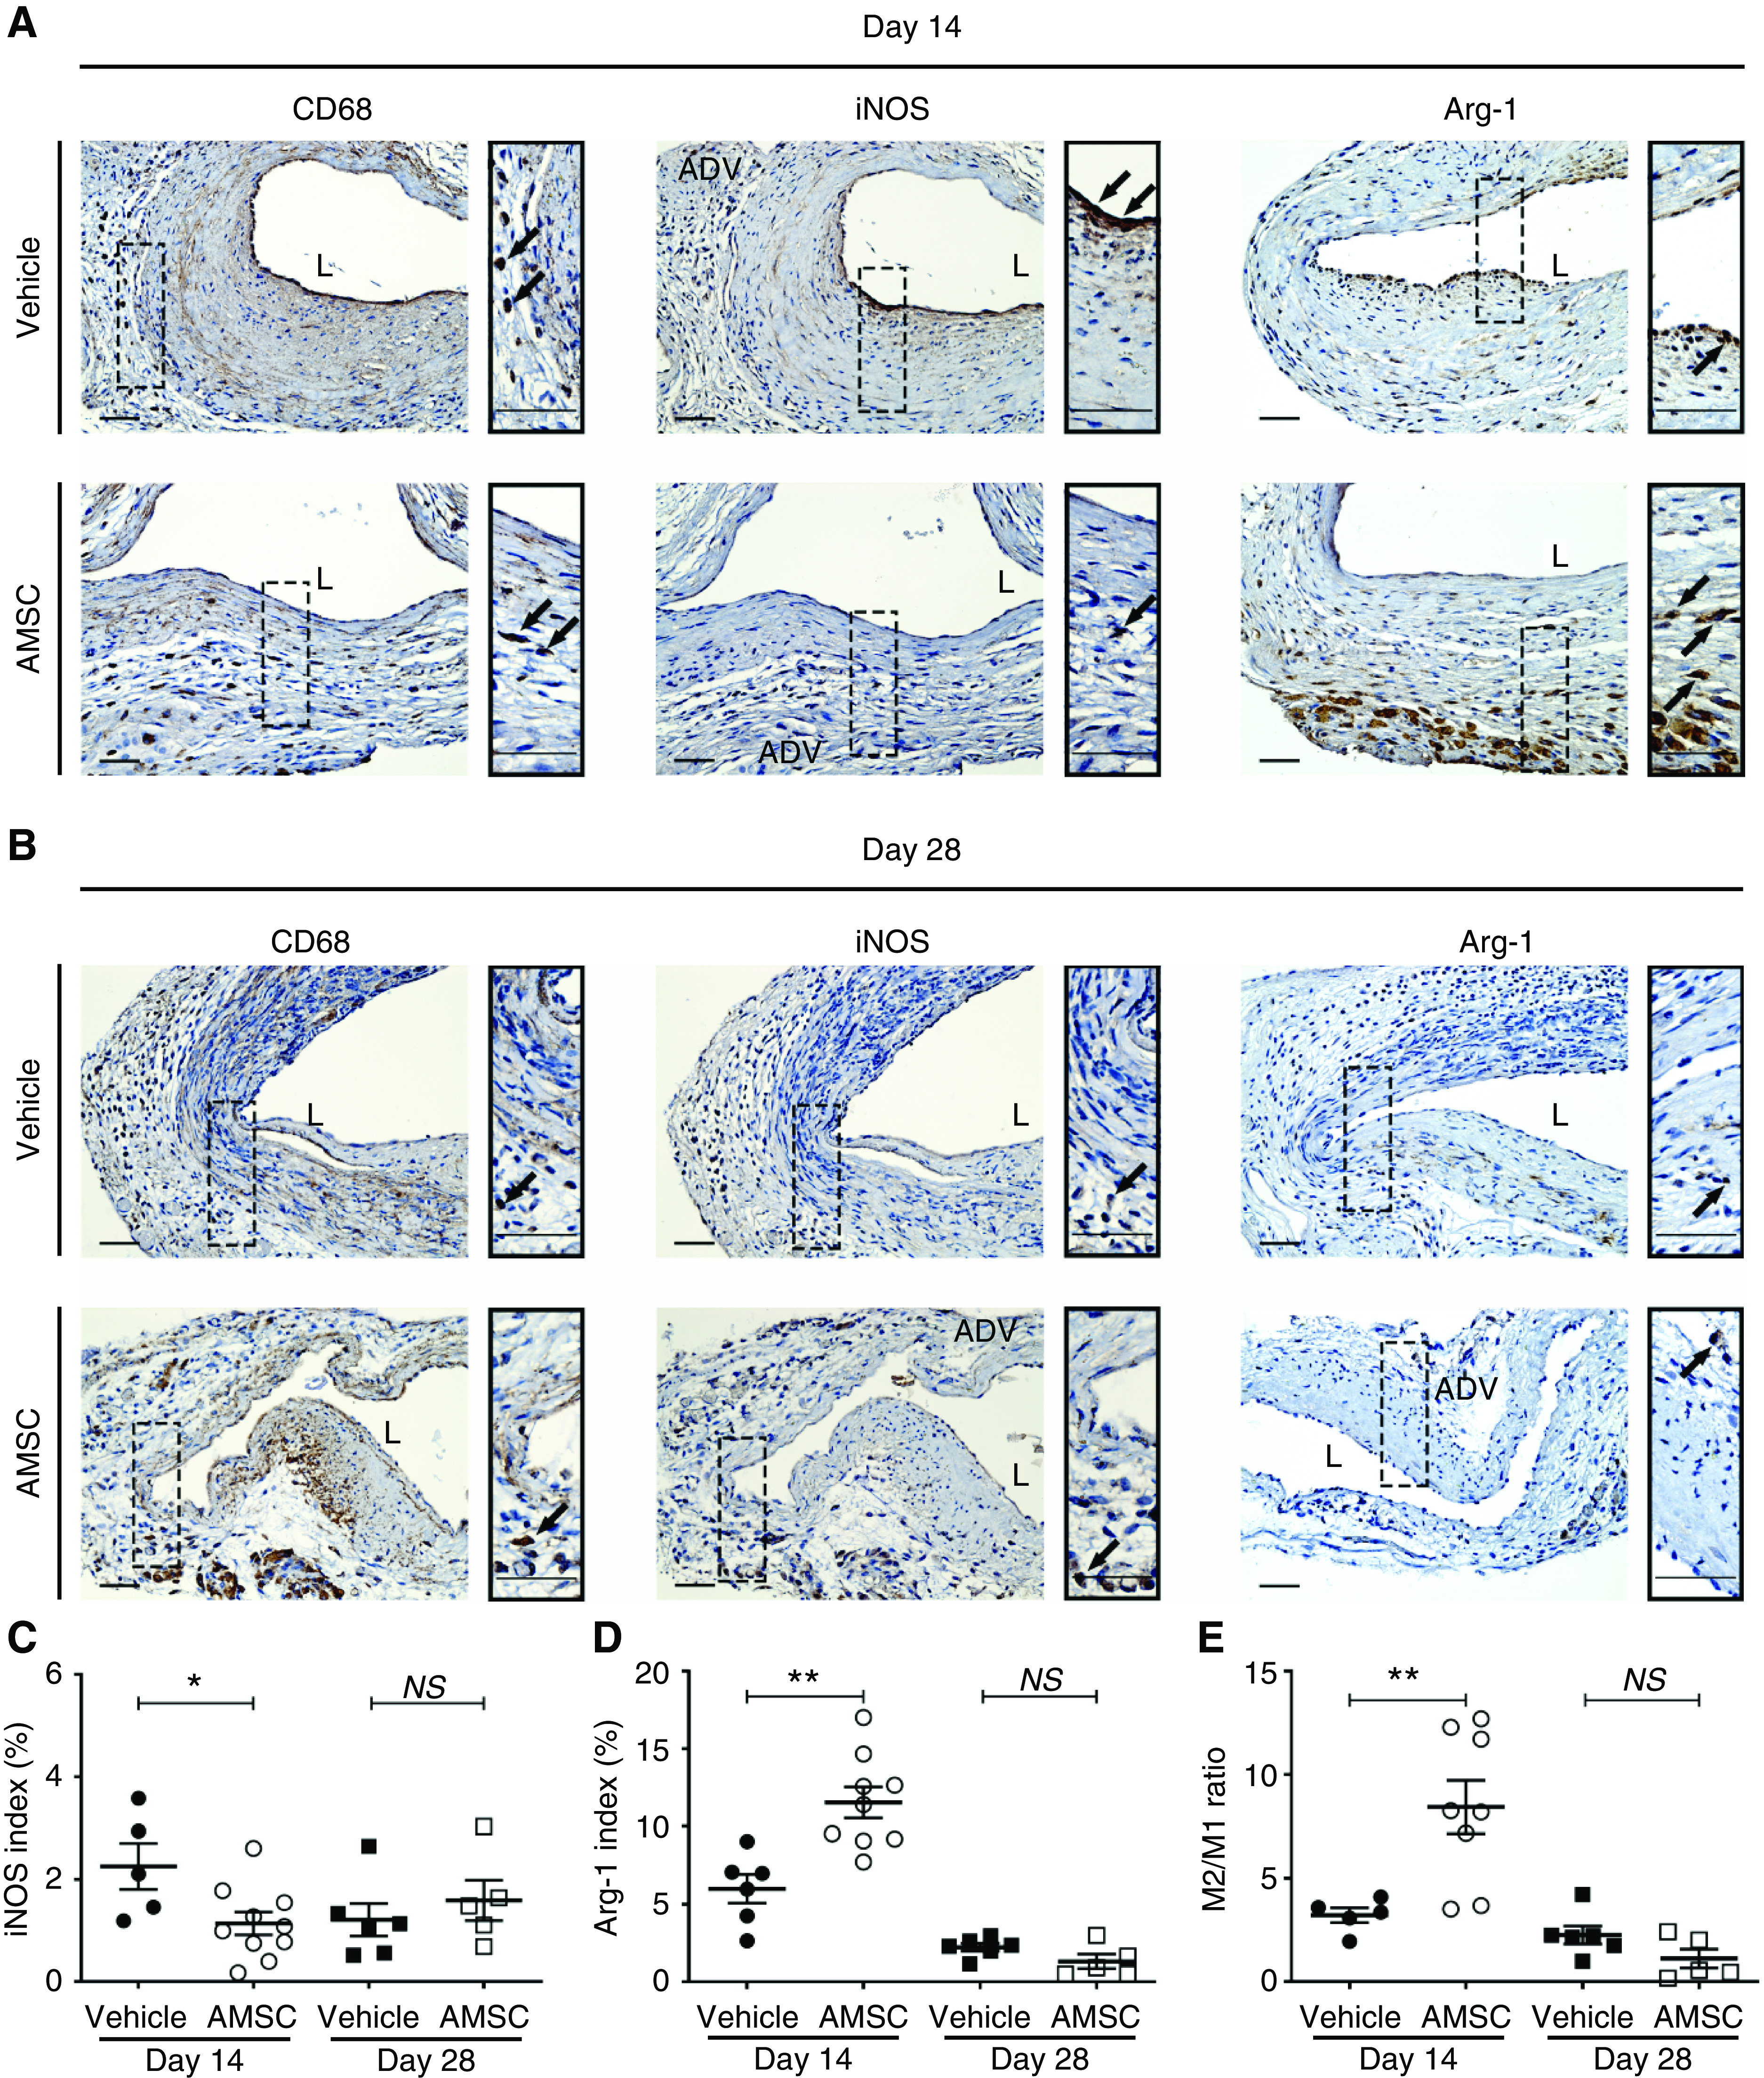
AMSCs transplantation decreases inflammatory response in PTA treated vessels. (A and B) Representative staining of CD68, iNOS, and Arg-1 is shown. (C and D) Semiquantitative analysis showed a significant reduction in the average iNOS index and a significant increase in the average Arg-1 staining at day 14 in AMSC-treated vessels compared with controls. (E) There was a significant increase in the average M2/M1 ratio in AMSC-treated vessels compared with controls at day 14, but no difference at day 28. Cells staining brown are positive for CD68, iNOS, and Arg-1. Solid arrows represent positive cells. Scale bar, 50 μm. Each scatterplot bar graph represents the mean±SEM of five to 11 CKD animals. t test was performed. Significant differences are indicated. *P<0.05, **P<0.01. ADV, adventitia; L, lumen.
Reduced Ki-67 and TUNEL Staining in AMSC-Treated Vessels Compared with Controls
Morphometric analysis demonstrated there was a decrease in the average cell wall density after AMSC transplantation. We explored whether this reduction was due to a decrease in cellular proliferation (Figure 7, A and B). There was a significant reduction in the average Ki-67 index in AMSC-treated vessels compared with controls at day 14 (AMSC, 9.11%±2.00%; control, 18.11%±3.40%; average reduction, 50%; P<0.05; Figure 7C) and day 28 (AMSC, 9.00%±2.90%; control, 23.65%±2.17%; average reduction, 62%; P<0.01; Figure 7C). Next, we performed TUNEL staining on the AMSC-treated vessels and vehicle controls to determine changes in apoptosis. There was a significant decrease in the average TUNEL index in AMSC-treated vessels compared with controls at day 14 (AMSC, 1.38%±0.16%; control, 2.50%±0.26%; average reduction, 45%; P<0.01; Figure 7D).
Figure 7.
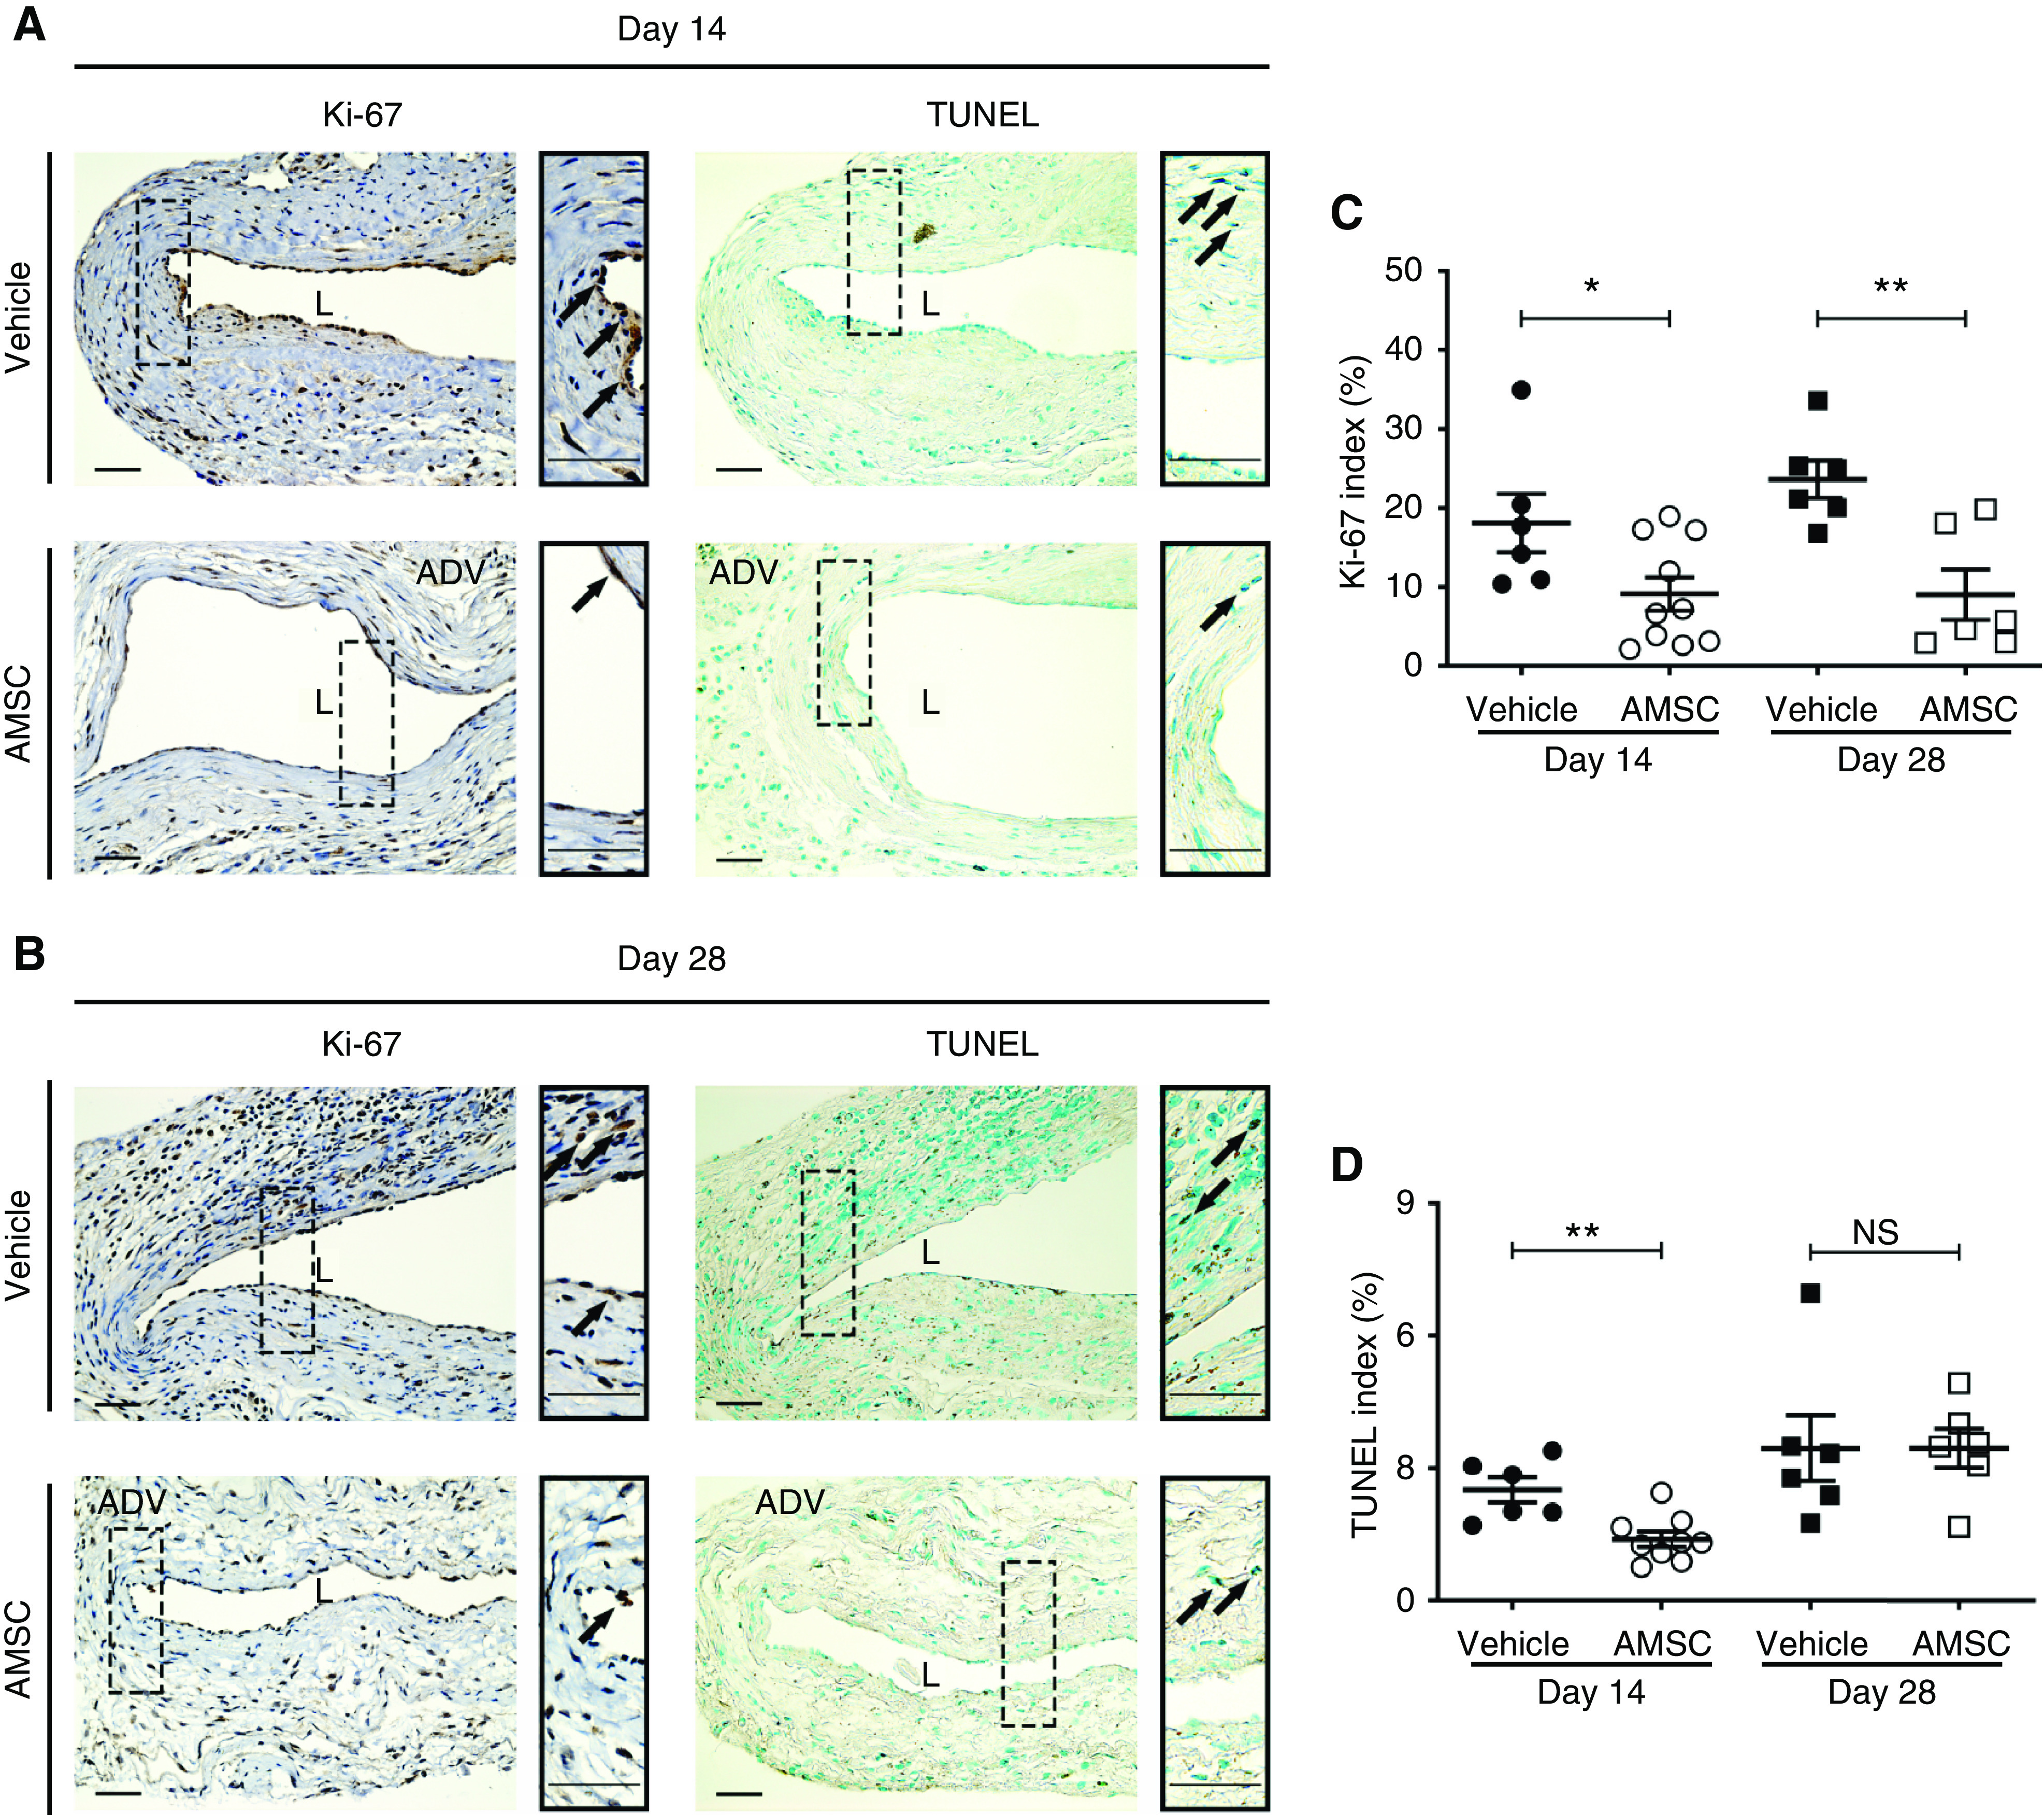
AMSC-treated vessels show decreased cellular proliferation and TUNEL staining compared with controls. (A and B) Representative staining for Ki-67 and TUNEL is shown. (C) Semiquantitative analysis showed a significant decrease in the average Ki-67 index of AMSC-treated vessels compared with controls at 14 days (P<0.05) and 28 days (P<0.01). (D) There was a significant decrease in the average TUNEL index of AMSC-treated vessels compared with controls at day 14 (P<0.01). Brown staining nuclei are positive for Ki-67 and TUNEL. Solid arrows represent positive cells. Scale bar, 50 μm. Each scatterplot bar graph represents the mean±SEM of six to ten animals. t test was performed. Significant differences are indicated. *P<0.05, **P<0.01. ADV, adventitia; L, lumen.
Localization and Differentiation of AMSCs after Adventitial Transplantation to the Outflow Veins after Angioplasty
AMSCs were isolated from mice globally expressing GFP. These cells were transplanted to the adventitia of the outflow vein of AVF created in wild-type mice after angioplasty, which allowed these cells to be tracked after delivery. Mice were euthanized and the outflow veins were stained for GFP 1, 3, 7, 14, and 28 days later (Figure 8, A–E). Semiquantitative analysis was performed for the percentage of GFP (+) cells in the adventitia of the outflow veins over time (Figure 8F). There was a reduction in the average GFP (+) cells over time. When GFP-stained sections of the outflow vein from day 14 animals were compared with day 1, there was a significant reduction of the GFP (+) cells (GFP [+] cell ratio: day 14, 2.41%±0.27%; day 1, 17.00%±3.71%; average reduction, 86%; P<0.05; Figure 8F) and day 28 (GFP [+] cell ratio: day 28, 2.01%±0.69; day 1, 17.00%±3.71%; average reduction, 88%; P<0.05; Figure 8F). We next determined if these cells might differentiate into α-SMA (+) or FSP-1 (+) cells by performing double staining for GFP (+)/α-SMA (+) and GFP (+)/FSP-1 (+). We observed a few GFP (+)/α-SMA (+) and GFP (+)/FSP-1 (+) cells in the adventitia (Figure 8, A–E, Supplemental Figure 7). Finally, we performed Ki-67 staining to determine the proliferative capacity of the AMSCs after delivery (Supplemental Figure 8). This demonstrated the cells were able to proliferate up to 28 days after adventitial delivery to the outflow vein.
Figure 8.
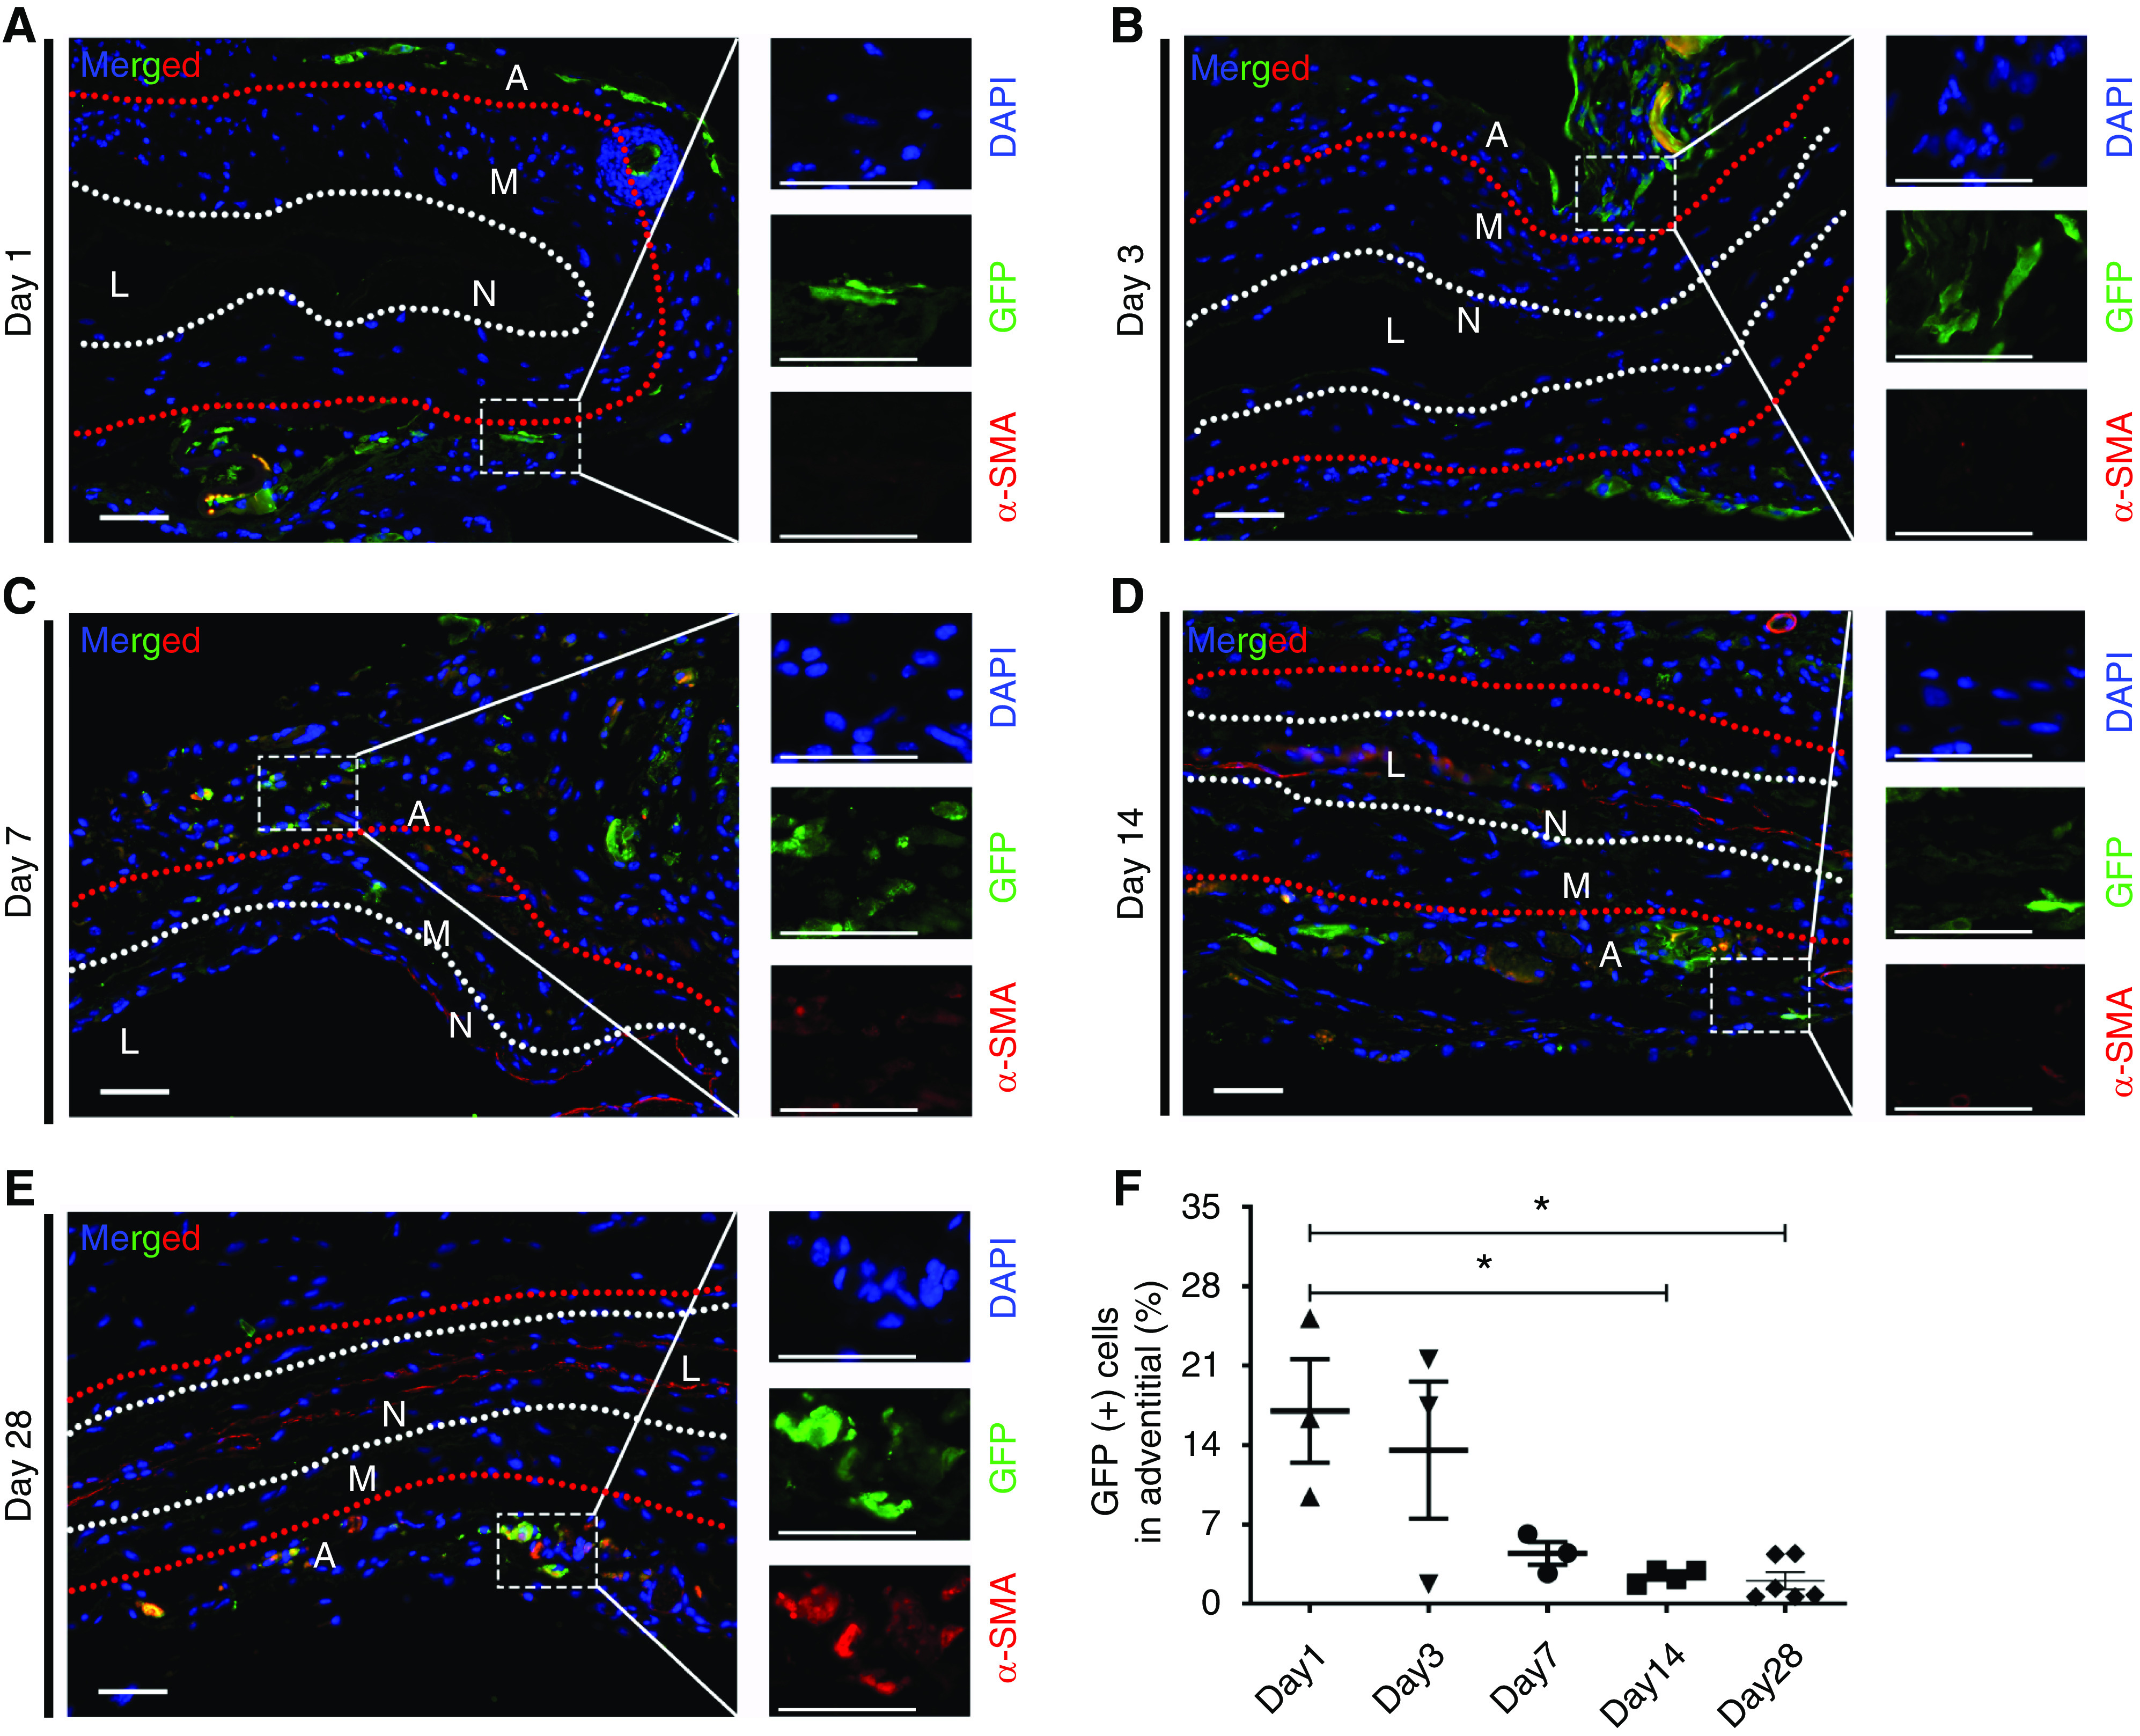
Tracking of GFP (+) AMSCs for up to 4 weeks after adventitial delivery. Representative sections costained for GFP (+)/α-SMA (+) are shown. (A–D) At 1, 3, 7, and 14 days after PTA and post-AMSC delivery, there was no costaining for GFP (+)/α-SMA (+). All the GFP (+) cells were observed in the adventitial layer. (E) GFP (+) cells showed partially positive for α-SMA. (F) Semiquantitative analysis showed a significant reduction of GFP (+) cells in the adventitia at day 14 and 28 compared with day 1. White and red dashed lines indicate three layers of the outflow vein. Blue represents 4′,6-diamidino-2-phenylindole nuclei staining (DAPI), GFP (+) cells are green, and α-SMA (+) cells stain red. Scale bar, 50 μm. One-way ANOVA with Bonferroni correction was performed. Significant differences are indicated. *P<0.05. A, adventitia; L, lumen; M, media; N, neointima.
Discussion
In this study, we demonstrated that adventitial transplantation of AMSCs to angioplasty-treated stenotic outflow vein associated with AVF in CKD mice results in reduced VNH. This was mediated by a significant reduction in the gene and protein expression of IL-1β and TNF-α in AMSC-transplanted vessels compared with controls. The reduction of these cytokines was mediated in part by cells staining positive for CD68. This was accompanied by a significant increase in the average lumen vessel area, reduced N/M ratio, reduced vessel wall cell density, and increased PV and WSS. On histologic analysis, there was a significant reduction in α-SMA, FSP-1, and proinflammatory iNOS (+) macrophages with increase in anti-inflammatory macrophages (Arg-1) staining at day 14 post-AMSC transplantation. There was a decrease in fibrosis staining (Picrosirius Red) with reduced cellular proliferation and apoptosis at day 14 when compared with vehicle control vessels. Finally, GFP (+) AMSCs could be tracked after adventitial delivery up to 28 days after delivery. These cells remained positive for Ki-67 for up to 28 days and a few were noted to differentiate into α-SMA (+) and FSP-1 (+) cells.
In experimental animal models and clinical samples removed from patients with malfunctioning hemodialysis AVF, there is increased expression of proinflammatory cytokines, including IL-1β and TNF-α, accompanied by increased staining of CD68 (+) cells.4,20,30 These observations indicate proinflammatory cues maybe responsible for stenosis formation after PTA. It is well known that AMSCs have anti-inflammatory properties and they may help to reduce venous stenosis formation after PTA.10,31,32 In this study, we used AMSCs delivered to the adventitia of the outflow vein for several reasons. Subcutaneous adipose tissue contains pluripotent cells that can differentiate into multiple different cell lineages.33 AMSCs have the practical advantage of being an easily accessible cell source because of the large numbers that can be obtained via liposuction. These cells are also available as Good Manufacturing Practices (GMP) grade cells for various applications in the clinic. Prior work from our laboratory showed a reduction in venous stenosis formation in experimental AVF, with recent completion of a phase 1 clinical trial using these cells for preventing AVF failure (ClinicalTrials.gov identifier, NCT02808208). Adventitial delivery of the cells was performed because it allowed for directed therapy to the vessel wall at the time of PTA. One advantage of this approach is that it allows for an increased delivery of cells without washout like there would be with endothelial delivery.
We recently created an experimental murine model of angioplasty of stenotic outflow veins of AVF with CKD to understand the vascular biology of VNH formation.11 We hypothesized that adventitial delivery of AMSCs would decrease the gene expression of proinflammatory cytokines and observed that the average gene expression of IL-1β and TNF-α was significantly reduced in AMSC-transplanted vessels compared with controls at day 3. Two weeks later, immunostaining of IL-1β and TNF-α was significantly decreased in the AMSC-treated vessels when compared with controls (Figure 3). Immunostaining of IL-1β and TNF-α was performed to identify the cells responsible for the reduction of these cytokines and it demonstrated that this was due to CD68 (+) cells (Supplemental Figures 3 and 4), which is consistent with other reports.34 Because there was a reduction in proinflammatory cytokines, we evaluated the changes in vascular inflammation by performing staining for CD68, iNOS (M1), and Arg-1 (M2). We observed no change in CD68 at either time point but did observe an increase in M2/M1 ratio, demonstrating an increased anti-inflammatory macrophage phenotype with a reduction in proinflammatory macrophages. Reducing inflammatory drive in AVF has been shown to improve patency both in clinical and experimental studies.4,20,30,35–37
Studies conducted in our laboratory and elsewhere have demonstrated that adventitial and medial fibroblasts can differentiate into myofibroblasts (α-SMA–positive cells) that can proliferate and migrate, leading to VNH formation.20,38 In this study, there was a significant reduction in FSP-1– (a marker for fibroblasts) and α-SMA–positive cells in AMSC-treated vessels. We performed anti-MYH11 staining to identify the contractile phenotype of smooth muscle cells. There was an increase in MYH11 staining in AMSC-treated vessels when compared with controls (Figure 5).
We used Doppler US to evaluate the AVF function after AMSC or control delivery after PTA. In this model, we created a 90° anastomosis of the side of the carotid artery to the end of the jugular vein. This angle creates high WSS compared with an anastomosis angle of 45°, as demonstrated previously.39 Experimental and clinical studies demonstrate that blood flow velocity and WSS are negatively correlated to VNH and restenosis.40,41 In PTA plus AMSC-treated vessels, there was an increase in WSS as well. However, AVF remodeling occurs over time, and the increased turbulent flow and shear stress need to be further investigated to illustrate their effect on restenosis at different periods after PTA procedures. AMSC-treated vessels showed increased blood flow rate with decreased PI. Increased PI has been associated with increased stenosis and thrombosis.28
The GFP signal from AMSC-transplanted cells from GFP mice remained present in the adventitia of the outflow veins up to 28 days after delivery. This result confirmed the cells were in contact with the adventitia of the outflow vein for a prolonged period after delivery. This is consistent with our previous observation using 89Zirconium-labeled AMSCs for tracking experiments for >2 weeks.10 In addition, the AMSCs showed positive staining of Ki-67 (Supplemental Figure 8). This indicates that AMSCs have proliferative ability after transplantation as previously shown.42 A few of the transplanted AMSCs were able to dedifferentiate into α-SMA (+) and FSP-1 (+) cells. These observations are consistent with other studies that have demonstrated that MSCs can differentiate into α-SMA (+) cells.43,44
There are several limitations to this study. First, we used an allogeneic AMSC transplantation model, and there is a potential for an immunologic reaction after transplantation in the treatment group. Another weakness is that the murine model experiment used only one dose; thus, the effects of higher dosages or multiple doses should be evaluated in the future. We measured blood flow in the inflow artery because it was difficult to calculate in the outflow vein, partly due to the high heart rate and proximity to the heart. To perform the PTA procedure in mice, we created an AVF which has similar blood flow rates as the aortocaval murine AVF model.17 Finally, these results need to be confirmed in larger animal models because the murine model may not simulate the clinical scenario.
In conclusion, we demonstrated that adventitial transplantation of murine AMSCs to the stenotic outflow vein after PTA results in a decrease in the average gene expression of IL-1β and TNF-α. This leads to a reduction in smooth muscle cells, fibroblasts, and proinflammatory macrophages as well as VNH, accompanied by a decrease in cell proliferation, and venous fibrosis with positive vascular remodeling. Our study is clinically important because it provides a rationale to investigate a new therapeutic strategy using AMSCs for reducing restenosis after angioplasty in patients on hemodialysis with AVFs.
Disclosures
S. Misra has a patent pending. All remaining authors have nothing to disclose.
Funding
This work has been funded by National Institute of Health grants HL098967 and DK107870 (to S. Misra).
Supplementary Material
Acknowledgments
The authors acknowledge the assistance of Lucy Bahn in the preparation of this manuscript.
The results presented in this paper have not been published previously in whole or part.
Footnotes
Published online ahead of print. Publication date available at www.jasn.org.
Supplemental Material
This article contains the following supplemental material online at http://jasn.asnjournals.org/lookup/suppl/doi:10.1681/ASN.2019101042/-/DCSupplemental.
Supplemental Figure 1. Outline of the study.
Supplemental Figure 2. Mice outcomes after AMSC transplantation and vehicle controls.
Supplemental Figure 3. Co-staining for IL-1β/CD68/FSP-1/α-SMA.
Supplemental Figure 4. Co-staining for TNF-α/CD68/FSP-1/α-SMA.
Supplemental Figure 5. Tissue processing after the PTA procedure.
Supplemental Figure 6. Negative and positive control staining.
Supplemental Figure 7. Fibroblast specific protein 1 (FSP-1) staining for AMSC tracking experiment.
Supplemental Figure 8. Proliferation (Ki-67) staining for AMSC tracking experiment.
Supplemental Table 1. Primer information for qRT-PCR.
Supplemental Table 2. Antibodies used for immunohistochemistry and immunofluorescence staining.
References
- 1.Saran R, Robinson B, Abbott KC, Agodoa LYC, Bhave N, Bragg-Gresham J, et al.: US Renal Data System 2017 annual data report: epidemiology of kidney disease in the United States [published correction appears in Am J Kidney Dis 71: 501, 2018]. Am J Kidney Dis 71[Suppl 1]: A7, 2018. [DOI] [PMC free article] [PubMed] [Google Scholar]
- 2.Vascular Access 2006 Work Group : Clinical practice guidelines for vascular access. Am J Kidney Dis 48[Suppl 1]: S176–S247, 2006. [DOI] [PubMed] [Google Scholar]
- 3.Al-Jaishi AA, Oliver MJ, Thomas SM, Lok CE, Zhang JC, Garg AX, et al.: Patency rates of the arteriovenous fistula for hemodialysis: A systematic review and meta-analysis. Am J Kidney Dis 63: 464–478, 2014. [DOI] [PubMed] [Google Scholar]
- 4.Brahmbhatt A, Remuzzi A, Franzoni M, Misra S: The molecular mechanisms of hemodialysis vascular access failure. Kidney Int 89: 303–316, 2016. [DOI] [PMC free article] [PubMed] [Google Scholar]
- 5.Bountouris I, Kristmundsson T, Dias N, Zdanowski Z, Malina M: Is repeat PTA of a failing hemodialysis fistula durable? Int J Vasc Med 2014: 369687, 2014. [DOI] [PMC free article] [PubMed] [Google Scholar]
- 6.Phinney DG, Prockop DJ: Concise review: Mesenchymal stem/multipotent stromal cells: The state of transdifferentiation and modes of tissue repair--current views. Stem Cells 25: 2896–2902, 2007. [DOI] [PubMed] [Google Scholar]
- 7.Gulati R, Jevremovic D, Peterson TE, Witt TA, Kleppe LS, Mueske CS, et al.: Autologous culture-modified mononuclear cells confer vascular protection after arterial injury. Circulation 108: 1520–1526, 2003. [DOI] [PubMed] [Google Scholar]
- 8.Kim AK, Kim MH, Kim DH, Go HN, Cho SW, Um SH, et al.: Inhibitory effects of mesenchymal stem cells in intimal hyperplasia after balloon angioplasty. J Vasc Surg 63: 510–517, 2016. [DOI] [PubMed] [Google Scholar]
- 9.Werner N, Junk S, Laufs U, Link A, Walenta K, Bohm M, et al.: Intravenous transfusion of endothelial progenitor cells reduces neointima formation after vascular injury. Circ Res 93: e17–e24, 2003. [DOI] [PubMed] [Google Scholar]
- 10.Yang B, Brahmbhatt A, Nieves Torres E, Thielen B, McCall DL, Engel S, et al.: Tracking and therapeutic value of human adipose tissue-derived mesenchymal stem cell transplantation in reducing venous neointimal hyperplasia associated with arteriovenous fistula. Radiology 279: 513–522, 2016. [DOI] [PMC free article] [PubMed] [Google Scholar]
- 11.Cai C, Yang B, Kilari S, Li Y, Zhao C, Sharma A, et al.: Evaluation of venous stenosis angioplasty in a murine arteriovenous fistula model. J Vasc Interv Radiol 30: 1512–1521.e3, 2019 [DOI] [PMC free article] [PubMed] [Google Scholar]
- 12.Cai C, Zhao C, Kilari S, Sharma A, Singh AK, Simeon ML, et al.: Effect of sex differences in treatment response to angioplasty in a murine arteriovenous fistula model. Am J Physiol Renal Physiol 318: F565–F575, 2020. [DOI] [PMC free article] [PubMed] [Google Scholar]
- 13.Dudakovic A, Camilleri E, Riester SM, Lewallen EA, Kvasha S, Chen X, et al.: High-resolution molecular validation of self-renewal and spontaneous differentiation in clinical-grade adipose-tissue derived human mesenchymal stem cells. J Cell Biochem 115: 1816–1828, 2014. [DOI] [PMC free article] [PubMed] [Google Scholar]
- 14.Yang B, Vohra PK, Janardhanan R, Misra KD, Misra S: Expression of profibrotic genes in a murine remnant kidney model. J Vasc Interv Radiol 22: 1765–1772.e1, 2011 [DOI] [PMC free article] [PubMed] [Google Scholar]
- 15.Misra S, Fu AA, Puggioni A, Karimi KM, Mandrekar JN, Glockner JF, et al.: Increased shear stress with upregulation of VEGF-A and its receptors and MMP-2, MMP-9, and TIMP-1 in venous stenosis of hemodialysis grafts. Am J Physiol Heart Circ Physiol 294: H2219–H2230, 2008. [DOI] [PMC free article] [PubMed] [Google Scholar]
- 16.Pike D, Shiu Y-T, Cho Y-F, Le H, Somarathna M, Isayeva T, et al.: The effect of endothelial nitric oxide synthase on the hemodynamics and wall mechanics in murine arteriovenous fistulas [published correction appears in Sci Rep 9: 15555, 2019]. Sci Rep 9: 4299, 2019. [DOI] [PMC free article] [PubMed] [Google Scholar]
- 17.Yamamoto K, Protack CD, Tsuneki M, Hall MR, Wong DJ, Lu DY, et al.: The mouse aortocaval fistula recapitulates human arteriovenous fistula maturation. Am J Physiol Heart Circ Physiol 305: H1718–H1725, 2013. [DOI] [PMC free article] [PubMed] [Google Scholar]
- 18.Riches AC, Sharp JG, Thomas DB, Smith SV: Blood volume determination in the mouse. J Physiol 228: 279–284, 1973. [DOI] [PMC free article] [PubMed] [Google Scholar]
- 19.Zamboli P, Fiorini F, D’Amelio A, Fatuzzo P, Granata A: Color Doppler ultrasound and arteriovenous fistulas for hemodialysis. J Ultrasound 17: 253–263, 2014. [DOI] [PMC free article] [PubMed] [Google Scholar]
- 20.Brahmbhatt A, NievesTorres E, Yang B, Edwards WD, Roy Chaudhury P, Lee MK, et al.: The role of Iex-1 in the pathogenesis of venous neointimal hyperplasia associated with hemodialysis arteriovenous fistula. PLoS One 9: e102542, 2014. [DOI] [PMC free article] [PubMed] [Google Scholar]
- 21.Camilleri ET, Gustafson MP, Dudakovic A, Riester SM, Garces CG, Paradise CR, et al.: Identification and validation of multiple cell surface markers of clinical-grade adipose-derived mesenchymal stromal cells as novel release criteria for good manufacturing practice-compliant production. Stem Cell Res Ther 7: 107, 2016. [DOI] [PMC free article] [PubMed] [Google Scholar]
- 22.Ene-Iordache B, Remuzzi A: Disturbed flow in radial-cephalic arteriovenous fistulae for haemodialysis: Low and oscillating shear stress locates the sites of stenosis. Nephrol Dial Transplant 27: 358–368, 2012. [DOI] [PubMed] [Google Scholar]
- 23.Hashimoto T, Isaji T, Hu H, Yamamoto K, Bai H, Santana JM, et al.: Stimulation of caveolin-1 signaling improves arteriovenous fistula patency. Arterioscler Thromb Vasc Biol 39: 754–764, 2019. [DOI] [PMC free article] [PubMed] [Google Scholar]
- 24.Browne LD, Bashar K, Griffin P, Kavanagh EG, Walsh SR, Walsh MT: The role of shear stress in arteriovenous fistula maturation and failure: a systematic review. PLoS One 10: e0145795, 2015. [DOI] [PMC free article] [PubMed] [Google Scholar]
- 25.Yellin EL: Laminar-turbulent transition process in pulsatile flow. Circ Res 19: 791–804, 1966. [DOI] [PubMed] [Google Scholar]
- 26.Kang L, Grande JP, Hillestad ML, Croatt AJ, Barry MA, Katusic ZS, et al.: A new model of an arteriovenous fistula in chronic kidney disease in the mouse: beneficial effects of upregulated heme oxygenase-1. Am J Physiol Renal Physiol 310: F466–F476, 2016. [DOI] [PMC free article] [PubMed] [Google Scholar]
- 27.Konner K, Nonnast-Daniel B, Ritz E: The arteriovenous fistula. J Am Soc Nephrol 14: 1669–1680, 2003. [DOI] [PubMed] [Google Scholar]
- 28.Ren C, Chen J, Wang Y, Huang B, Lu W, Cao Y, et al.: Application of ultrasonography in monitoring the complications of autologous arteriovenous fistula in hemodialysis patients. Medicine (Baltimore) 97: e12994, 2018. [DOI] [PMC free article] [PubMed] [Google Scholar]
- 29.Bauters C, Isner JM: The biology of restenosis. Prog Cardiovasc Dis 40: 107–116, 1997. [DOI] [PubMed] [Google Scholar]
- 30.Yang B, Kilari S, Brahmbhatt A, McCall DL, Torres EN, Leof EB, et al.: CorMatrix wrapped around the adventitia of the arteriovenous fistula outflow vein attenuates venous neointimal hyperplasia. Sci Rep 7: 14298, 2017. [DOI] [PMC free article] [PubMed] [Google Scholar]
- 31.Chang CL, Chen HH, Chen KH, Chiang JY, Li YC, Lin HS, et al.: Adipose-derived mesenchymal stem cell-derived exosomes markedly protected the brain against sepsis syndrome induced injury in rat. Am J Transl Res 11: 3955–3971, 2019. [PMC free article] [PubMed] [Google Scholar]
- 32.Chang CL, Sung PH, Chen KH, Shao PL, Yang CC, Cheng BC, et al.: Adipose-derived mesenchymal stem cell-derived exosomes alleviate overwhelming systemic inflammatory reaction and organ damage and improve outcome in rat sepsis syndrome. Am J Transl Res 10: 1053–1070, 2018. [PMC free article] [PubMed] [Google Scholar]
- 33.Zuk PA, Zhu M, Mizuno H, Huang J, Futrell JW, Katz AJ, et al.: Multilineage cells from human adipose tissue: Implications for cell-based therapies. Tissue Eng 7: 211–228, 2001. [DOI] [PubMed] [Google Scholar]
- 34.Unanue ER, Beller DI, Calderon J, Kiely JM, Stadecker MJ: Regulation of immunity and inflammation by mediators from macrophages. Am J Pathol 85: 465–478, 1976. [PMC free article] [PubMed] [Google Scholar]
- 35.Nieves Torres EC, Yang B, Roy B, Janardhanan R, Brahmbhatt A, Leof E, et al.: Adventitial delivery of lentivirus-shRNA-ADAMTS-1 reduces venous stenosis formation in arteriovenous fistula [published correction appears in PLoS One 9: e113312, 2014]. PLoS One 9: e94510, 2014. [DOI] [PMC free article] [PubMed] [Google Scholar]
- 36.Wan Q, Li L, Yang S, Chu F: Impact of statins on arteriovenous fistulas outcomes: A meta-analysis. Ther Apher Dial 22: 67–72, 2018. [DOI] [PubMed] [Google Scholar]
- 37.Chang HH, Chang YK, Lu CW, Huang CT, Chien CT, Hung KY, et al.: Statins improve long term patency of arteriovenous fistula for hemodialysis. Sci Rep 6: 22197, 2016. [DOI] [PMC free article] [PubMed] [Google Scholar]
- 38.Wang Y, Krishnamoorthy M, Banerjee R, Zhang J, Rudich S, Holland C, et al.: Venous stenosis in a pig arteriovenous fistula model--anatomy, mechanisms and cellular phenotypes. Nephrol Dial Transplant 23: 525–533, 2008. [DOI] [PubMed] [Google Scholar]
- 39.Hull JE, Balakin BV, Kellerman BM, Wrolstad DK: Computational fluid dynamic evaluation of the side-to-side anastomosis for arteriovenous fistula. J Vasc Surg 58: 187–93.e1, 2013. [DOI] [PubMed] [Google Scholar]
- 40.Kohler TR, Kirkman TR, Kraiss LW, Zierler BK, Clowes AW: Increased blood flow inhibits neointimal hyperplasia in endothelialized vascular grafts. Circ Res 69: 1557–1565, 1991. [DOI] [PubMed] [Google Scholar]
- 41.Hofstra L, Tordoir JH, Kitslaar PJ, Hoeks AP, Daemen MJ: Enhanced cellular proliferation in intact stenotic lesions derived from human arteriovenous fistulas and peripheral bypass grafts. Does it correlate with flow parameters? Circulation 94: 1283–1290, 1996. [DOI] [PubMed] [Google Scholar]
- 42.Mizuno H, Tobita M, Uysal AC: Concise review: Adipose-derived stem cells as a novel tool for future regenerative medicine. Stem Cells 30: 804–810, 2012. [DOI] [PubMed] [Google Scholar]
- 43.Yoon YS, Wecker A, Heyd L, Park JS, Tkebuchava T, Kusano K, et al.: Clonally expanded novel multipotent stem cells from human bone marrow regenerate myocardium after myocardial infarction. J Clin Invest 115: 326–338, 2005. [DOI] [PMC free article] [PubMed] [Google Scholar]
- 44.Gojo S, Umezawa A: Plasticity of mesenchymal stem cells--regenerative medicine for diseased hearts. Hum Cell 16: 23–30, 2003. [DOI] [PubMed] [Google Scholar]
Associated Data
This section collects any data citations, data availability statements, or supplementary materials included in this article.